Races in Franklin Square, New York (NY) Detailed Stats
Data:
Races - White alone (%)
Races - White alone (% change since 2000)
Races - Black alone (%)
Races - Black alone (% change since 2000)
Races - American Indian alone (%)
Races - American Indian alone (% change since 2000)
Races - Asian alone (%)
Races - Asian alone (% change since 2000)
Races - Hispanic (%)
Races - Hispanic (% change since 2000)
Races - Native Hawaiian and Other Pacific Islander alone (%)
Races - Native Hawaiian and Other Pacific Islander alone (% change since 2000)
Races - Two or more races(%)
Races - Two or more races(% change since 2000)
Races - Other race alone (%)
Races - Other race alone (% change since 2000)
Racial diversity
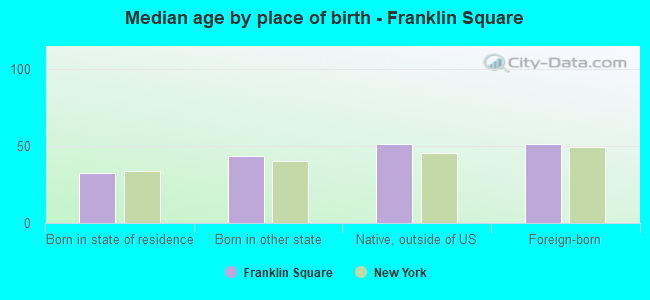
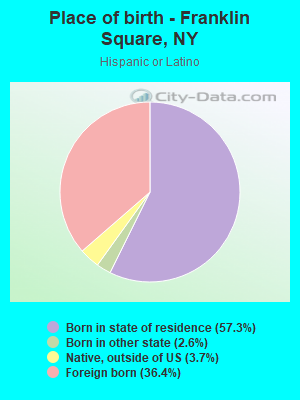
Place of birth - Born in state of residence (%)
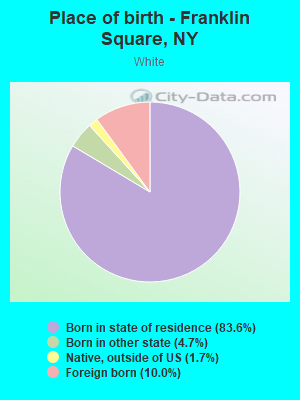
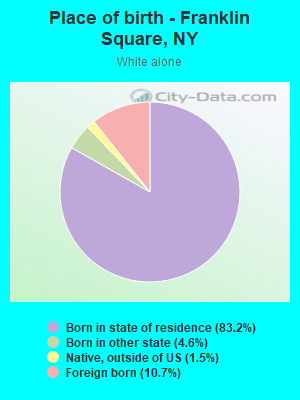
Place of birth - Born in state of residence (%) - White
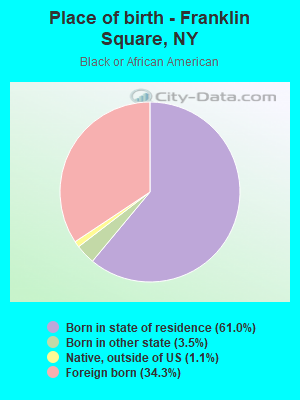
Place of birth - Born in state of residence (%) - Black or African American
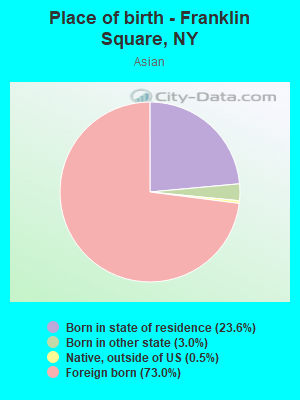
Place of birth - Born in state of residence (%) - Asian
Place of birth - Born in state of residence (%) - Hispanic or Latino
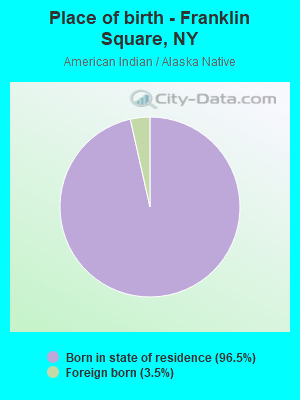
Place of birth - Born in state of residence (%) - American Indian and Alaska Native
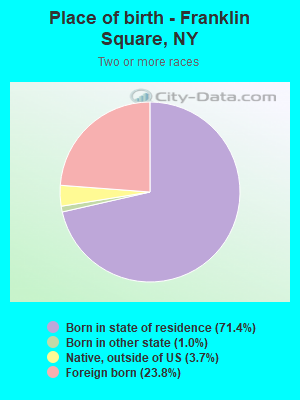
Place of birth - Born in state of residence (%) - Multirace
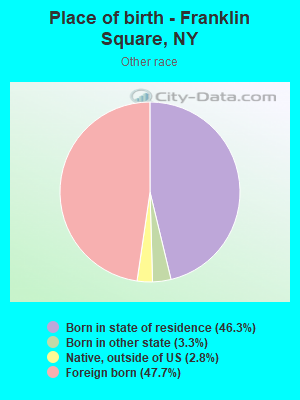
Place of birth - Born in state of residence (%) - Other Race
Place of birth - Born in other state (%)
Place of birth - Born in other state (%) - White
Place of birth - Born in other state (%) - Black or African American
Place of birth - Born in other state (%) - Asian
Place of birth - Born in other state (%) - Hispanic or Latino
Place of birth - Born in other state (%) - American Indian and Alaska Native
Place of birth - Born in other state (%) - Multirace
Place of birth - Born in other state (%) - Other Race
Place of birth - Native, outside of US (%)
Place of birth - Native, outside of US (%) - White
Place of birth - Native, outside of US (%) - Black or African American
Place of birth - Native, outside of US (%) - Asian
Place of birth - Native, outside of US (%) - Hispanic or Latino
Place of birth - Native, outside of US (%) - American Indian and Alaska Native
Place of birth - Native, outside of US (%) - Multirace
Place of birth - Native, outside of US (%) - Other Race
Place of birth - Foreign born (%)
Place of birth - Foreign born (%) - White
Place of birth - Foreign born (%) - Black or African American
Place of birth - Foreign born (%) - Asian
Place of birth - Foreign born (%) - Hispanic or Latino
Place of birth - Foreign born (%) - American Indian and Alaska Native
Place of birth - Foreign born (%) - Multirace
Place of birth - Foreign born (%) - Other Race
Residents speaking English at home (%)
Residents speaking English at home - Born in the United States (%)
Residents speaking English at home - Native, born elsewhere (%)
Residents speaking English at home - Foreign born (%)
Residents speaking Spanish at home (%)
Residents speaking Spanish at home - Born in the United States (%)
Residents speaking Spanish at home - Native, born elsewhere (%)
Residents speaking Spanish at home - Foreign born (%)
Residents speaking other language at home (%)
Residents speaking other language at home - Born in the United States (%)
Residents speaking other language at home - Native, born elsewhere (%)
Residents speaking other language at home - Foreign born (%)
Marital status - Never married (%)
Marital status - Now married (%)
Marital status - Separated (%)
Marital status - Widowed (%)
Marital status - Divorced (%)
Ancestries Reported - Arab (%)
Ancestries Reported - Czech (%)
Ancestries Reported - Danish (%)
Ancestries Reported - Dutch (%)
Ancestries Reported - English (%)
Ancestries Reported - French (%)
Ancestries Reported - French Canadian (%)
Ancestries Reported - German (%)
Ancestries Reported - Greek (%)
Ancestries Reported - Hungarian (%)
Ancestries Reported - Irish (%)
Ancestries Reported - Italian (%)
Ancestries Reported - Lithuanian (%)
Ancestries Reported - Norwegian (%)
Ancestries Reported - Polish (%)
Ancestries Reported - Portuguese (%)
Ancestries Reported - Russian (%)
Ancestries Reported - Scotch-Irish (%)
Ancestries Reported - Scottish (%)
Ancestries Reported - Slovak (%)
Ancestries Reported - Subsaharan African (%)
Ancestries Reported - Swedish (%)
Ancestries Reported - Swiss (%)
Ancestries Reported - Ukrainian (%)
Ancestries Reported - United States (%)
Ancestries Reported - Welsh (%)
Ancestries Reported - West Indian (%)
Ancestries Reported - Other (%)
Geographical mobility - Same house 1 year ago (%)
Geographical mobility - Same house 1 year ago (%) - White
Geographical mobility - Same house 1 year ago (%) - Black or African American
Geographical mobility - Same house 1 year ago (%) - Asian
Geographical mobility - Same house 1 year ago (%) - Hispanic or Latino
Geographical mobility - Same house 1 year ago (%) - American Indian and Alaska Native
Geographical mobility - Same house 1 year ago (%) - Multirace
Geographical mobility - Same house 1 year ago (%) - Other Race
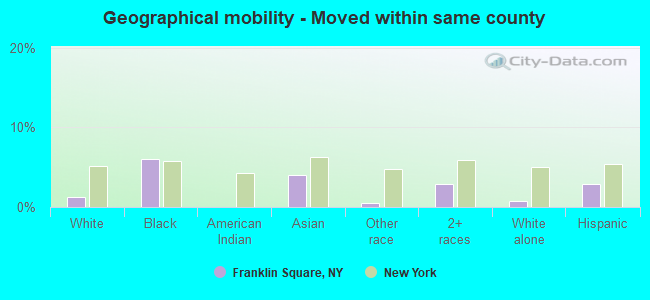
Geographical mobility - Moved within same county (%)
Geographical mobility - Moved within same county (%) - White
Geographical mobility - Moved within same county (%) - Black or African American
Geographical mobility - Moved within same county (%) - Asian
Geographical mobility - Moved within same county (%) - Hispanic or Latino
Geographical mobility - Moved within same county (%) - American Indian and Alaska Native
Geographical mobility - Moved within same county (%) - Multirace
Geographical mobility - Moved within same county (%) - Other Race
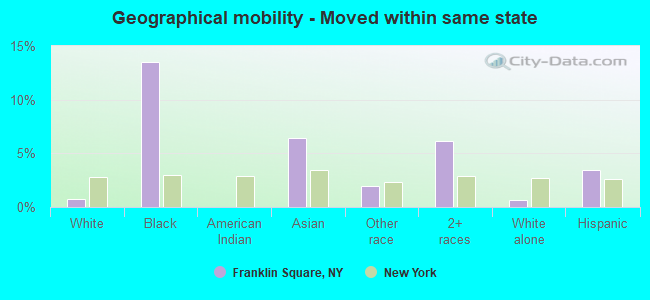
Geographical mobility - Moved from different county within same state (%)
Geographical mobility - Moved from different county within same state (%) - White
Geographical mobility - Moved from different county within same state (%) - Black or African American
Geographical mobility - Moved from different county within same state (%) - Asian
Geographical mobility - Moved from different county within same state (%) - Hispanic or Latino
Geographical mobility - Moved from different county within same state (%) - American Indian and Alaska Native
Geographical mobility - Moved from different county within same state (%) - Multirace
Geographical mobility - Moved from different county within same state (%) - Other Race
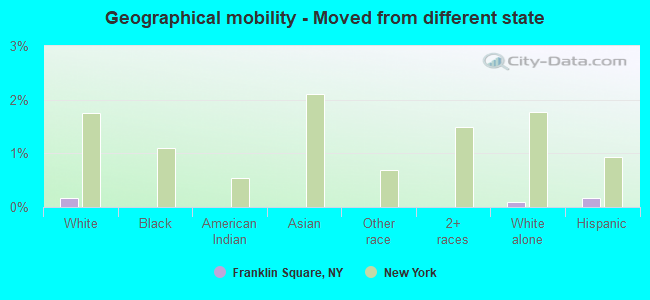
Geographical mobility - Moved from different state (%)
Geographical mobility - Moved from different state (%) - White
Geographical mobility - Moved from different state (%) - Black or African American
Geographical mobility - Moved from different state (%) - Asian
Geographical mobility - Moved from different state (%) - Hispanic or Latino
Geographical mobility - Moved from different state (%) - American Indian and Alaska Native
Geographical mobility - Moved from different state (%) - Multirace
Geographical mobility - Moved from different state (%) - Other Race
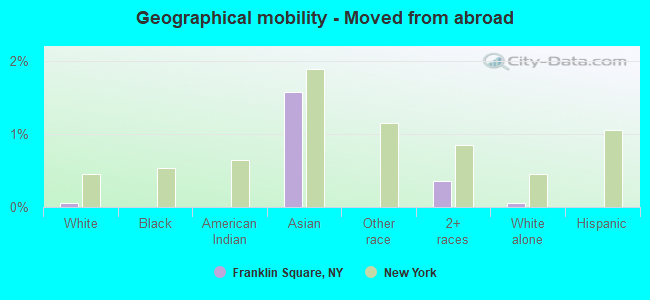
Geographical mobility - Moved from abroad (%)
Geographical mobility - Moved from abroad (%) - White
Geographical mobility - Moved from abroad (%) - Black or African American
Geographical mobility - Moved from abroad (%) - Asian
Geographical mobility - Moved from abroad (%) - Hispanic or Latino
Geographical mobility - Moved from abroad (%) - American Indian and Alaska Native
Geographical mobility - Moved from abroad (%) - Multirace
Geographical mobility - Moved from abroad (%) - Other Race
Place of birth for the foreign-born population - Ireland (%)
Place of birth for the foreign-born population - Denmark (%)
Place of birth for the foreign-born population - Norway (%)
Place of birth for the foreign-born population - Sweden (%)
Place of birth for the foreign-born population - United Kingdom (%)
Place of birth for the foreign-born population - England (%)
Place of birth for the foreign-born population - Scotland (%)
Place of birth for the foreign-born population - Other Northern Europe (%)
Place of birth for the foreign-born population - Austria (%)
Place of birth for the foreign-born population - Belgium (%)
Place of birth for the foreign-born population - France (%)
Place of birth for the foreign-born population - Germany (%)
Place of birth for the foreign-born population - Netherlands (%)
Place of birth for the foreign-born population - Switzerland (%)
Place of birth for the foreign-born population - Other Western Europe (%)
Place of birth for the foreign-born population - Greece (%)
Place of birth for the foreign-born population - Italy (%)
Place of birth for the foreign-born population - Portugal (%)
Place of birth for the foreign-born population - Spain (%)
Place of birth for the foreign-born population - Other Southern Europe (%)
Place of birth for the foreign-born population - Albania (%)
Place of birth for the foreign-born population - Belarus (%)
Place of birth for the foreign-born population - Bosnia and Herzegovina (%)
Place of birth for the foreign-born population - Bulgaria (%)
Place of birth for the foreign-born population - Croatia (%)
Place of birth for the foreign-born population - Czechoslovakia (%)
Place of birth for the foreign-born population - Hungary (%)
Place of birth for the foreign-born population - Latvia (%)
Place of birth for the foreign-born population - Lithuania (%)
Place of birth for the foreign-born population - North Macedonia (Macedonia) (%)
Place of birth for the foreign-born population - Moldova (%)
Place of birth for the foreign-born population - Poland (%)
Place of birth for the foreign-born population - Romania (%)
Place of birth for the foreign-born population - Russia (%)
Place of birth for the foreign-born population - Serbia (%)
Place of birth for the foreign-born population - Ukraine (%)
Place of birth for the foreign-born population - Other Eastern Europe (%)
Place of birth for the foreign-born population - China (%)
Place of birth for the foreign-born population - Hong Kong (%)
Place of birth for the foreign-born population - Taiwan (%)
Place of birth for the foreign-born population - Japan (%)
Place of birth for the foreign-born population - Korea (%)
Place of birth for the foreign-born population - Other Eastern Asia (%)
Place of birth for the foreign-born population - Afghanistan (%)
Place of birth for the foreign-born population - Bangladesh (%)
Place of birth for the foreign-born population - India (%)
Place of birth for the foreign-born population - Iran (%)
Place of birth for the foreign-born population - Kazakhstan (%)
Place of birth for the foreign-born population - Nepal (%)
Place of birth for the foreign-born population - Pakistan (%)
Place of birth for the foreign-born population - Sri Lanka (%)
Place of birth for the foreign-born population - Uzbekistan (%)
Place of birth for the foreign-born population - Other South Central Asia (%)
Place of birth for the foreign-born population - Burma (%)
Place of birth for the foreign-born population - Cambodia (%)
Place of birth for the foreign-born population - Indonesia (%)
Place of birth for the foreign-born population - Laos (%)
Place of birth for the foreign-born population - Malaysia (%)
Place of birth for the foreign-born population - Philippines (%)
Place of birth for the foreign-born population - Singapore (%)
Place of birth for the foreign-born population - Thailand (%)
Place of birth for the foreign-born population - Vietnam (%)
Place of birth for the foreign-born population - Other South Eastern Asia (%)
Place of birth for the foreign-born population - Armenia (%)
Place of birth for the foreign-born population - Iraq (%)
Place of birth for the foreign-born population - Israel (%)
Place of birth for the foreign-born population - Jordan (%)
Place of birth for the foreign-born population - Kuwait (%)
Place of birth for the foreign-born population - Lebanon (%)
Place of birth for the foreign-born population - Saudi Arabia (%)
Place of birth for the foreign-born population - Syria (%)
Place of birth for the foreign-born population - Turkey (%)
Place of birth for the foreign-born population - Yemen (%)
Place of birth for the foreign-born population - Other Western Asia (%)
Place of birth for the foreign-born population - Eritrea (%)
Place of birth for the foreign-born population - Ethiopia (%)
Place of birth for the foreign-born population - Kenya (%)
Place of birth for the foreign-born population - Somalia (%)
Place of birth for the foreign-born population - Uganda (%)
Place of birth for the foreign-born population - Zimbabwe (%)
Place of birth for the foreign-born population - Other Eastern Africa (%)
Place of birth for the foreign-born population - Cameroon (%)
Place of birth for the foreign-born population - Congo (%)
Place of birth for the foreign-born population - Democratic Republic of Congo (Zaire) (%)
Place of birth for the foreign-born population - Other Middle Africa (%)
Place of birth for the foreign-born population - Egypt (%)
Place of birth for the foreign-born population - Morocco (%)
Place of birth for the foreign-born population - Sudan (%)
Place of birth for the foreign-born population - Other Northern Africa (%)
Place of birth for the foreign-born population - South Africa (%)
Place of birth for the foreign-born population - Other Southern Africa (%)
Place of birth for the foreign-born population - Cabo Verde (%)
Place of birth for the foreign-born population - Ghana (%)
Place of birth for the foreign-born population - Liberia (%)
Place of birth for the foreign-born population - Nigeria (%)
Place of birth for the foreign-born population - Senegal (%)
Place of birth for the foreign-born population - Sierra Leone (%)
Place of birth for the foreign-born population - Other Western Africa (%)
Place of birth for the foreign-born population - Australia (%)
Place of birth for the foreign-born population - New Zealand (%)
Place of birth for the foreign-born population - Fiji (%)
Place of birth for the foreign-born population - Micronesia (%)
Place of birth for the foreign-born population - Bahamas (%)
Place of birth for the foreign-born population - Barbados (%)
Place of birth for the foreign-born population - Cuba (%)
Place of birth for the foreign-born population - Dominica (%)
Place of birth for the foreign-born population - Dominican Republic (%)
Place of birth for the foreign-born population - Grenada (%)
Place of birth for the foreign-born population - Haiti (%)
Place of birth for the foreign-born population - Jamaica (%)
Place of birth for the foreign-born population - St. Vincent and the Grenadines (%)
Place of birth for the foreign-born population - Trinidad and Tobago (%)
Place of birth for the foreign-born population - West Indies (%)
Place of birth for the foreign-born population - Other Caribbean (%)
Place of birth for the foreign-born population - Belize (%)
Place of birth for the foreign-born population - Costa Rica (%)
Place of birth for the foreign-born population - El Salvador (%)
Place of birth for the foreign-born population - Guatemala (%)
Place of birth for the foreign-born population - Honduras (%)
Place of birth for the foreign-born population - Mexico (%)
Place of birth for the foreign-born population - Nicaragua (%)
Place of birth for the foreign-born population - Panama (%)
Place of birth for the foreign-born population - Other Central America (%)
Place of birth for the foreign-born population - Argentina (%)
Place of birth for the foreign-born population - Bolivia (%)
Place of birth for the foreign-born population - Brazil (%)
Place of birth for the foreign-born population - Chile (%)
Place of birth for the foreign-born population - Colombia (%)
Place of birth for the foreign-born population - Ecuador (%)
Place of birth for the foreign-born population - Guyana (%)
Place of birth for the foreign-born population - Peru (%)
Place of birth for the foreign-born population - Uruguay (%)
Place of birth for the foreign-born population - Venezuela (%)
Place of birth for the foreign-born population - Other South America (%)
Place of birth for the foreign-born population - Canada (%)
Place of birth for the foreign-born population - Other Northern America (%)
Place of birth for the foreign-born population - Other (%)
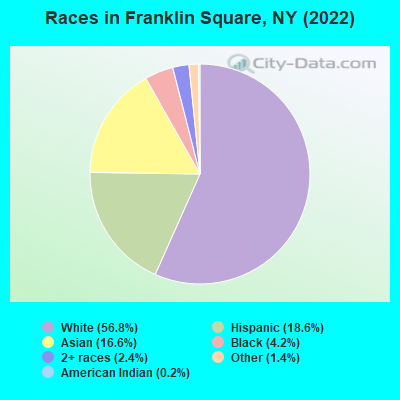
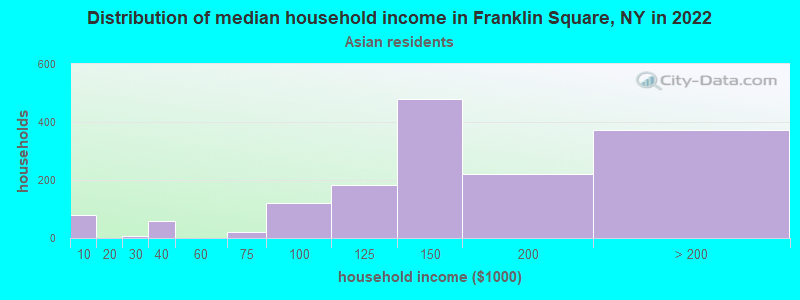
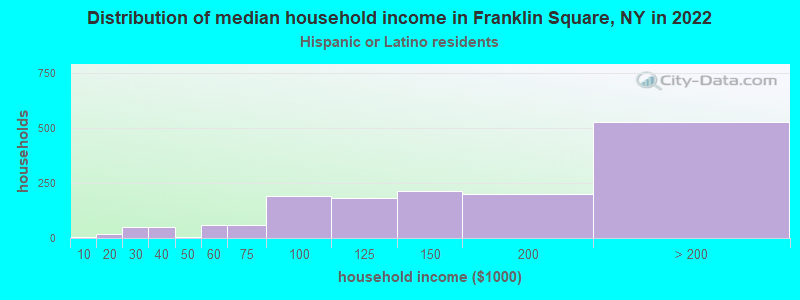
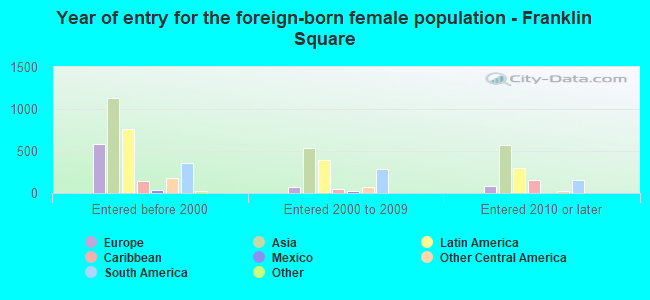
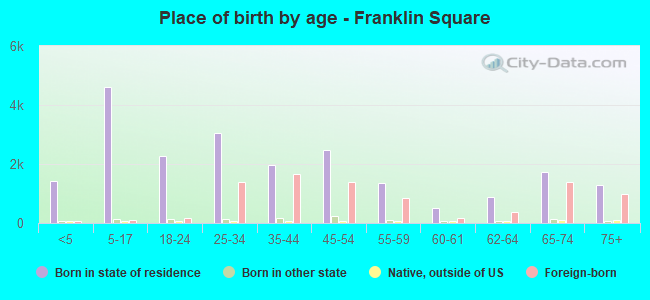
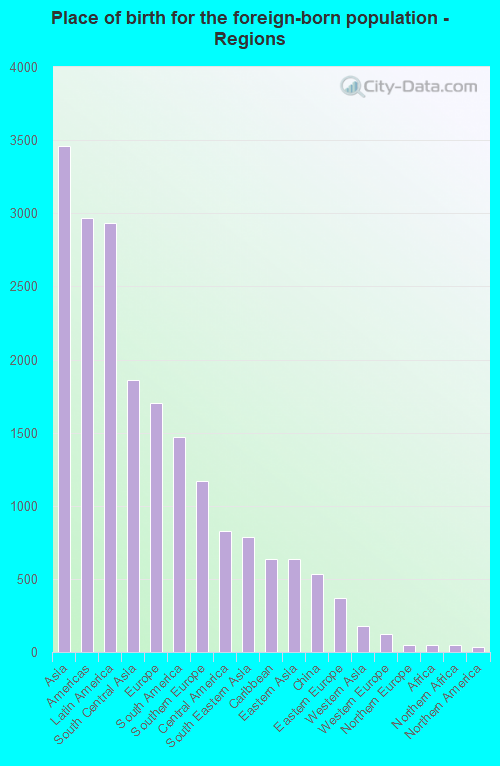
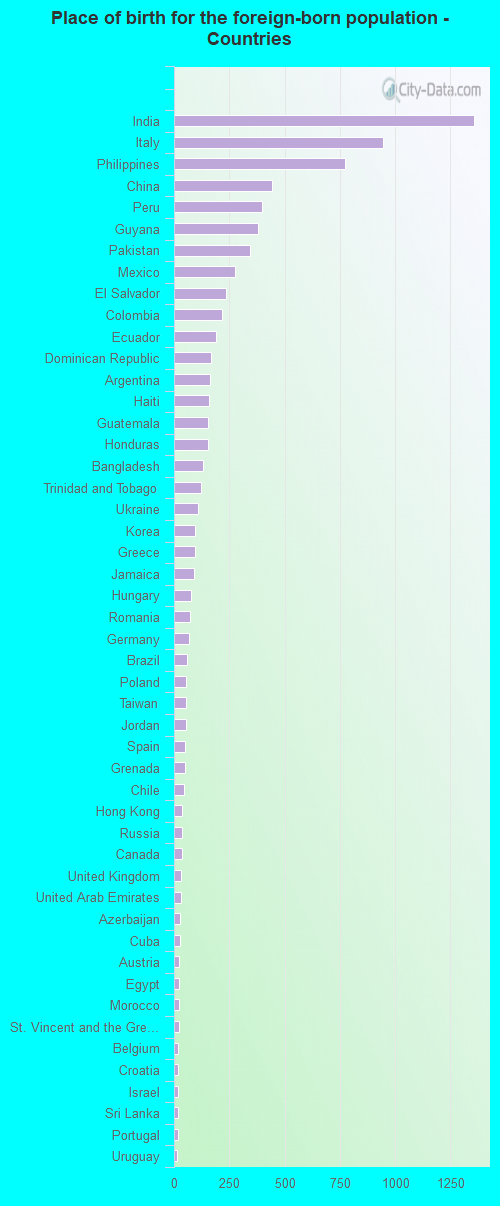
According to 2022 data, the most numerous races in Franklin Square, NY are White alone (18,094 residents), Hispanic (5,924 residents), and Black alone (1,344 residents). 65.2% of Franklin Square residents speak English at home. 25.7% of Franklin Square, NY residents are foreign-born (10.9% born in Asia, 9.3% born in Latin America, 5.4% born in Europe), which is 14.3% greater than the foreign-born rate of 22.0% across the entire state of New York.
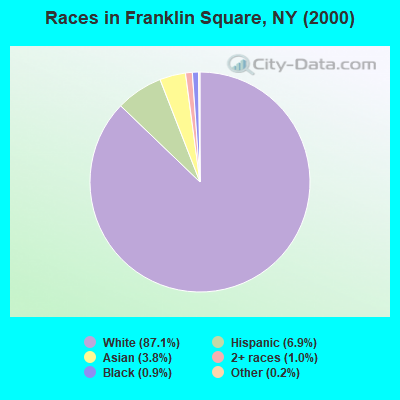
Race distribution in Franklin Square
2000 2022
11,760,981 62.0% White alone 2,867,583 15.1% Hispanic 2,812,623 14.8% Black alone 1,035,926 5.5% Asian alone 366,116 1.9% Two or more races 75,499 0.4% Other race alone 52,499 0.3% American Indian alone 5,230 0.03% Native Hawaiian and Other
10,408,933 52.9% White alone 3,867,299 19.7% Hispanic 2,633,840 13.4% Black alone 1,776,286 9.0% Asian alone 732,670 3.7% Two or more races 216,110 1.1% Other race alone 35,082 0.2% American Indian alone 6,931 0.04% Native Hawaiian and Other
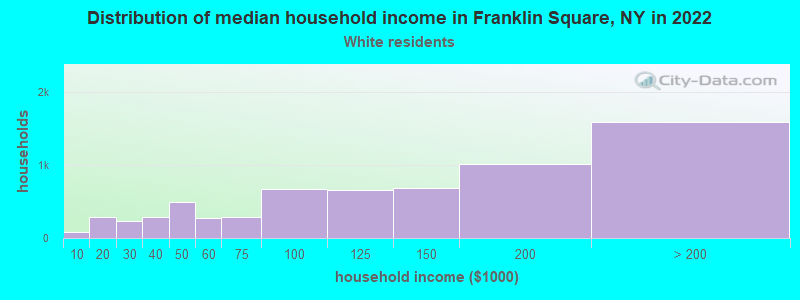
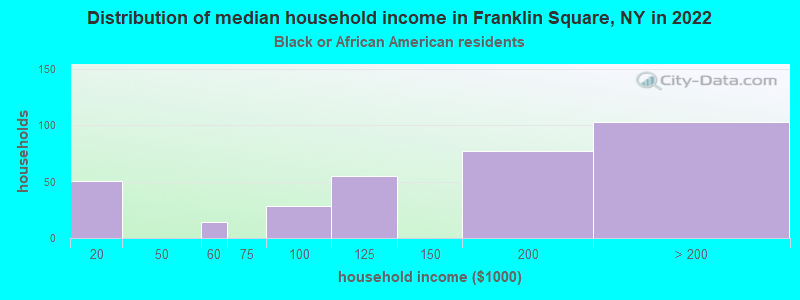
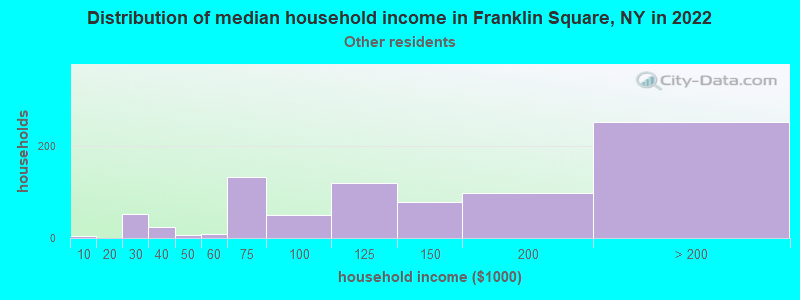
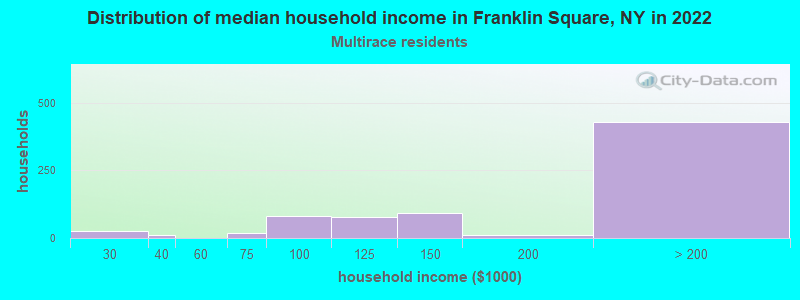
Income and house value in Franklin Square Median household income in 2022 $125,746 White non-Hispanic householders$173,160 Black householders$134,519 Asian householders$128,551 Some other race householdersover $200,000 Two or more races householders$155,547 Hispanic or Latino race householdersMedian 2022 house value $634,805 White Non-Hispanic householders$490,995 Black or African American householders $672,246 Asian householders$686,712 Some other race householders$686,429 Two or more races householders$657,780 Hispanic or Latino householders
Median age by race in Franklin Square
47.3 Median age for White residents49.1 46.3 38.5 Median age for Black or African American residents39.2 38.0 80.9 Median age for American Indian / Alaska Native residents41.4 -837,121,211.3 36.4 Median age for Asian residents35.9 39.2 -487,992,314.6 Median age for Native Hawaiian / Pacific Islander residents-477,502,295.2 -497,387,669.3 37.5 Median age for Other race residents39.2 34.1 29.2 Median age for Two or more races residents29.0 28.6 47.3 Median age for White alone residents48.7 46.2 34.4 Median age for Hispanic or Latino residents34.2 35.1
Owner/renter occupied households by race in Franklin Square
House owners and renters - White residents 5,439 83.4% Owner occupied1,082 16.6% Renter occupiedHouse owners and renters - Black or African American residents 274 85.1% Owner occupied48 14.9% Renter occupiedHouse owners and renters - American Indian / Alaska Native residents 40 100.0% Owner occupiedHouse owners and renters - Asian residents 1,386 90.7% Owner occupied142 9.3% Renter occupiedHouse owners and renters - Other race residents 491 62.9% Owner occupied290 37.1% Renter occupiedHouse owners and renters - Two or more races residents 672 85.4% Owner occupied115 14.6% Renter occupiedHouse owners and renters - White alone residents 5,193 82.8% Owner occupied1,082 17.2% Renter occupiedHouse owners and renters - Hispanic or Latino residents 1,195 75.0% Owner occupied397 25.0% Renter occupied
Language usage in Franklin Square
English speakers - Total 65.2% of residents of Franklin Square speak English at home.
11.4% of residents speak Spanish at home 2,222 64.5% Speak English very well1,225 35.5% Speak English less than very well23.9% of residents speak other language at home 4,498 62.1% Speak English very well2,749 37.9% Speak English less than very well
English speakers - Born in the United States 84.9% of residents of Franklin Square speak English at home.
4.7% of residents speak Spanish at home 55 100.0% Speak English very well9.9% of residents speak other language at home 98 85.2% Speak English very well17 14.8% Speak English less than very well
English speakers - Native, born elsewhere 57.8% of residents of Franklin Square speak English at home.
27.4% of residents speak Spanish at home 116 76.3% Speak English very well36 23.7% Speak English less than very well13.4% of residents speak other language at home 53 71.6% Speak English very well21 28.4% Speak English less than very well
English speakers - Foreign-born 14.4% of residents of Franklin Square speak English at home.
21.2% of residents speak Spanish at home 809 45.1% Speak English very well983 54.9% Speak English less than very well65.8% of residents speak other language at home 3,030 54.5% Speak English very well2,531 45.5% Speak English less than very well
White (Caucasian) - Speak only English Native:
92.8% (15,007)Foreign-born:
17.3% (325)
White (Caucasian) - Speak another language Native:
7.0% (1,130)Foreign-born:
80.0% (1,501)
Black or African American - Speak only English Native:
97.1% (768)Foreign-born:
70.4% (318)
Black or African American - Speak another language Native:
2.2% (17)Foreign-born:
29.3% (133)
American Indian / Alaska Native - Speak only English Native:
75.4% (88)Foreign-born:
65.9% (2)
Asian - Speak only English Native:
39.5% (413)Foreign-born:
5.9% (234)
Asian - Speak another language Native:
59.8% (624)Foreign-born:
95.6% (3,753)
Other race - Speak only English Native:
32.3% (444)Foreign-born:
5.5% (77)
Other race - Speak another language Native:
66.5% (914)Foreign-born:
95.1% (1,345)
Two or more races - Speak only English Native:
75.3% (1,989)Foreign-born:
33.8% (293)
Two or more races - Speak another language Native:
22.4% (593)Foreign-born:
63.7% (553)
White alone - Speak only English Native:
92.9% (14,477)Foreign-born:
16.7% (323)
White alone - Speak another language Native:
6.9% (1,079)Foreign-born:
83.7% (1,624)
Hispanic or Latino - Speak only English Native:
57.4% (2,061)Foreign-born:
11.9% (257)
Hispanic or Latino - Speak another language Native:
42.3% (1,517)Foreign-born:
88.1% (1,896)
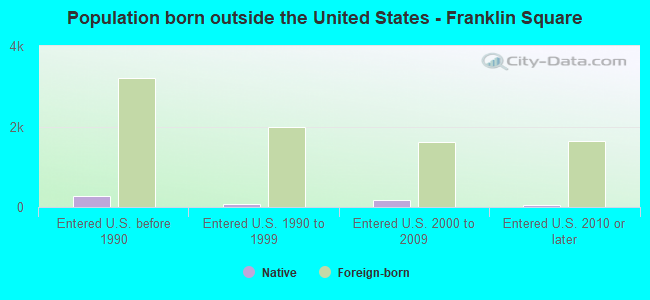
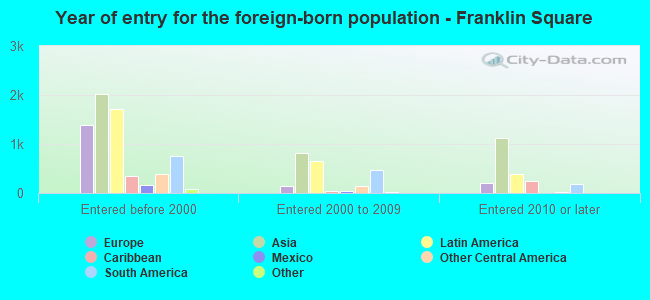
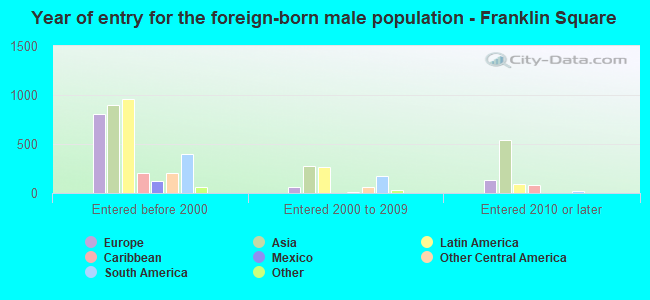
Foreign-born residents in Franklin Square 8,178 residents are foreign born (10.9% Asia , 9.3% Latin America , 5.4% Europe ).
This city:
25.7%New York:
22.6%
Marital status for residents in Franklin Square Marital status - White (Caucasian) population 15 years and over
Males 29.5% Never married57.3% Now married1.7% Separated5.1% Widowed6.4% DivorcedFemales 30.8% Never married51.2% Now married1.5% Separated9.4% Widowed7.1% DivorcedWomen who gave birth in the past 12 months Now married:
96.6% (126)Unmarried:
3.4% (4)
Women who did not give birth in the past 12 months Now married:
41.9% (1,716)Unmarried:
58.1% (2,381)
Marital status - Black or African American population 15 years and over
Males 43.4% Never married47.7% Now married6.8% Separated2.1% Widowed0.0% DivorcedFemales 51.7% Never married33.3% Now married3.1% Separated3.0% Widowed8.9% DivorcedWomen who gave birth in the past 12 months Now married:
100.0% (9)Unmarried:
0.0% (0)
Women who did not give birth in the past 12 months Now married:
35.4% (139)Unmarried:
64.6% (253)
Marital status - American Indian / Alaska Native population 15 years and over
Males 37.0% Never married63.0% Now married0.0% Separated0.0% Widowed0.0% DivorcedFemales 0.0% Never married90.3% Now married0.0% Separated9.7% Widowed0.0% DivorcedMarital status - Asian population 15 years and over
Males 30.7% Never married63.1% Now married2.5% Separated1.7% Widowed2.0% DivorcedFemales 13.6% Never married72.9% Now married1.1% Separated10.0% Widowed2.5% DivorcedWomen who gave birth in the past 12 months Now married:
100.0% (57)Unmarried:
0.0% (0)
Women who did not give birth in the past 12 months Now married:
78.2% (977)Unmarried:
21.8% (273)
Marital status - Other race population 15 years and over
Males 25.3% Never married65.3% Now married1.9% Separated0.0% Widowed7.5% DivorcedFemales 40.7% Never married46.0% Now married3.5% Separated2.9% Widowed6.8% DivorcedWomen who gave birth in the past 12 months Now married:
0.0% (0)Unmarried:
100.0% (34)
Women who did not give birth in the past 12 months Now married:
44.7% (399)Unmarried:
55.3% (494)
Marital status - Two or more races population 15 years and over
Males 61.7% Never married32.6% Now married0.0% Separated0.2% Widowed5.5% DivorcedFemales 33.4% Never married48.3% Now married5.9% Separated5.3% Widowed7.1% DivorcedWomen who did not give birth in the past 12 months Now married:
37.3% (357)Unmarried:
62.7% (600)
Marital status - White alone, not Hispanic / Latino population 15 years and over
Males 29.8% Never married56.8% Now married1.8% Separated5.2% Widowed6.4% DivorcedFemales 31.2% Never married50.5% Now married1.5% Separated10.1% Widowed6.7% DivorcedWomen who gave birth in the past 12 months Now married:
95.6% (104)Unmarried:
4.4% (5)
Women who did not give birth in the past 12 months Now married:
40.9% (1,626)Unmarried:
59.1% (2,354)
Marital status - Hispanic or Latino population 15 years and over
Males 42.6% Never married49.8% Now married0.7% Separated0.8% Widowed6.0% DivorcedFemales 35.3% Never married51.6% Now married3.1% Separated2.7% Widowed7.3% DivorcedWomen who gave birth in the past 12 months Now married:
51.6% (32)Unmarried:
48.4% (30)
Women who did not give birth in the past 12 months Now married:
43.7% (676)Unmarried:
56.3% (871)
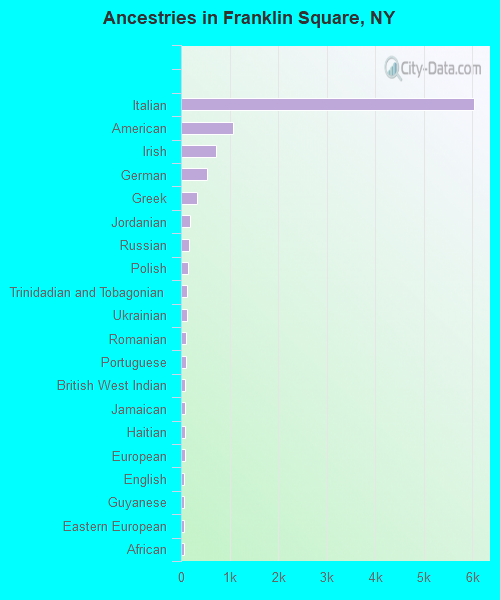
Ancestries in Franklin Square
6,044 34.3% Italian1,063 6.0% American716 4.1% Irish526 3.0% German323 1.8% Greek194 1.1% Jordanian166 0.9% Russian145 0.8% Polish127 0.7% Trinidadian and Tobagonian115 0.7% Ukrainian106 0.6% Romanian104 0.6% Portuguese88 0.5% British West Indian85 0.5% Jamaican80 0.5% Haitian78 0.4% European72 0.4% English72 0.4% Guyanese64 0.4% Eastern European59 0.3% African43 0.2% Hungarian41 0.2% Austrian39 0.2% Northern European37 0.2% Czechoslovakian35 0.2% Maltese32 0.2% Israeli32 0.2% Lithuanian30 0.2% Scotch-Irish27 0.2% Scottish26 0.1% Egyptian22 0.1% Croatian18 0.1% Cypriot18 0.1% Turkish16 0.09% Slovene15 0.09% Armenian13 0.07% Belgian12 0.07% Dutch8 0.05% Macedonian7 0.04% Arab7 0.04% Syrian6 0.03% Swiss4 0.02% Yugoslavian3 0.02% Slovak
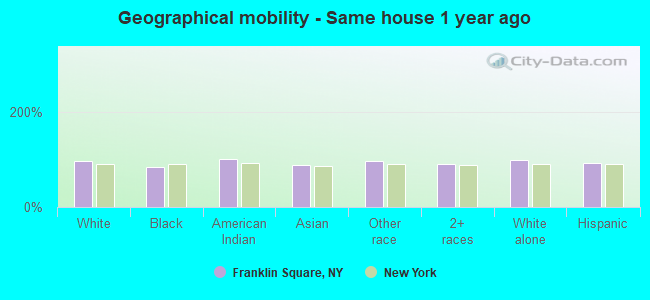
Geographical mobility in Franklin Square Same house 1 year ago 18,088 97.1% White (Caucasian)1,101 82.6% Black or African American142 100.0% American Indian / Alaska Native4,650 88.1% Asian2,821 96.1% Other race3,300 90.6% Two or more races17,626 97.8% White alone, not Hispanic / Latino5,417 92.7% Hispanic or LatinoMoved within same county 242 1.3% White / Caucasian81 6.1% Black or African American214 4.0% Asian13 0.5% Other race104 2.8% Two or more races143 0.8% White alone, not Hispanic / Latino167 2.9% Hispanic or LatinoMoved within same state 141 0.8% White / Caucasian180 13.5% Black or African American337 6.4% Asian59 2.0% Other race224 6.1% Two or more races113 0.6% White alone, not Hispanic / Latino202 3.5% Hispanic or LatinoMoved from different state 32 0.2% White / Caucasian17 0.1% White alone, not Hispanic / Latino10 0.2% Hispanic or LatinoMoved from abroad 9 0.1% White83 1.6% Asian13 0.4% Two or more races10 0.1% White alone, not Hispanic / Latino
Children Nativity (place of birth) in Franklin Square
Children under 6 years - Living with two parents Both parents native 719 100.0% NativeBoth parents foreign-born 465 100.0% NativeOne native, one foreign-born parent 197 100.0% NativeChildren under 6 years - Living with one parent Native parent 243 100.0% NativeForeign-born parent 144 100.0% NativeChildren 6 to 17 years - Living with two parents Both parents native 2,050 100.0% NativeBoth parents foreign-born 872 91.4% Native82 8.6% Foreign-bornOne native, one foreign-born parent 391 100.0% NativeChildren 6 to 17 years - Living with one parent Native parent 952 100.0% NativeForeign-born parent 225 47.2% Native252 52.8% Foreign-born
Grandparents responsible for own grandchildren in Franklin Square
Grandparents (30 to 59 years) White / Caucasian 27 100.0% Not responsible for grandchildrenBlack or African American 42 100.0% Not responsible for grandchildrenAsian 153 100.0% Not responsible for grandchildrenOther race 37 100.0% Not responsible for grandchildrenWhite alone, not Hispanic / Latino 17 100.0% Not responsible for grandchildrenHispanic or Latino 26 100.0% Not responsible for grandchildrenGrandparents (60 years and over) White / Caucasian 40 9.9% Responsible for grandchildren361 90.1% Not responsible for grandchildrenAsian 178 100.0% Not responsible for grandchildrenOther race 25 56.4% Responsible for grandchildren19 43.6% Not responsible for grandchildrenWhite alone, not Hispanic / Latino 37 12.1% Responsible for grandchildren271 87.9% Not responsible for grandchildrenHispanic or Latino 41 19.9% Responsible for grandchildren164 80.1% Not responsible for grandchildren