Races in Fraser, Michigan (MI) Detailed Stats
Ancestries, Foreign-born residents, place of birth
Settings
X


Recent posts about races in Fraser, Michigan on our local forum with over 2,400,000 registered users:
 | Apt rentals: Novi vs West Bloomfield? (24 replies) |
| I found my old house in Detroit today... (193 replies) |
| Eastpointe to change how it elects its city council (33 replies) |
| Wayne State School of Medicine and Family safe Area on a student budget (9 replies) |
| Giving Up With the Move (43 replies) |
| Neighbourhood dynamics in Detroit (35 replies) |
Latest news about races in Fraser, MI collected exclusively by city-data.com from local newspapers, TV, and radio stations
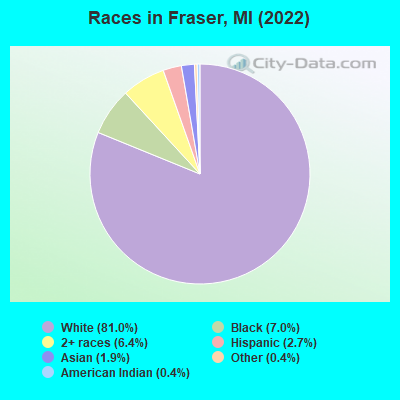
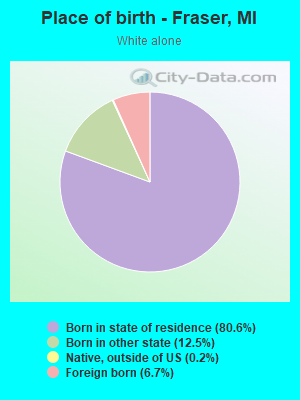
According to 2022 data, the most numerous races in Fraser, MI are White alone (11,828 residents), Black alone (1,022 residents), and Hispanic (396 residents). 89.0% of Fraser residents speak English at home. 7.5% of Fraser, MI residents are foreign-born (3.1% born in Europe, 2.4% born in Asia, 1.1% born in Africa), which is 19.6% greater than the foreign-born rate of 6.0% across the entire state of Michigan.
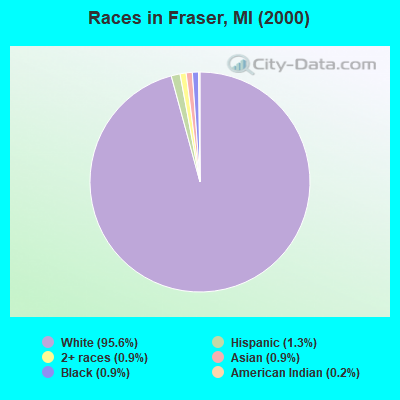
Race distribution in Fraser
2000
2022

- 14,62895.6%White alone
- 2031.3%Hispanic
- 1360.9%Black alone
- 1430.9%Two or more races
- 1420.9%Asian alone
- 370.2%American Indian alone
- 60.04%Other race alone
- 20.01%Native Hawaiian and Other
Pacific Islander alone
-
- 11,82881.0%White alone
- 1,0227.0%Black alone
- 9396.4%Two or more races
- 3962.7%Hispanic
- 2801.9%Asian alone
- 550.4%Other race alone
- 520.4%American Indian alone
- 60.04%Native Hawaiian and Other
Pacific Islander alone
2000
2022
-
- 7,806,69178.6%White alone
- 1,402,04714.1%Black alone
- 323,8773.3%Hispanic
- 175,3111.8%Asian alone
- 163,4871.6%Two or more races
- 53,4210.5%American Indian alone
- 11,4650.1%Other race alone
- 2,1450.02%Native Hawaiian and Other
Pacific Islander alone

-
- 7,289,05172.6%White alone
- 1,310,46413.1%Black alone
- 572,4055.7%Hispanic
- 450,0314.5%Two or more races
- 335,7323.3%Asian alone
- 45,2170.5%Other race alone
- 29,0110.3%American Indian alone
- 2,2070.02%Native Hawaiian and Other
Pacific Islander alone

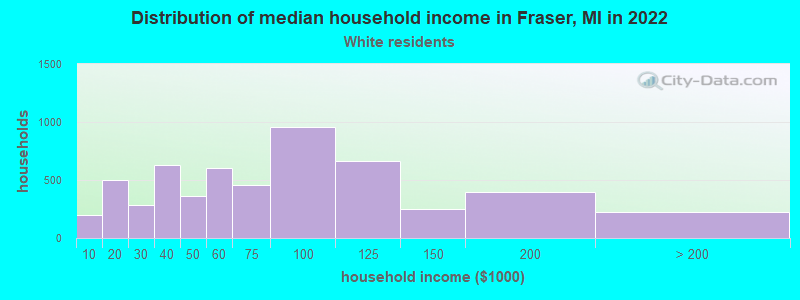
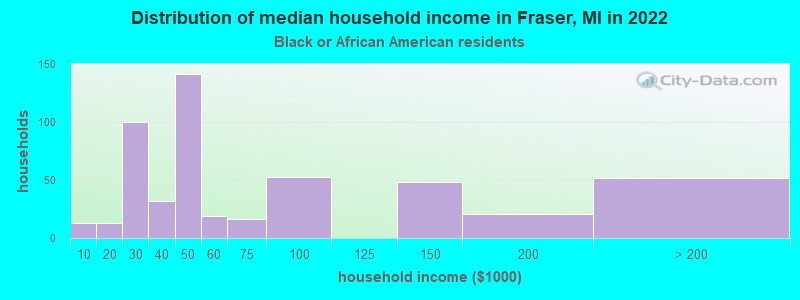
Income and house value in Fraser
- Median household income in 2022
- $63,907White non-Hispanic householders
- $43,508Black householders
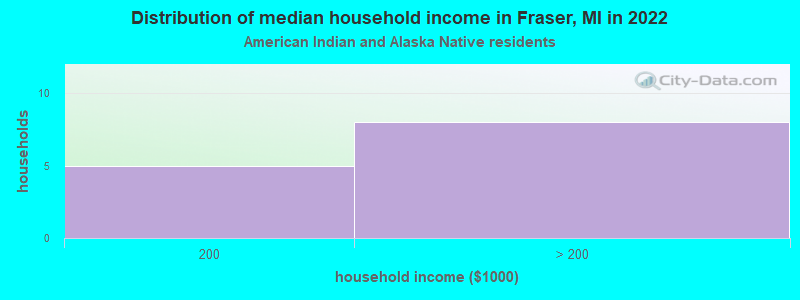
- over $200,000American Indian and Alaska Native householders
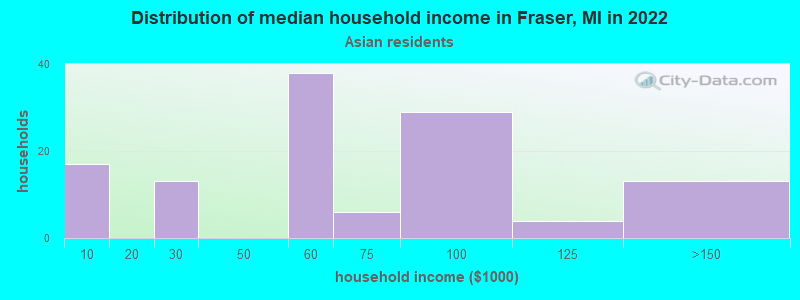
- $48,926Asian householders
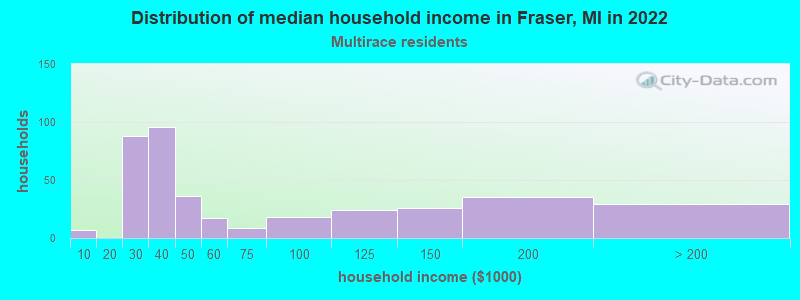
- $44,944Two or more races householders
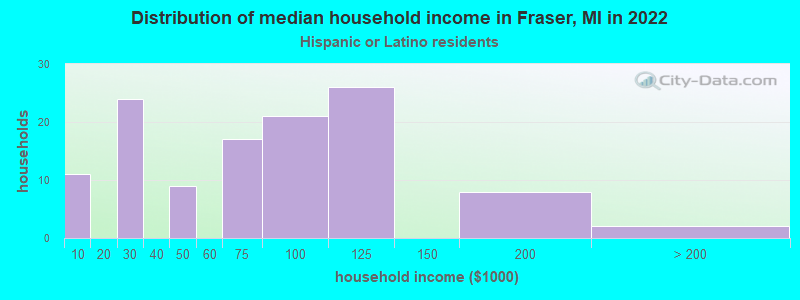
- $67,854Hispanic or Latino race householders
- Median 2022 house value
- $202,708White Non-Hispanic householders
- $202,708American Indian or Alaska Native householders
- $236,468Asian householders
- $163,709Native Hawaiian and other Pacific Islander householders
- $220,898Some other race householders
- $142,463Two or more races householders
- $183,208Hispanic or Latino householders
Household income for White non-Hispanic householders
Household income for Black householders
Household income for American Indian and Alaska Native householders
Household income for Asian householders
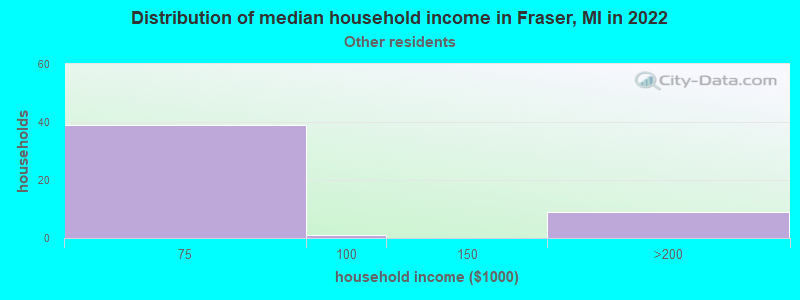
Household income for Some other race householders
Household income for Two or more races householders
Household income for Hispanic or Latino race householders
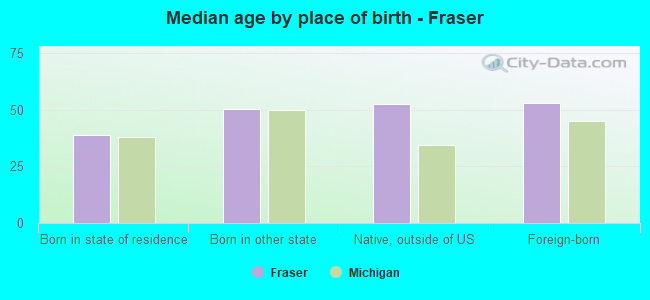
Median age by race in Fraser
- 45.0Median age for White residents
- 40.7Males
- 47.5Females
- 40.1Median age for Black or African American residents
- 38.7Males
- 45.5Females
- 73.0Median age for American Indian / Alaska Native residents
- -553,963,705.3Males
- 88.8Females
- 34.7Median age for Asian residents
- 31.0Males
- 47.0Females
- -670,531,400.3Median age for Native Hawaiian / Pacific Islander residents
- -674,772,035.8Males
- -699,588,476.7Females
- 17.7Median age for Other race residents
- 49.7Males
- 15.9Females
- 27.0Median age for Two or more races residents
- 24.7Males
- 29.2Females
- 45.2Median age for White alone residents
- 40.5Males
- 47.9Females
- 22.7Median age for Hispanic or Latino residents
- 22.9Males
- 24.6Females
Owner/renter occupied households by race in Fraser
- House owners and renters - White residents
- 4,27577.1%Owner occupied
- 1,27222.9%Renter occupied
- House owners and renters - Black or African American residents
- 20242.1%Owner occupied
- 27957.9%Renter occupied
- House owners and renters - American Indian / Alaska Native residents
- 11100.0%Owner occupied
- House owners and renters - Asian residents
- 11180.0%Owner occupied
- 2820.0%Renter occupied
- House owners and renters - Other race residents
- 2968.6%Owner occupied
- 1331.4%Renter occupied
- House owners and renters - Two or more races residents
- 33185.3%Owner occupied
- 5714.7%Renter occupied
- House owners and renters - White alone residents
- 4,24877.0%Owner occupied
- 1,27023.0%Renter occupied
- House owners and renters - Hispanic or Latino residents
- 8377.5%Owner occupied
- 2422.5%Renter occupied
Language usage in Fraser
- English speakers - Total
- 89.0% of residents of Fraser speak English at home.
- 0.8% of residents speak Spanish at home
- 103100.0%Speak English very well
- 10.1% of residents speak other language at home
- 87562.9%Speak English very well
- 51637.1%Speak English less than very well
- English speakers - Born in the United States
- 92.1% of residents of Fraser speak English at home.
- 1.3% of residents speak Spanish at home
- 25100.0%Speak English very well
- 6.7% of residents speak other language at home
- 11792.9%Speak English very well
- 97.1%Speak English less than very well
All residents speak only English at home
- English speakers - Foreign-born
- 20.6% of residents of Fraser speak English at home.
- 0.7% of residents speak Spanish at home
- 7100.0%Speak English very well
- 79.1% of residents speak other language at home
- 36643.2%Speak English very well
- 48156.8%Speak English less than very well
White (Caucasian) - Speak only English
| Native: | 94.7% (9,877) |
| Foreign-born: | 15.2% (118) |
White (Caucasian) - Speak another language
| Native: | 5.3% (557) |
| Foreign-born: | 84.8% (657) |
Black or African American - Speak only English
| Native: | 100.0% (899) |
| Foreign-born: | 40.9% (31) |
Asian - Speak only English
| Native: | 53.9% (24) |
| Foreign-born: | 40.7% (85) |
Asian - Speak another language
| Native: | 42.4% (19) |
| Foreign-born: | 58.5% (123) |
White alone - Speak only English
| Native: | 94.6% (9,810) |
| Foreign-born: | 15.1% (120) |
White alone - Speak another language
| Native: | 5.4% (564) |
| Foreign-born: | 84.9% (672) |
Hispanic or Latino - Speak another language
| Native: | 17.8% (66) |
| Foreign-born: | 100.0% (7) |
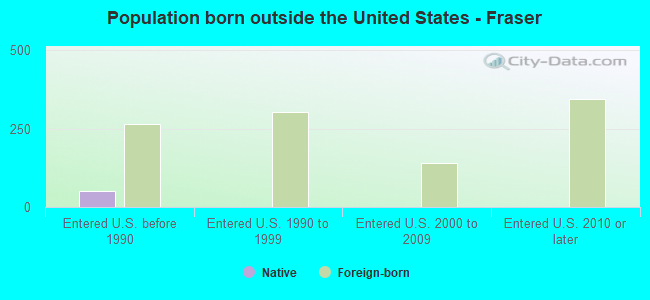
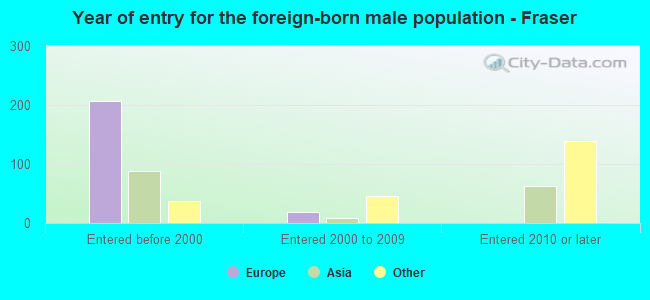
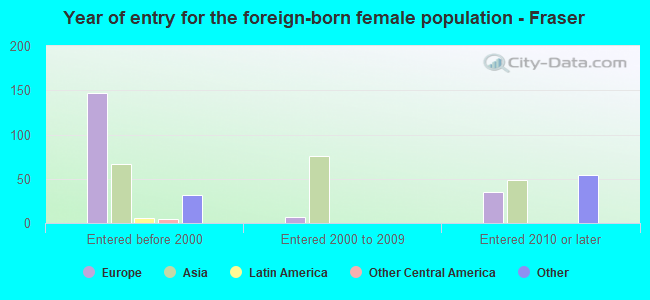
Foreign-born residents in Fraser
1,090 residents are foreign born (3.1% Europe, 2.4% Asia, 1.1% Africa).
| This city: | 7.5% |
| Michigan: | 6.9% |
Marital status for residents in Fraser
Marital status - White (Caucasian) population 15 years and over
- Males
- 38.0%Never married
- 45.6%Now married
- 0.4%Separated
- 5.5%Widowed
- 10.6%Divorced
- Females
- 30.9%Never married
- 39.6%Now married
- 2.7%Separated
- 9.5%Widowed
- 17.3%Divorced
Women who gave birth in the past 12 months
| Now married: | 82.6% (90) |
| Unmarried: | 17.4% (19) |
Women who did not give birth in the past 12 months
| Now married: | 34.2% (850) |
| Unmarried: | 65.8% (1,633) |
Marital status - Black or African American population 15 years and over
- Males
- 49.5%Never married
- 44.0%Now married
- 0.0%Separated
- 0.0%Widowed
- 6.5%Divorced
- Females
- 50.2%Never married
- 33.1%Now married
- 3.7%Separated
- 7.2%Widowed
- 5.7%Divorced
Women who gave birth in the past 12 months
| Now married: | 0.0% (0) |
| Unmarried: | 100.0% (19) |
Women who did not give birth in the past 12 months
| Now married: | 35.0% (98) |
| Unmarried: | 65.0% (182) |
Marital status - American Indian / Alaska Native population 15 years and over
- Males
- 37.5%Never married
- 62.5%Now married
- 0.0%Separated
- 0.0%Widowed
- 0.0%Divorced
- Females
- 7.0%Never married
- 68.4%Now married
- 0.0%Separated
- 5.3%Widowed
- 19.3%Divorced
Women who did not give birth in the past 12 months
| Now married: | 0.0% (0) |
| Unmarried: | 100.0% (15) |
Marital status - Asian population 15 years and over
- Males
- 25.0%Never married
- 61.6%Now married
- 3.6%Separated
- 0.0%Widowed
- 9.8%Divorced
- Females
- 23.9%Never married
- 63.3%Now married
- 0.0%Separated
- 0.0%Widowed
- 12.8%Divorced
Women who gave birth in the past 12 months
| Now married: | 100.0% (9) |
| Unmarried: | 0.0% (0) |
Women who did not give birth in the past 12 months
| Now married: | 72.5% (43) |
| Unmarried: | 27.5% (16) |
Marital status - Other race population 15 years and over
- Males
- 0.0%Never married
- 100.0%Now married
- 0.0%Separated
- 0.0%Widowed
- 0.0%Divorced
- Females
- 69.2%Never married
- 15.4%Now married
- 15.4%Separated
- 0.0%Widowed
- 0.0%Divorced
Women who did not give birth in the past 12 months
| Now married: | 30.8% (19) |
| Unmarried: | 69.2% (43) |
Marital status - Two or more races population 15 years and over
- Males
- 59.0%Never married
- 32.7%Now married
- 0.0%Separated
- 3.0%Widowed
- 5.3%Divorced
- Females
- 41.5%Never married
- 31.0%Now married
- 0.0%Separated
- 2.8%Widowed
- 24.7%Divorced
Women who gave birth in the past 12 months
| Now married: | 100.0% (5) |
| Unmarried: | 0.0% (0) |
Women who did not give birth in the past 12 months
| Now married: | 23.5% (76) |
| Unmarried: | 76.5% (248) |
Marital status - White alone, not Hispanic / Latino population 15 years and over
- Males
- 38.1%Never married
- 45.4%Now married
- 0.4%Separated
- 5.5%Widowed
- 10.6%Divorced
- Females
- 30.9%Never married
- 39.4%Now married
- 2.8%Separated
- 9.6%Widowed
- 17.3%Divorced
Women who gave birth in the past 12 months
| Now married: | 81.0% (81) |
| Unmarried: | 19.0% (19) |
Women who did not give birth in the past 12 months
| Now married: | 33.9% (830) |
| Unmarried: | 66.1% (1,617) |
Marital status - Hispanic or Latino population 15 years and over
- Males
- 70.7%Never married
- 29.3%Now married
- 0.0%Separated
- 0.0%Widowed
- 0.0%Divorced
- Females
- 46.7%Never married
- 34.5%Now married
- 4.8%Separated
- 7.3%Widowed
- 6.7%Divorced
Women who gave birth in the past 12 months
| Now married: | 100.0% (11) |
| Unmarried: | 0.0% (0) |
Women who did not give birth in the past 12 months
| Now married: | 35.8% (46) |
| Unmarried: | 64.2% (83) |
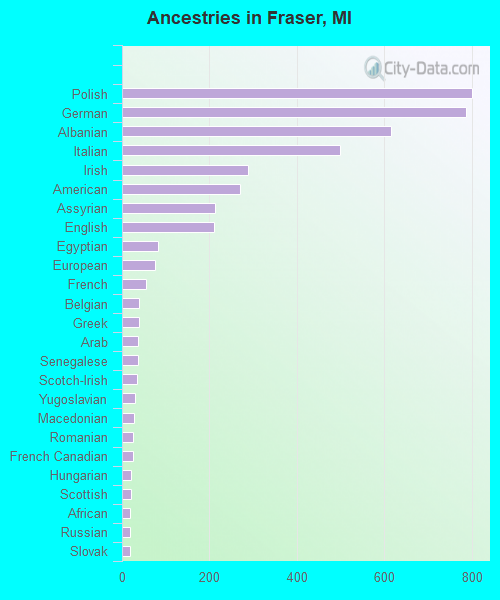
Ancestries in Fraser

- 80013.1%Polish
- 78812.9%German
- 61610.1%Albanian
- 4998.2%Italian
- 2894.7%Irish
- 2714.5%American
- 2143.5%Assyrian
- 2113.5%English
- 821.3%Egyptian
- 761.2%European
- 560.9%French
- 390.6%Belgian
- 380.6%Greek
- 370.6%Arab
- 370.6%Senegalese
- 340.6%Scotch-Irish
- 290.5%Yugoslavian
- 270.4%Macedonian
- 260.4%Romanian
- 250.4%French Canadian
- 210.3%Hungarian
- 210.3%Scottish
- 190.3%African
- 180.3%Russian
- 180.3%Slovak
- 140.2%Norwegian
- 130.2%Lithuanian
- 120.2%Lebanese
- 120.2%Canadian
- 110.2%Syrian
- 110.2%British
- 110.2%Dutch
- 110.2%Slavic
- 90.1%Northern European
- 80.1%Finnish
- 70.1%Austrian
- 50.08%Danish
- 50.08%Swedish
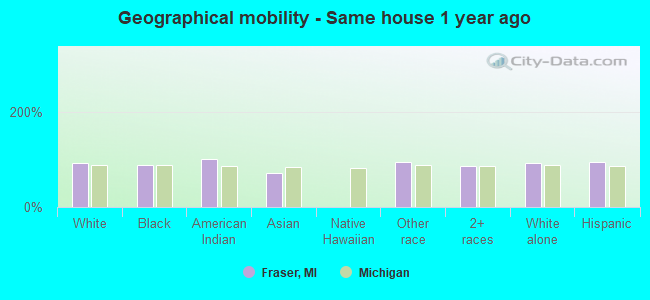
Geographical mobility in Fraser

- Same house 1 year ago
- 10,99893.4%White (Caucasian)
- 86387.0%Black or African American
- 74100.0%American Indian / Alaska Native
- 19370.5%Asian
- 14594.2%Other race
- 97286.0%Two or more races
- 10,94493.3%White alone, not Hispanic / Latino
- 36694.3%Hispanic or Latino
-
- Moved within same county
- 5464.6%White / Caucasian
- 11711.8%Black or African American
- 794.6%Native Hawaiian / Pacific Islander
- 12010.6%Two or more races
- 5574.8%White alone, not Hispanic / Latino
- 153.9%Hispanic or Latino
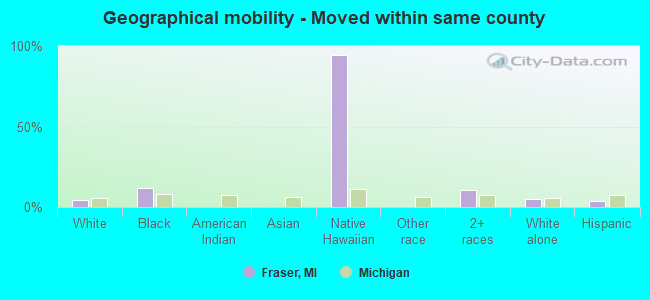
-
- Moved within same state
- 1361.2%White / Caucasian
- 101.0%Black or African American
- 96.1%Other race
- 161.4%Two or more races
- 1371.2%White alone, not Hispanic / Latino
- 61.6%Hispanic or Latino
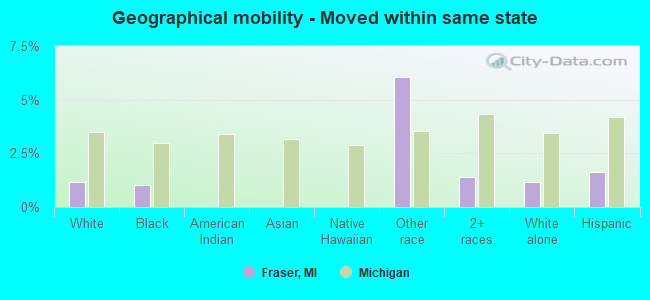
-
- Moved from different state
- 600.5%White / Caucasian
- 30.3%Black or African American
- 6323.0%Asian
- 530.5%White alone, not Hispanic / Latino
- 82.0%Hispanic or Latino

-
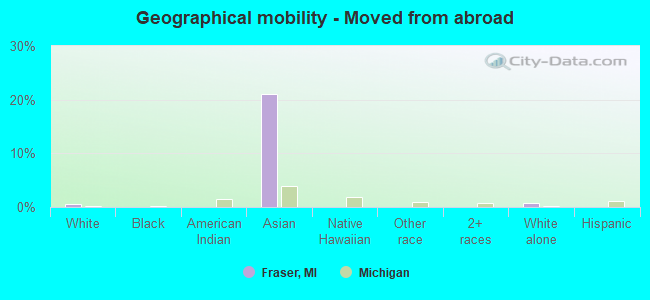
- Moved from abroad
- 740.6%White
- 5721.0%Asian
- 790.7%White alone, not Hispanic / Latino
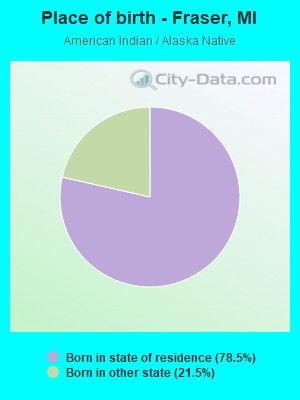
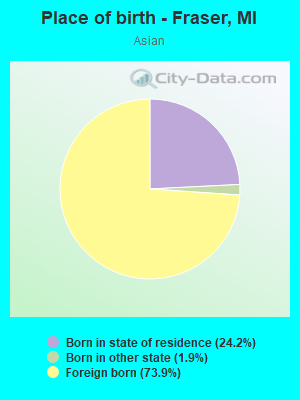
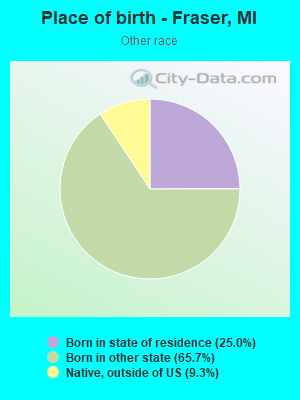
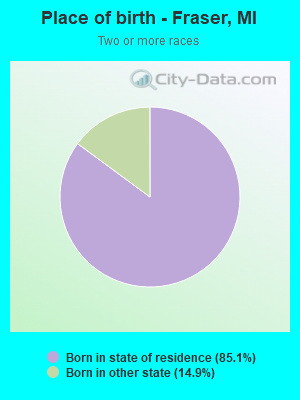
Children Nativity (place of birth) in Fraser
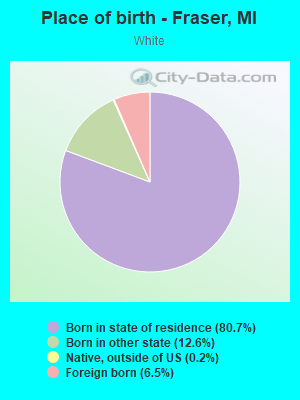
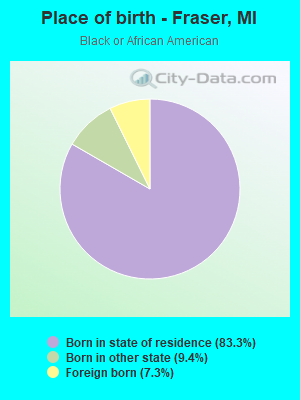
Place of birth for residents in Fraser
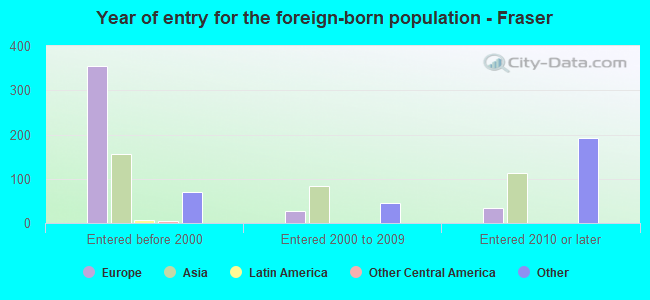
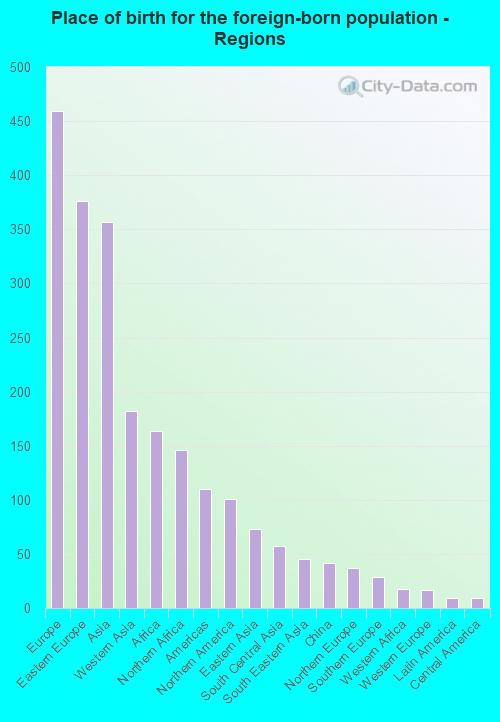
![Place of birth for the foreign-born population - Regions]()
- 459Europe
- 376Eastern Europe
- 357Asia
- 182Western Asia
- 164Africa
- 146Northern Africa
- 110Americas
- 101Northern America
- 73Eastern Asia
- 57South Central Asia
- 45South Eastern Asia
- 42China
- 37Northern Europe
- 29Southern Europe
- 18Western Africa
- 17Western Europe
- 9Latin America
- 9Central America
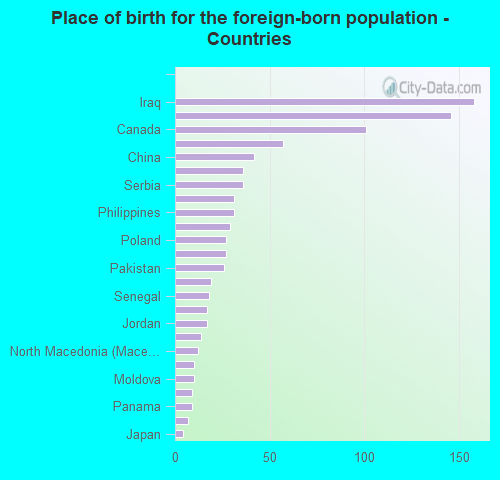
![Place of birth for the foreign-born population - Countries]()
- 158Iraq
- 146Egypt
- 101Canada
- 57Albania
- 42China
- 36Bosnia and Herzegovina
- 36Serbia
- 31India
- 31Philippines
- 29Italy
- 27Poland
- 27Korea
- 26Pakistan
- 19England
- 18Senegal
- 17Germany
- 17Jordan
- 14Vietnam
- 12North Macedonia (Macedonia)
- 10United Kingdom
- 10Moldova
- 9Belarus
- 9Panama
- 7Syria
- 4Japan
Grandparents responsible for own grandchildren in Fraser
Zip codes: 48026.