Races in Frederick, Oklahoma (OK) Detailed Stats
Data:
Races - White alone (%)
Races - White alone (% change since 2000)
Races - Black alone (%)
Races - Black alone (% change since 2000)
Races - American Indian alone (%)
Races - American Indian alone (% change since 2000)
Races - Asian alone (%)
Races - Asian alone (% change since 2000)
Races - Hispanic (%)
Races - Hispanic (% change since 2000)
Races - Native Hawaiian and Other Pacific Islander alone (%)
Races - Native Hawaiian and Other Pacific Islander alone (% change since 2000)
Races - Two or more races(%)
Races - Two or more races(% change since 2000)
Races - Other race alone (%)
Races - Other race alone (% change since 2000)
Racial diversity
Place of birth - Born in state of residence (%)
Place of birth - Born in state of residence (%) - White
Place of birth - Born in state of residence (%) - Black or African American
Place of birth - Born in state of residence (%) - Asian
Place of birth - Born in state of residence (%) - Hispanic or Latino
Place of birth - Born in state of residence (%) - American Indian and Alaska Native
Place of birth - Born in state of residence (%) - Multirace
Place of birth - Born in state of residence (%) - Other Race
Place of birth - Born in other state (%)
Place of birth - Born in other state (%) - White
Place of birth - Born in other state (%) - Black or African American
Place of birth - Born in other state (%) - Asian
Place of birth - Born in other state (%) - Hispanic or Latino
Place of birth - Born in other state (%) - American Indian and Alaska Native
Place of birth - Born in other state (%) - Multirace
Place of birth - Born in other state (%) - Other Race
Place of birth - Native, outside of US (%)
Place of birth - Native, outside of US (%) - White
Place of birth - Native, outside of US (%) - Black or African American
Place of birth - Native, outside of US (%) - Asian
Place of birth - Native, outside of US (%) - Hispanic or Latino
Place of birth - Native, outside of US (%) - American Indian and Alaska Native
Place of birth - Native, outside of US (%) - Multirace
Place of birth - Native, outside of US (%) - Other Race
Place of birth - Foreign born (%)
Place of birth - Foreign born (%) - White
Place of birth - Foreign born (%) - Black or African American
Place of birth - Foreign born (%) - Asian
Place of birth - Foreign born (%) - Hispanic or Latino
Place of birth - Foreign born (%) - American Indian and Alaska Native
Place of birth - Foreign born (%) - Multirace
Place of birth - Foreign born (%) - Other Race
Residents speaking English at home (%)
Residents speaking English at home - Born in the United States (%)
Residents speaking English at home - Native, born elsewhere (%)
Residents speaking English at home - Foreign born (%)
Residents speaking Spanish at home (%)
Residents speaking Spanish at home - Born in the United States (%)
Residents speaking Spanish at home - Native, born elsewhere (%)
Residents speaking Spanish at home - Foreign born (%)
Residents speaking other language at home (%)
Residents speaking other language at home - Born in the United States (%)
Residents speaking other language at home - Native, born elsewhere (%)
Residents speaking other language at home - Foreign born (%)
Marital status - Never married (%)
Marital status - Now married (%)
Marital status - Separated (%)
Marital status - Widowed (%)
Marital status - Divorced (%)
Ancestries Reported - Arab (%)
Ancestries Reported - Czech (%)
Ancestries Reported - Danish (%)
Ancestries Reported - Dutch (%)
Ancestries Reported - English (%)
Ancestries Reported - French (%)
Ancestries Reported - French Canadian (%)
Ancestries Reported - German (%)
Ancestries Reported - Greek (%)
Ancestries Reported - Hungarian (%)
Ancestries Reported - Irish (%)
Ancestries Reported - Italian (%)
Ancestries Reported - Lithuanian (%)
Ancestries Reported - Norwegian (%)
Ancestries Reported - Polish (%)
Ancestries Reported - Portuguese (%)
Ancestries Reported - Russian (%)
Ancestries Reported - Scotch-Irish (%)
Ancestries Reported - Scottish (%)
Ancestries Reported - Slovak (%)
Ancestries Reported - Subsaharan African (%)
Ancestries Reported - Swedish (%)
Ancestries Reported - Swiss (%)
Ancestries Reported - Ukrainian (%)
Ancestries Reported - United States (%)
Ancestries Reported - Welsh (%)
Ancestries Reported - West Indian (%)
Ancestries Reported - Other (%)
Geographical mobility - Same house 1 year ago (%)
Geographical mobility - Same house 1 year ago (%) - White
Geographical mobility - Same house 1 year ago (%) - Black or African American
Geographical mobility - Same house 1 year ago (%) - Asian
Geographical mobility - Same house 1 year ago (%) - Hispanic or Latino
Geographical mobility - Same house 1 year ago (%) - American Indian and Alaska Native
Geographical mobility - Same house 1 year ago (%) - Multirace
Geographical mobility - Same house 1 year ago (%) - Other Race
Geographical mobility - Moved within same county (%)
Geographical mobility - Moved within same county (%) - White
Geographical mobility - Moved within same county (%) - Black or African American
Geographical mobility - Moved within same county (%) - Asian
Geographical mobility - Moved within same county (%) - Hispanic or Latino
Geographical mobility - Moved within same county (%) - American Indian and Alaska Native
Geographical mobility - Moved within same county (%) - Multirace
Geographical mobility - Moved within same county (%) - Other Race
Geographical mobility - Moved from different county within same state (%)
Geographical mobility - Moved from different county within same state (%) - White
Geographical mobility - Moved from different county within same state (%) - Black or African American
Geographical mobility - Moved from different county within same state (%) - Asian
Geographical mobility - Moved from different county within same state (%) - Hispanic or Latino
Geographical mobility - Moved from different county within same state (%) - American Indian and Alaska Native
Geographical mobility - Moved from different county within same state (%) - Multirace
Geographical mobility - Moved from different county within same state (%) - Other Race
Geographical mobility - Moved from different state (%)
Geographical mobility - Moved from different state (%) - White
Geographical mobility - Moved from different state (%) - Black or African American
Geographical mobility - Moved from different state (%) - Asian
Geographical mobility - Moved from different state (%) - Hispanic or Latino
Geographical mobility - Moved from different state (%) - American Indian and Alaska Native
Geographical mobility - Moved from different state (%) - Multirace
Geographical mobility - Moved from different state (%) - Other Race
Geographical mobility - Moved from abroad (%)
Geographical mobility - Moved from abroad (%) - White
Geographical mobility - Moved from abroad (%) - Black or African American
Geographical mobility - Moved from abroad (%) - Asian
Geographical mobility - Moved from abroad (%) - Hispanic or Latino
Geographical mobility - Moved from abroad (%) - American Indian and Alaska Native
Geographical mobility - Moved from abroad (%) - Multirace
Geographical mobility - Moved from abroad (%) - Other Race
Place of birth for the foreign-born population - Ireland (%)
Place of birth for the foreign-born population - Denmark (%)
Place of birth for the foreign-born population - Norway (%)
Place of birth for the foreign-born population - Sweden (%)
Place of birth for the foreign-born population - United Kingdom (%)
Place of birth for the foreign-born population - England (%)
Place of birth for the foreign-born population - Scotland (%)
Place of birth for the foreign-born population - Other Northern Europe (%)
Place of birth for the foreign-born population - Austria (%)
Place of birth for the foreign-born population - Belgium (%)
Place of birth for the foreign-born population - France (%)
Place of birth for the foreign-born population - Germany (%)
Place of birth for the foreign-born population - Netherlands (%)
Place of birth for the foreign-born population - Switzerland (%)
Place of birth for the foreign-born population - Other Western Europe (%)
Place of birth for the foreign-born population - Greece (%)
Place of birth for the foreign-born population - Italy (%)
Place of birth for the foreign-born population - Portugal (%)
Place of birth for the foreign-born population - Spain (%)
Place of birth for the foreign-born population - Other Southern Europe (%)
Place of birth for the foreign-born population - Albania (%)
Place of birth for the foreign-born population - Belarus (%)
Place of birth for the foreign-born population - Bosnia and Herzegovina (%)
Place of birth for the foreign-born population - Bulgaria (%)
Place of birth for the foreign-born population - Croatia (%)
Place of birth for the foreign-born population - Czechoslovakia (%)
Place of birth for the foreign-born population - Hungary (%)
Place of birth for the foreign-born population - Latvia (%)
Place of birth for the foreign-born population - Lithuania (%)
Place of birth for the foreign-born population - North Macedonia (Macedonia) (%)
Place of birth for the foreign-born population - Moldova (%)
Place of birth for the foreign-born population - Poland (%)
Place of birth for the foreign-born population - Romania (%)
Place of birth for the foreign-born population - Russia (%)
Place of birth for the foreign-born population - Serbia (%)
Place of birth for the foreign-born population - Ukraine (%)
Place of birth for the foreign-born population - Other Eastern Europe (%)
Place of birth for the foreign-born population - China (%)
Place of birth for the foreign-born population - Hong Kong (%)
Place of birth for the foreign-born population - Taiwan (%)
Place of birth for the foreign-born population - Japan (%)
Place of birth for the foreign-born population - Korea (%)
Place of birth for the foreign-born population - Other Eastern Asia (%)
Place of birth for the foreign-born population - Afghanistan (%)
Place of birth for the foreign-born population - Bangladesh (%)
Place of birth for the foreign-born population - India (%)
Place of birth for the foreign-born population - Iran (%)
Place of birth for the foreign-born population - Kazakhstan (%)
Place of birth for the foreign-born population - Nepal (%)
Place of birth for the foreign-born population - Pakistan (%)
Place of birth for the foreign-born population - Sri Lanka (%)
Place of birth for the foreign-born population - Uzbekistan (%)
Place of birth for the foreign-born population - Other South Central Asia (%)
Place of birth for the foreign-born population - Burma (%)
Place of birth for the foreign-born population - Cambodia (%)
Place of birth for the foreign-born population - Indonesia (%)
Place of birth for the foreign-born population - Laos (%)
Place of birth for the foreign-born population - Malaysia (%)
Place of birth for the foreign-born population - Philippines (%)
Place of birth for the foreign-born population - Singapore (%)
Place of birth for the foreign-born population - Thailand (%)
Place of birth for the foreign-born population - Vietnam (%)
Place of birth for the foreign-born population - Other South Eastern Asia (%)
Place of birth for the foreign-born population - Armenia (%)
Place of birth for the foreign-born population - Iraq (%)
Place of birth for the foreign-born population - Israel (%)
Place of birth for the foreign-born population - Jordan (%)
Place of birth for the foreign-born population - Kuwait (%)
Place of birth for the foreign-born population - Lebanon (%)
Place of birth for the foreign-born population - Saudi Arabia (%)
Place of birth for the foreign-born population - Syria (%)
Place of birth for the foreign-born population - Turkey (%)
Place of birth for the foreign-born population - Yemen (%)
Place of birth for the foreign-born population - Other Western Asia (%)
Place of birth for the foreign-born population - Eritrea (%)
Place of birth for the foreign-born population - Ethiopia (%)
Place of birth for the foreign-born population - Kenya (%)
Place of birth for the foreign-born population - Somalia (%)
Place of birth for the foreign-born population - Uganda (%)
Place of birth for the foreign-born population - Zimbabwe (%)
Place of birth for the foreign-born population - Other Eastern Africa (%)
Place of birth for the foreign-born population - Cameroon (%)
Place of birth for the foreign-born population - Congo (%)
Place of birth for the foreign-born population - Democratic Republic of Congo (Zaire) (%)
Place of birth for the foreign-born population - Other Middle Africa (%)
Place of birth for the foreign-born population - Egypt (%)
Place of birth for the foreign-born population - Morocco (%)
Place of birth for the foreign-born population - Sudan (%)
Place of birth for the foreign-born population - Other Northern Africa (%)
Place of birth for the foreign-born population - South Africa (%)
Place of birth for the foreign-born population - Other Southern Africa (%)
Place of birth for the foreign-born population - Cabo Verde (%)
Place of birth for the foreign-born population - Ghana (%)
Place of birth for the foreign-born population - Liberia (%)
Place of birth for the foreign-born population - Nigeria (%)
Place of birth for the foreign-born population - Senegal (%)
Place of birth for the foreign-born population - Sierra Leone (%)
Place of birth for the foreign-born population - Other Western Africa (%)
Place of birth for the foreign-born population - Australia (%)
Place of birth for the foreign-born population - New Zealand (%)
Place of birth for the foreign-born population - Fiji (%)
Place of birth for the foreign-born population - Micronesia (%)
Place of birth for the foreign-born population - Bahamas (%)
Place of birth for the foreign-born population - Barbados (%)
Place of birth for the foreign-born population - Cuba (%)
Place of birth for the foreign-born population - Dominica (%)
Place of birth for the foreign-born population - Dominican Republic (%)
Place of birth for the foreign-born population - Grenada (%)
Place of birth for the foreign-born population - Haiti (%)
Place of birth for the foreign-born population - Jamaica (%)
Place of birth for the foreign-born population - St. Vincent and the Grenadines (%)
Place of birth for the foreign-born population - Trinidad and Tobago (%)
Place of birth for the foreign-born population - West Indies (%)
Place of birth for the foreign-born population - Other Caribbean (%)
Place of birth for the foreign-born population - Belize (%)
Place of birth for the foreign-born population - Costa Rica (%)
Place of birth for the foreign-born population - El Salvador (%)
Place of birth for the foreign-born population - Guatemala (%)
Place of birth for the foreign-born population - Honduras (%)
Place of birth for the foreign-born population - Mexico (%)
Place of birth for the foreign-born population - Nicaragua (%)
Place of birth for the foreign-born population - Panama (%)
Place of birth for the foreign-born population - Other Central America (%)
Place of birth for the foreign-born population - Argentina (%)
Place of birth for the foreign-born population - Bolivia (%)
Place of birth for the foreign-born population - Brazil (%)
Place of birth for the foreign-born population - Chile (%)
Place of birth for the foreign-born population - Colombia (%)
Place of birth for the foreign-born population - Ecuador (%)
Place of birth for the foreign-born population - Guyana (%)
Place of birth for the foreign-born population - Peru (%)
Place of birth for the foreign-born population - Uruguay (%)
Place of birth for the foreign-born population - Venezuela (%)
Place of birth for the foreign-born population - Other South America (%)
Place of birth for the foreign-born population - Canada (%)
Place of birth for the foreign-born population - Other Northern America (%)
Place of birth for the foreign-born population - Other (%)
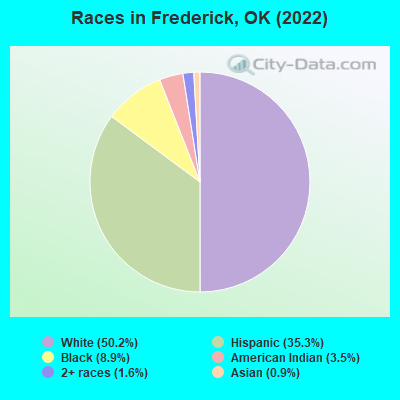
According to 2022 data, the most numerous races in Frederick, OK are White alone (1,772 residents), Hispanic (1,247 residents), and Two or more races (57 residents). 86.2% of Frederick residents speak English at home. 6.0% of Frederick, OK residents are foreign-born (4.7% born in Latin America, 0.9% born in Asia), which is about the same as the foreign-born rate of 6.0% across the entire state of Oklahoma.
Race distribution in Frederick
2000 2022
2,556,368 74.1% White alone 266,158 7.7% American Indian alone 257,981 7.5% Black alone 179,304 5.2% Hispanic 140,249 4.1% Two or more races 46,172 1.3% Asian alone 2,322 0.07% Other race alone 2,100 0.06% Native Hawaiian and Other
2,517,403 62.6% White alone 486,692 12.1% Hispanic 364,453 9.1% Two or more races 273,650 6.8% American Indian alone 268,543 6.7% Black alone 92,672 2.3% Asian alone 10,786 0.3% Other race alone 5,601 0.1% Native Hawaiian and Other
Income and house value in Frederick Median household income in 2022 $41,606 White non-Hispanic householders$35,259 Black householders$39,499 American Indian and Alaska Native householders$32,606 Some other race householders$36,833 Hispanic or Latino race householdersMedian 2022 house value $83,348 White Non-Hispanic householders$46,762 Black or African American householders$92,313 American Indian or Alaska Native householders $272,579 Asian householders$39,978 Some other race householders$41,432 Two or more races householders$44,097 Hispanic or Latino householders
Median age by race in Frederick
42.1 Median age for White residents37.6 46.7 46.6 Median age for Black or African American residents47.7 35.6 42.7 Median age for American Indian / Alaska Native residents20.6 53.2 40.3 Median age for Asian residents-662,601,625.4 54.6 -725,225,224.5 Median age for Native Hawaiian / Pacific Islander residents-675,324,674.6 -767,251,461.2 22.1 Median age for Other race residents19.4 25.2 43.7 Median age for Two or more races residents52.7 31.5 47.0 Median age for White alone residents41.9 50.5 24.6 Median age for Hispanic or Latino residents24.7 23.1
Owner/renter occupied households by race in Frederick
House owners and renters - White residents 723 78.7% Owner occupied195 21.3% Renter occupiedHouse owners and renters - Black or African American residents 27 25.8% Owner occupied79 74.2% Renter occupiedHouse owners and renters - American Indian / Alaska Native residents 20 58.4% Owner occupied14 41.6% Renter occupiedHouse owners and renters - Asian residents 8 100.0% Renter occupiedHouse owners and renters - Other race residents 133 60.2% Owner occupied88 39.8% Renter occupiedHouse owners and renters - Two or more races residents 66 82.1% Owner occupied14 17.9% Renter occupiedHouse owners and renters - White alone residents 622 75.6% Owner occupied201 24.4% Renter occupiedHouse owners and renters - Hispanic or Latino residents 294 76.7% Owner occupied90 23.3% Renter occupied
Language usage in Frederick
English speakers - Total 86.2% of residents of Frederick speak English at home.
14.0% of residents speak Spanish at home 269 58.5% Speak English very well191 41.5% Speak English less than very well0.1% of residents speak other language at home 2 100.0% Speak English very well
English speakers - Born in the United States 89.3% of residents of Frederick speak English at home.
10.7% of residents speak Spanish at home 88 77.2% Speak English very well26 22.8% Speak English less than very well0.3% of residents speak other language at home 3 100.0% Speak English very well
English speakers - Native, born elsewhere 72.7% of residents of Frederick speak English at home.
27.3% of residents speak Spanish at home 6 100.0% Speak English very well
English speakers - Foreign-born 21.9% of residents of Frederick speak English at home.
78.1% of residents speak Spanish at home 18 11.0% Speak English very well146 89.0% Speak English less than very well
White (Caucasian) - Speak only English Native:
94.3% (1,809)Foreign-born:
56.8% (32)
White (Caucasian) - Speak another language Native:
4.6% (88)Foreign-born:
54.9% (31)
American Indian / Alaska Native - Speak another language Native:
8.6% (11)Foreign-born:
100.0% (31)
Asian - Speak only English Native:
99.7% (19)Foreign-born:
95.0% (13)
Other race - Speak another language Native:
26.9% (125)Foreign-born:
100.0% (43)
Two or more races - Speak another language Native:
19.5% (39)Foreign-born:
100.0% (64)
White alone - Speak only English Native:
98.9% (1,624)Foreign-born:
100.0% (33)
Hispanic or Latino - Speak another language Native:
28.5% (271)Foreign-born:
99.4% (168)
Foreign-born residents in Frederick 210 residents are foreign born (4.7% Latin America , 0.9% Asia ).
This city:
6.0%Oklahoma:
6.1%
Marital status for residents in Frederick Marital status - White (Caucasian) population 15 years and over
Males 31.4% Never married50.8% Now married0.0% Separated2.9% Widowed14.9% DivorcedFemales 18.6% Never married48.9% Now married2.7% Separated17.0% Widowed12.7% DivorcedWomen who gave birth in the past 12 months Now married:
36.8% (7)Unmarried:
63.2% (12)
Women who did not give birth in the past 12 months Now married:
52.8% (198)Unmarried:
47.2% (177)
Marital status - Black or African American population 15 years and over
Males 49.6% Never married48.0% Now married0.0% Separated0.8% Widowed1.6% DivorcedFemales 57.9% Never married26.2% Now married5.6% Separated5.6% Widowed4.6% DivorcedWomen who did not give birth in the past 12 months Now married:
13.0% (15)Unmarried:
87.0% (100)
Marital status - American Indian / Alaska Native population 15 years and over
Males 50.8% Never married49.2% Now married0.0% Separated0.0% Widowed0.0% DivorcedFemales 25.8% Never married42.4% Now married0.0% Separated31.8% Widowed0.0% DivorcedWomen who did not give birth in the past 12 months Now married:
57.9% (11)Unmarried:
42.1% (8)
Marital status - Asian population 15 years and over
Males 75.0% Never married25.0% Now married0.0% Separated0.0% Widowed0.0% DivorcedFemales 26.3% Never married0.0% Now married0.0% Separated36.8% Widowed36.8% DivorcedWomen who did not give birth in the past 12 months Now married:
0.0% (0)Unmarried:
100.0% (5)
Marital status - Other race population 15 years and over
Males 24.4% Never married44.2% Now married3.5% Separated8.7% Widowed19.2% DivorcedFemales 50.6% Never married20.5% Now married0.0% Separated5.4% Widowed23.5% DivorcedWomen who gave birth in the past 12 months Now married:
0.0% (0)Unmarried:
100.0% (64)
Women who did not give birth in the past 12 months Now married:
20.9% (21)Unmarried:
79.1% (79)
Marital status - Two or more races population 15 years and over
Males 22.2% Never married68.5% Now married0.0% Separated0.0% Widowed9.3% DivorcedFemales 16.7% Never married40.2% Now married0.0% Separated38.2% Widowed4.9% DivorcedWomen who gave birth in the past 12 months Now married:
0.0% (0)Unmarried:
100.0% (7)
Women who did not give birth in the past 12 months Now married:
60.0% (32)Unmarried:
40.0% (21)
Marital status - White alone, not Hispanic / Latino population 15 years and over
Males 23.5% Never married54.1% Now married0.0% Separated3.6% Widowed18.8% DivorcedFemales 18.9% Never married45.8% Now married3.1% Separated18.0% Widowed14.2% DivorcedWomen who gave birth in the past 12 months Now married:
36.8% (7)Unmarried:
63.2% (12)
Women who did not give birth in the past 12 months Now married:
49.8% (166)Unmarried:
50.2% (167)
Marital status - Hispanic or Latino population 15 years and over
Males 38.4% Never married46.4% Now married1.5% Separated3.9% Widowed9.8% DivorcedFemales 32.1% Never married42.7% Now married0.0% Separated14.5% Widowed10.7% DivorcedWomen who gave birth in the past 12 months Now married:
0.0% (0)Unmarried:
100.0% (60)
Women who did not give birth in the past 12 months Now married:
47.1% (99)Unmarried:
52.9% (111)
Ancestries in Frederick
395 19.0% American261 12.6% English145 7.0% German51 2.5% Irish21 1.0% European17 0.8% Egyptian16 0.8% Swedish10 0.5% Scottish7 0.3% Italian6 0.3% African5 0.2% Scotch-Irish
Children Nativity (place of birth) in Frederick
Children under 6 years - Living with two parents Both parents native 134 100.0% NativeBoth parents foreign-born 9 100.0% NativeOne native, one foreign-born parent 5 100.0% NativeChildren under 6 years - Living with one parent Native parent 125 100.0% NativeChildren 6 to 17 years - Living with two parents Both parents native 296 100.0% NativeBoth parents foreign-born 47 100.0% NativeOne native, one foreign-born parent 65 100.0% NativeChildren 6 to 17 years - Living with one parent Native parent 155 100.0% NativeForeign-born parent 28 49.9% Native28 50.1% Foreign-born
Place of birth for residents in Frederick 162 Americas162 Latin America162 Central America30 Asia17 Europe17 Western Europe16 Western Asia13 South Eastern Asia
Grandparents responsible for own grandchildren in Frederick
Grandparents (30 to 59 years) White / Caucasian 3 100.0% Not responsible for grandchildrenBlack or African American 6 100.0% Responsible for grandchildrenWhite alone, not Hispanic / Latino 3 100.0% Not responsible for grandchildrenGrandparents (60 years and over) White / Caucasian 20 27.8% Responsible for grandchildren52 72.2% Not responsible for grandchildrenWhite alone, not Hispanic / Latino 20 26.9% Responsible for grandchildren54 73.1% Not responsible for grandchildren