Races in Frederickson, Washington (WA) Detailed Stats
Data:
Races - White alone (%)
Races - White alone (% change since 2000)
Races - Black alone (%)
Races - Black alone (% change since 2000)
Races - American Indian alone (%)
Races - American Indian alone (% change since 2000)
Races - Asian alone (%)
Races - Asian alone (% change since 2000)
Races - Hispanic (%)
Races - Hispanic (% change since 2000)
Races - Native Hawaiian and Other Pacific Islander alone (%)
Races - Native Hawaiian and Other Pacific Islander alone (% change since 2000)
Races - Two or more races(%)
Races - Two or more races(% change since 2000)
Races - Other race alone (%)
Races - Other race alone (% change since 2000)
Racial diversity
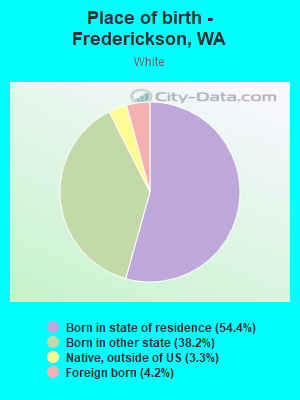
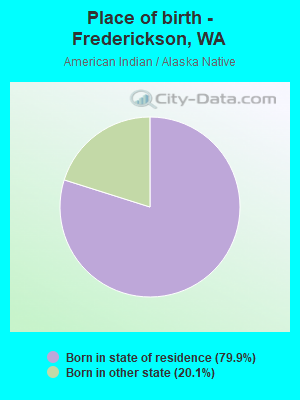
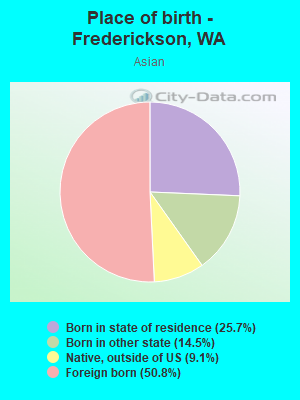
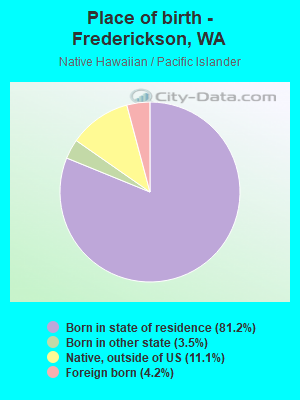
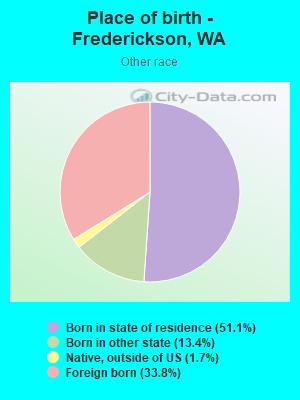
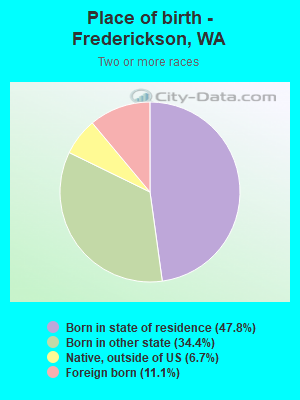
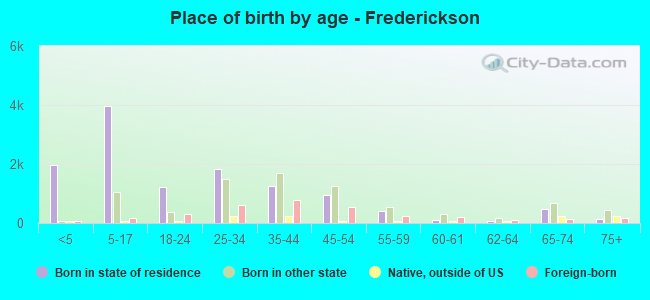
Place of birth - Born in state of residence (%)
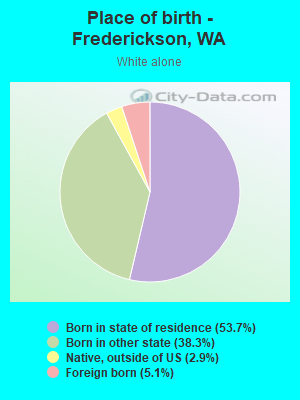
Place of birth - Born in state of residence (%) - White
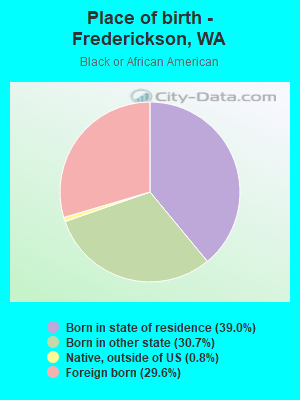
Place of birth - Born in state of residence (%) - Black or African American
Place of birth - Born in state of residence (%) - Asian
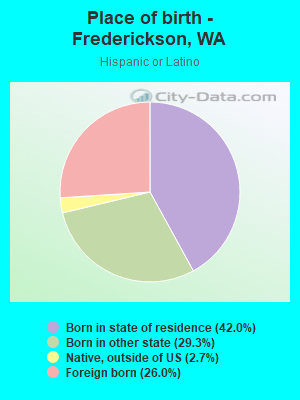
Place of birth - Born in state of residence (%) - Hispanic or Latino
Place of birth - Born in state of residence (%) - American Indian and Alaska Native
Place of birth - Born in state of residence (%) - Multirace
Place of birth - Born in state of residence (%) - Other Race
Place of birth - Born in other state (%)
Place of birth - Born in other state (%) - White
Place of birth - Born in other state (%) - Black or African American
Place of birth - Born in other state (%) - Asian
Place of birth - Born in other state (%) - Hispanic or Latino
Place of birth - Born in other state (%) - American Indian and Alaska Native
Place of birth - Born in other state (%) - Multirace
Place of birth - Born in other state (%) - Other Race
Place of birth - Native, outside of US (%)
Place of birth - Native, outside of US (%) - White
Place of birth - Native, outside of US (%) - Black or African American
Place of birth - Native, outside of US (%) - Asian
Place of birth - Native, outside of US (%) - Hispanic or Latino
Place of birth - Native, outside of US (%) - American Indian and Alaska Native
Place of birth - Native, outside of US (%) - Multirace
Place of birth - Native, outside of US (%) - Other Race
Place of birth - Foreign born (%)
Place of birth - Foreign born (%) - White
Place of birth - Foreign born (%) - Black or African American
Place of birth - Foreign born (%) - Asian
Place of birth - Foreign born (%) - Hispanic or Latino
Place of birth - Foreign born (%) - American Indian and Alaska Native
Place of birth - Foreign born (%) - Multirace
Place of birth - Foreign born (%) - Other Race
Residents speaking English at home (%)
Residents speaking English at home - Born in the United States (%)
Residents speaking English at home - Native, born elsewhere (%)
Residents speaking English at home - Foreign born (%)
Residents speaking Spanish at home (%)
Residents speaking Spanish at home - Born in the United States (%)
Residents speaking Spanish at home - Native, born elsewhere (%)
Residents speaking Spanish at home - Foreign born (%)
Residents speaking other language at home (%)
Residents speaking other language at home - Born in the United States (%)
Residents speaking other language at home - Native, born elsewhere (%)
Residents speaking other language at home - Foreign born (%)
Marital status - Never married (%)
Marital status - Now married (%)
Marital status - Separated (%)
Marital status - Widowed (%)
Marital status - Divorced (%)
Ancestries Reported - Arab (%)
Ancestries Reported - Czech (%)
Ancestries Reported - Danish (%)
Ancestries Reported - Dutch (%)
Ancestries Reported - English (%)
Ancestries Reported - French (%)
Ancestries Reported - French Canadian (%)
Ancestries Reported - German (%)
Ancestries Reported - Greek (%)
Ancestries Reported - Hungarian (%)
Ancestries Reported - Irish (%)
Ancestries Reported - Italian (%)
Ancestries Reported - Lithuanian (%)
Ancestries Reported - Norwegian (%)
Ancestries Reported - Polish (%)
Ancestries Reported - Portuguese (%)
Ancestries Reported - Russian (%)
Ancestries Reported - Scotch-Irish (%)
Ancestries Reported - Scottish (%)
Ancestries Reported - Slovak (%)
Ancestries Reported - Subsaharan African (%)
Ancestries Reported - Swedish (%)
Ancestries Reported - Swiss (%)
Ancestries Reported - Ukrainian (%)
Ancestries Reported - United States (%)
Ancestries Reported - Welsh (%)
Ancestries Reported - West Indian (%)
Ancestries Reported - Other (%)
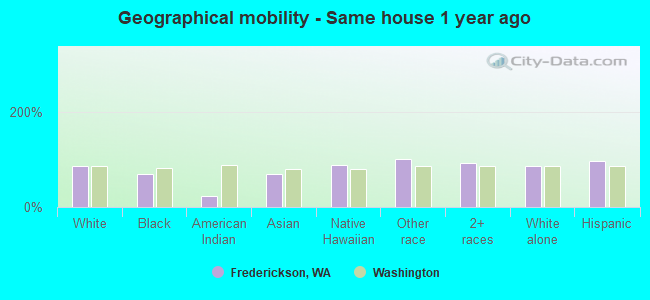
Geographical mobility - Same house 1 year ago (%)
Geographical mobility - Same house 1 year ago (%) - White
Geographical mobility - Same house 1 year ago (%) - Black or African American
Geographical mobility - Same house 1 year ago (%) - Asian
Geographical mobility - Same house 1 year ago (%) - Hispanic or Latino
Geographical mobility - Same house 1 year ago (%) - American Indian and Alaska Native
Geographical mobility - Same house 1 year ago (%) - Multirace
Geographical mobility - Same house 1 year ago (%) - Other Race
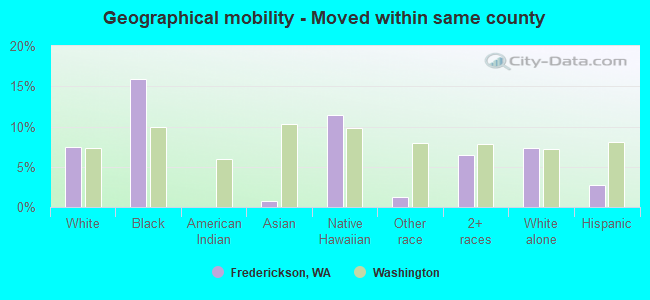
Geographical mobility - Moved within same county (%)
Geographical mobility - Moved within same county (%) - White
Geographical mobility - Moved within same county (%) - Black or African American
Geographical mobility - Moved within same county (%) - Asian
Geographical mobility - Moved within same county (%) - Hispanic or Latino
Geographical mobility - Moved within same county (%) - American Indian and Alaska Native
Geographical mobility - Moved within same county (%) - Multirace
Geographical mobility - Moved within same county (%) - Other Race
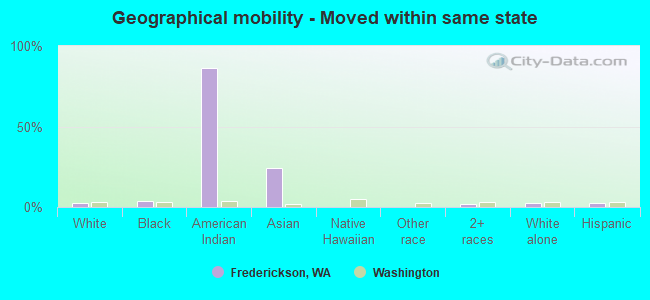
Geographical mobility - Moved from different county within same state (%)
Geographical mobility - Moved from different county within same state (%) - White
Geographical mobility - Moved from different county within same state (%) - Black or African American
Geographical mobility - Moved from different county within same state (%) - Asian
Geographical mobility - Moved from different county within same state (%) - Hispanic or Latino
Geographical mobility - Moved from different county within same state (%) - American Indian and Alaska Native
Geographical mobility - Moved from different county within same state (%) - Multirace
Geographical mobility - Moved from different county within same state (%) - Other Race
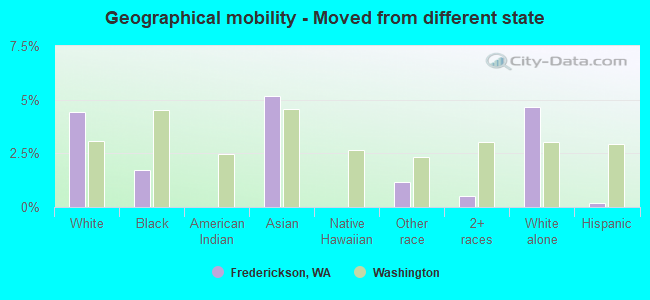
Geographical mobility - Moved from different state (%)
Geographical mobility - Moved from different state (%) - White
Geographical mobility - Moved from different state (%) - Black or African American
Geographical mobility - Moved from different state (%) - Asian
Geographical mobility - Moved from different state (%) - Hispanic or Latino
Geographical mobility - Moved from different state (%) - American Indian and Alaska Native
Geographical mobility - Moved from different state (%) - Multirace
Geographical mobility - Moved from different state (%) - Other Race
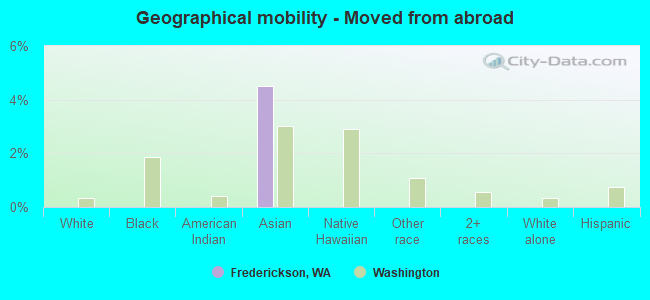
Geographical mobility - Moved from abroad (%)
Geographical mobility - Moved from abroad (%) - White
Geographical mobility - Moved from abroad (%) - Black or African American
Geographical mobility - Moved from abroad (%) - Asian
Geographical mobility - Moved from abroad (%) - Hispanic or Latino
Geographical mobility - Moved from abroad (%) - American Indian and Alaska Native
Geographical mobility - Moved from abroad (%) - Multirace
Geographical mobility - Moved from abroad (%) - Other Race
Place of birth for the foreign-born population - Ireland (%)
Place of birth for the foreign-born population - Denmark (%)
Place of birth for the foreign-born population - Norway (%)
Place of birth for the foreign-born population - Sweden (%)
Place of birth for the foreign-born population - United Kingdom (%)
Place of birth for the foreign-born population - England (%)
Place of birth for the foreign-born population - Scotland (%)
Place of birth for the foreign-born population - Other Northern Europe (%)
Place of birth for the foreign-born population - Austria (%)
Place of birth for the foreign-born population - Belgium (%)
Place of birth for the foreign-born population - France (%)
Place of birth for the foreign-born population - Germany (%)
Place of birth for the foreign-born population - Netherlands (%)
Place of birth for the foreign-born population - Switzerland (%)
Place of birth for the foreign-born population - Other Western Europe (%)
Place of birth for the foreign-born population - Greece (%)
Place of birth for the foreign-born population - Italy (%)
Place of birth for the foreign-born population - Portugal (%)
Place of birth for the foreign-born population - Spain (%)
Place of birth for the foreign-born population - Other Southern Europe (%)
Place of birth for the foreign-born population - Albania (%)
Place of birth for the foreign-born population - Belarus (%)
Place of birth for the foreign-born population - Bosnia and Herzegovina (%)
Place of birth for the foreign-born population - Bulgaria (%)
Place of birth for the foreign-born population - Croatia (%)
Place of birth for the foreign-born population - Czechoslovakia (%)
Place of birth for the foreign-born population - Hungary (%)
Place of birth for the foreign-born population - Latvia (%)
Place of birth for the foreign-born population - Lithuania (%)
Place of birth for the foreign-born population - North Macedonia (Macedonia) (%)
Place of birth for the foreign-born population - Moldova (%)
Place of birth for the foreign-born population - Poland (%)
Place of birth for the foreign-born population - Romania (%)
Place of birth for the foreign-born population - Russia (%)
Place of birth for the foreign-born population - Serbia (%)
Place of birth for the foreign-born population - Ukraine (%)
Place of birth for the foreign-born population - Other Eastern Europe (%)
Place of birth for the foreign-born population - China (%)
Place of birth for the foreign-born population - Hong Kong (%)
Place of birth for the foreign-born population - Taiwan (%)
Place of birth for the foreign-born population - Japan (%)
Place of birth for the foreign-born population - Korea (%)
Place of birth for the foreign-born population - Other Eastern Asia (%)
Place of birth for the foreign-born population - Afghanistan (%)
Place of birth for the foreign-born population - Bangladesh (%)
Place of birth for the foreign-born population - India (%)
Place of birth for the foreign-born population - Iran (%)
Place of birth for the foreign-born population - Kazakhstan (%)
Place of birth for the foreign-born population - Nepal (%)
Place of birth for the foreign-born population - Pakistan (%)
Place of birth for the foreign-born population - Sri Lanka (%)
Place of birth for the foreign-born population - Uzbekistan (%)
Place of birth for the foreign-born population - Other South Central Asia (%)
Place of birth for the foreign-born population - Burma (%)
Place of birth for the foreign-born population - Cambodia (%)
Place of birth for the foreign-born population - Indonesia (%)
Place of birth for the foreign-born population - Laos (%)
Place of birth for the foreign-born population - Malaysia (%)
Place of birth for the foreign-born population - Philippines (%)
Place of birth for the foreign-born population - Singapore (%)
Place of birth for the foreign-born population - Thailand (%)
Place of birth for the foreign-born population - Vietnam (%)
Place of birth for the foreign-born population - Other South Eastern Asia (%)
Place of birth for the foreign-born population - Armenia (%)
Place of birth for the foreign-born population - Iraq (%)
Place of birth for the foreign-born population - Israel (%)
Place of birth for the foreign-born population - Jordan (%)
Place of birth for the foreign-born population - Kuwait (%)
Place of birth for the foreign-born population - Lebanon (%)
Place of birth for the foreign-born population - Saudi Arabia (%)
Place of birth for the foreign-born population - Syria (%)
Place of birth for the foreign-born population - Turkey (%)
Place of birth for the foreign-born population - Yemen (%)
Place of birth for the foreign-born population - Other Western Asia (%)
Place of birth for the foreign-born population - Eritrea (%)
Place of birth for the foreign-born population - Ethiopia (%)
Place of birth for the foreign-born population - Kenya (%)
Place of birth for the foreign-born population - Somalia (%)
Place of birth for the foreign-born population - Uganda (%)
Place of birth for the foreign-born population - Zimbabwe (%)
Place of birth for the foreign-born population - Other Eastern Africa (%)
Place of birth for the foreign-born population - Cameroon (%)
Place of birth for the foreign-born population - Congo (%)
Place of birth for the foreign-born population - Democratic Republic of Congo (Zaire) (%)
Place of birth for the foreign-born population - Other Middle Africa (%)
Place of birth for the foreign-born population - Egypt (%)
Place of birth for the foreign-born population - Morocco (%)
Place of birth for the foreign-born population - Sudan (%)
Place of birth for the foreign-born population - Other Northern Africa (%)
Place of birth for the foreign-born population - South Africa (%)
Place of birth for the foreign-born population - Other Southern Africa (%)
Place of birth for the foreign-born population - Cabo Verde (%)
Place of birth for the foreign-born population - Ghana (%)
Place of birth for the foreign-born population - Liberia (%)
Place of birth for the foreign-born population - Nigeria (%)
Place of birth for the foreign-born population - Senegal (%)
Place of birth for the foreign-born population - Sierra Leone (%)
Place of birth for the foreign-born population - Other Western Africa (%)
Place of birth for the foreign-born population - Australia (%)
Place of birth for the foreign-born population - New Zealand (%)
Place of birth for the foreign-born population - Fiji (%)
Place of birth for the foreign-born population - Micronesia (%)
Place of birth for the foreign-born population - Bahamas (%)
Place of birth for the foreign-born population - Barbados (%)
Place of birth for the foreign-born population - Cuba (%)
Place of birth for the foreign-born population - Dominica (%)
Place of birth for the foreign-born population - Dominican Republic (%)
Place of birth for the foreign-born population - Grenada (%)
Place of birth for the foreign-born population - Haiti (%)
Place of birth for the foreign-born population - Jamaica (%)
Place of birth for the foreign-born population - St. Vincent and the Grenadines (%)
Place of birth for the foreign-born population - Trinidad and Tobago (%)
Place of birth for the foreign-born population - West Indies (%)
Place of birth for the foreign-born population - Other Caribbean (%)
Place of birth for the foreign-born population - Belize (%)
Place of birth for the foreign-born population - Costa Rica (%)
Place of birth for the foreign-born population - El Salvador (%)
Place of birth for the foreign-born population - Guatemala (%)
Place of birth for the foreign-born population - Honduras (%)
Place of birth for the foreign-born population - Mexico (%)
Place of birth for the foreign-born population - Nicaragua (%)
Place of birth for the foreign-born population - Panama (%)
Place of birth for the foreign-born population - Other Central America (%)
Place of birth for the foreign-born population - Argentina (%)
Place of birth for the foreign-born population - Bolivia (%)
Place of birth for the foreign-born population - Brazil (%)
Place of birth for the foreign-born population - Chile (%)
Place of birth for the foreign-born population - Colombia (%)
Place of birth for the foreign-born population - Ecuador (%)
Place of birth for the foreign-born population - Guyana (%)
Place of birth for the foreign-born population - Peru (%)
Place of birth for the foreign-born population - Uruguay (%)
Place of birth for the foreign-born population - Venezuela (%)
Place of birth for the foreign-born population - Other South America (%)
Place of birth for the foreign-born population - Canada (%)
Place of birth for the foreign-born population - Other Northern America (%)
Place of birth for the foreign-born population - Other (%)
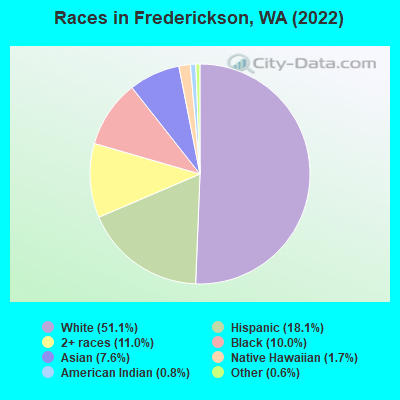
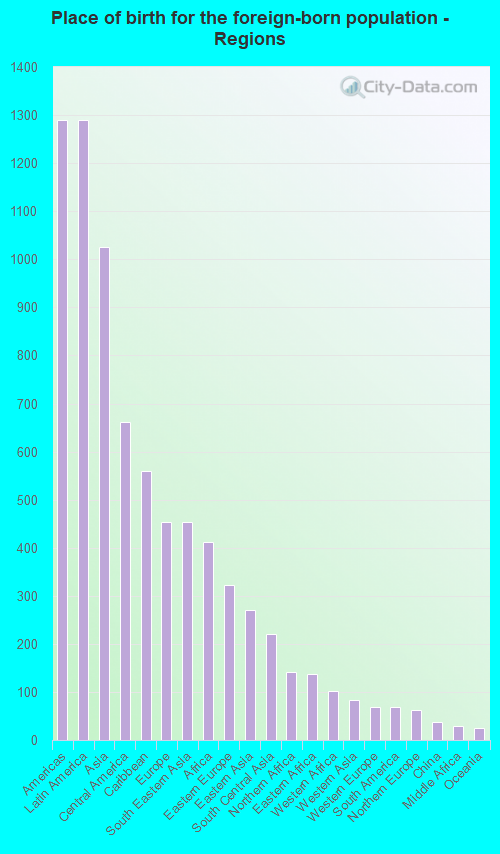
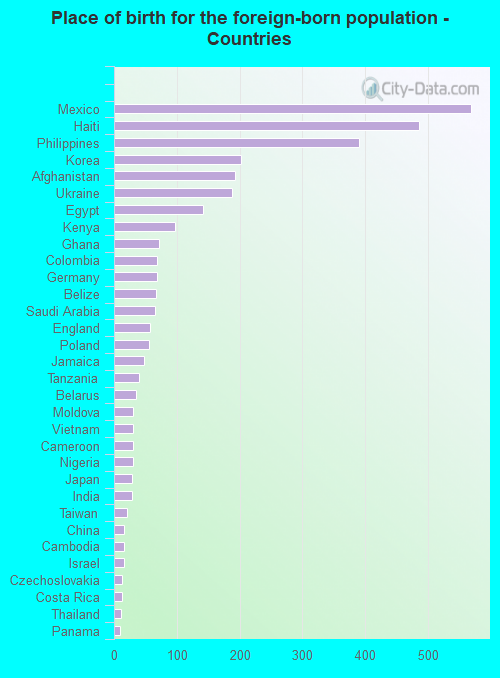
According to 2022 data, the most numerous races in Frederickson, WA are White alone (12,752 residents), Hispanic (4,522 residents), and Asian alone (1,887 residents). 77.9% of Frederickson residents speak English at home. 12.8% of Frederickson, WA residents are foreign-born (5.0% born in Latin America, 4.0% born in Asia, 1.8% born in Europe, 1.6% born in Africa), which is 16.7% less than the foreign-born rate of 15.0% across the entire state of Washington.
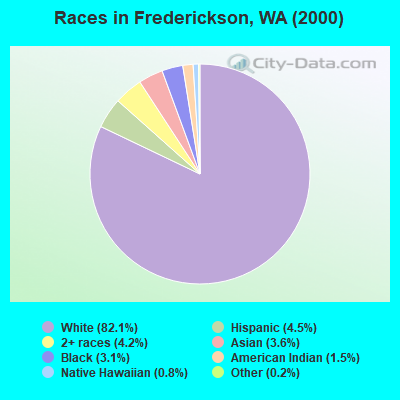
Race distribution in Frederickson
2000 2022
4,652,490 78.9% White alone 441,509 7.5% Hispanic 319,401 5.4% Asian alone 184,631 3.1% Black alone 175,926 3.0% Two or more races 85,396 1.4% American Indian alone 22,779 0.4% Native Hawaiian and Other 11,989 0.2% Other race alone
4,941,456 63.5% White alone 1,093,313 14.0% Hispanic 755,832 9.7% Asian alone 523,448 6.7% Two or more races 299,537 3.8% Black alone 69,024 0.9% American Indian alone 52,231 0.7% Native Hawaiian and Other 50,945 0.7% Other race alone
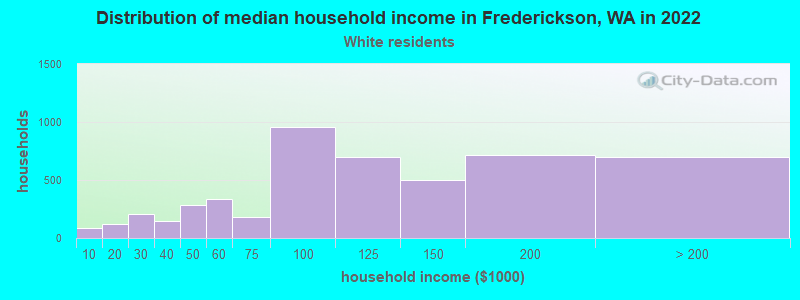
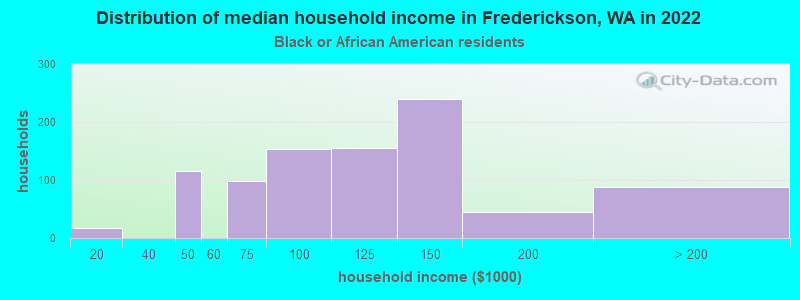
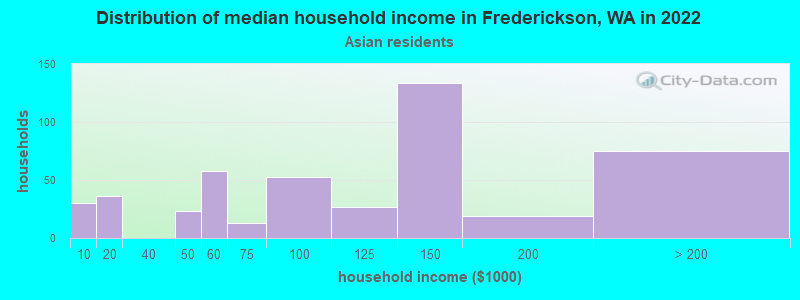
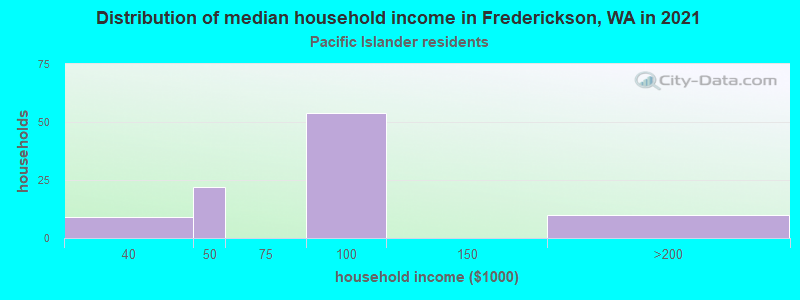
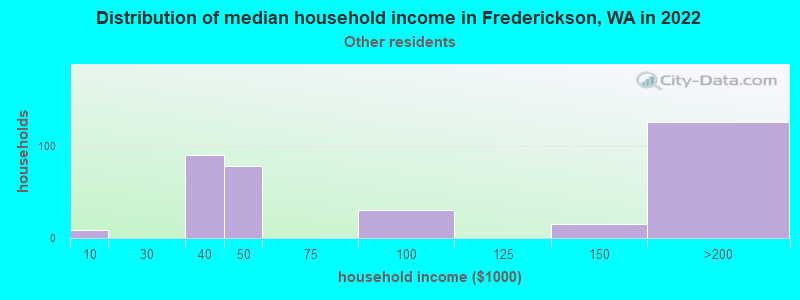
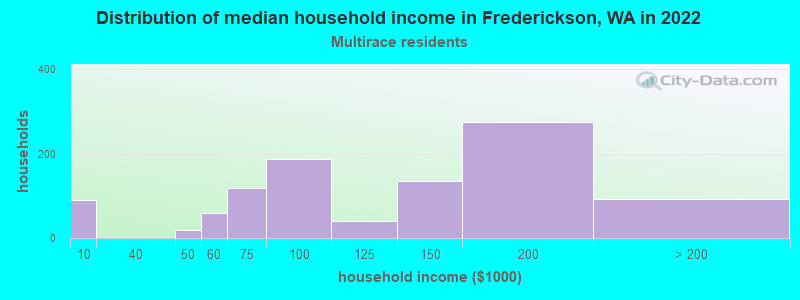
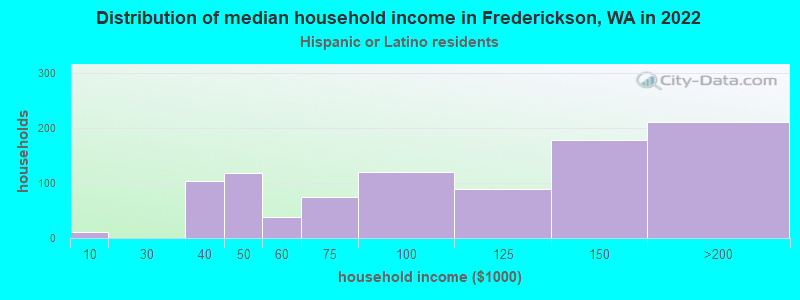
Income and house value in Frederickson Median household income in 2022 $103,089 White non-Hispanic householders$102,825 Black householders$105,525 Asian householders$94,889 Native Hawaiian and other Pacific Islander householders$92,530 Some other race householders$109,785 Two or more races householders$106,735 Hispanic or Latino race householdersMedian 2022 house value $542,941 White Non-Hispanic householders$564,791 Black or African American householders$484,674 American Indian or Alaska Native householders $706,816 Asian householders$500,896 Some other race householders$744,888 Two or more races householders$478,715 Hispanic or Latino householders
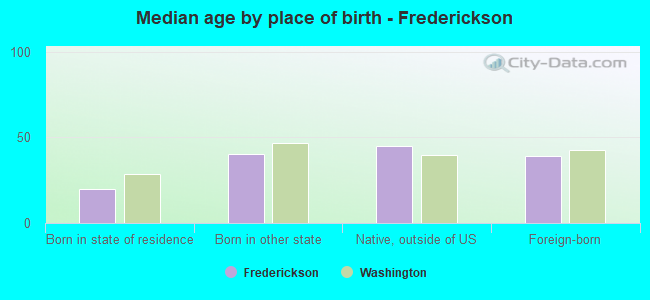
Median age by race in Frederickson
36.3 Median age for White residents34.5 37.2 36.5 Median age for Black or African American residents38.2 34.7 20.9 Median age for American Indian / Alaska Native residents21.4 20.3 33.9 Median age for Asian residents31.0 45.8 7.7 Median age for Native Hawaiian / Pacific Islander residents3.8 31.8 37.4 Median age for Other race residents28.8 40.2 16.4 Median age for Two or more races residents16.1 16.9 36.8 Median age for White alone residents35.5 37.8 27.0 Median age for Hispanic or Latino residents26.5 30.4
Owner/renter occupied households by race in Frederickson
House owners and renters - White residents 3,830 76.2% Owner occupied1,194 23.8% Renter occupiedHouse owners and renters - Black or African American residents 690 77.3% Owner occupied202 22.7% Renter occupiedHouse owners and renters - American Indian / Alaska Native residents 16 100.0% Owner occupiedHouse owners and renters - Asian residents 422 85.4% Owner occupied72 14.6% Renter occupiedHouse owners and renters - Native Hawaiian / Pacific Islander residents 112 75.1% Owner occupied37 24.9% Renter occupiedHouse owners and renters - Other race residents 251 78.5% Owner occupied69 21.5% Renter occupiedHouse owners and renters - Two or more races residents 606 59.0% Owner occupied422 41.0% Renter occupiedHouse owners and renters - White alone residents 3,675 76.7% Owner occupied1,116 23.3% Renter occupiedHouse owners and renters - Hispanic or Latino residents 653 66.4% Owner occupied330 33.6% Renter occupied
Language usage in Frederickson
English speakers - Total 77.9% of residents of Frederickson speak English at home.
8.9% of residents speak Spanish at home 1,283 63.0% Speak English very well752 37.0% Speak English less than very well13.3% of residents speak other language at home 1,793 58.9% Speak English very well1,252 41.1% Speak English less than very well
English speakers - Born in the United States 85.3% of residents of Frederickson speak English at home.
11.1% of residents speak Spanish at home 735 81.0% Speak English very well172 19.0% Speak English less than very well4.0% of residents speak other language at home 214 65.8% Speak English very well111 34.2% Speak English less than very well
English speakers - Native, born elsewhere 65.5% of residents of Frederickson speak English at home.
3.2% of residents speak Spanish at home 17 48.6% Speak English very well18 51.4% Speak English less than very well32.9% of residents speak other language at home 357 100.0% Speak English very well
English speakers - Foreign-born 19.6% of residents of Frederickson speak English at home.
18.4% of residents speak Spanish at home 269 44.9% Speak English very well330 55.1% Speak English less than very well62.1% of residents speak other language at home 893 44.2% Speak English very well1,126 55.8% Speak English less than very well
White (Caucasian) - Speak only English Native:
94.8% (11,549)Foreign-born:
34.3% (196)
White (Caucasian) - Speak another language Native:
4.3% (528)Foreign-born:
64.7% (370)
Black or African American - Speak only English Native:
98.2% (1,863)Foreign-born:
13.4% (127)
Black or African American - Speak another language Native:
1.5% (28)Foreign-born:
87.9% (835)
Asian - Speak only English Native:
53.7% (465)Foreign-born:
4.4% (40)
Asian - Speak another language Native:
44.8% (389)Foreign-born:
91.0% (833)
Native Hawaiian / Pacific Islander - Speak only English Native:
87.3% (187)Foreign-born:
60.1% (12)
Native Hawaiian / Pacific Islander - Speak another language Native:
9.8% (21)Foreign-born:
53.6% (10)
Other race - Speak only English Native:
65.7% (426)Foreign-born:
19.1% (65)
Other race - Speak another language Native:
35.0% (227)Foreign-born:
81.7% (279)
Two or more races - Speak only English Native:
66.4% (2,619)Foreign-born:
17.5% (95)
Two or more races - Speak another language Native:
36.2% (1,429)Foreign-born:
77.3% (420)
White alone - Speak only English Native:
95.3% (10,734)Foreign-born:
29.8% (193)
White alone - Speak another language Native:
4.2% (472)Foreign-born:
70.7% (457)
Hispanic or Latino - Speak only English Native:
60.7% (1,903)Foreign-born:
4.8% (56)
Hispanic or Latino - Speak another language Native:
38.8% (1,217)Foreign-born:
95.9% (1,136)
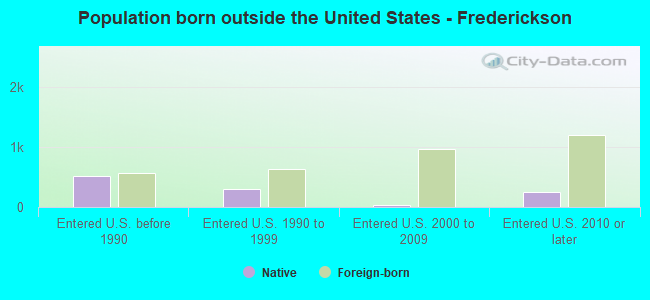
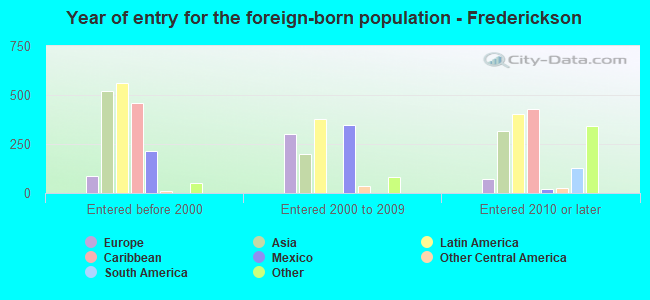
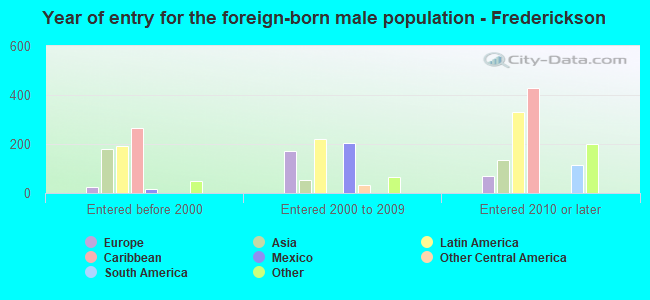
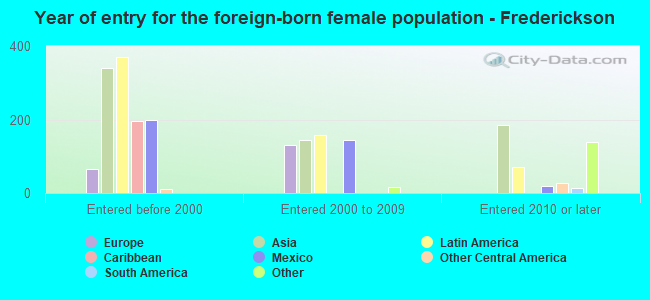
Foreign-born residents in Frederickson 3,208 residents are foreign born (5.0% Latin America , 4.0% Asia , 1.8% Europe , 1.6% Africa ).
This city:
12.8%Washington:
14.9%
Marital status for residents in Frederickson Marital status - White (Caucasian) population 15 years and over
Males 27.8% Never married55.8% Now married1.2% Separated1.8% Widowed13.4% DivorcedFemales 20.8% Never married55.2% Now married0.4% Separated4.6% Widowed18.9% DivorcedWomen who gave birth in the past 12 months Now married:
85.2% (119)Unmarried:
14.8% (21)
Women who did not give birth in the past 12 months Now married:
56.7% (1,816)Unmarried:
43.3% (1,387)
Marital status - Black or African American population 15 years and over
Males 33.3% Never married37.1% Now married1.4% Separated2.1% Widowed26.0% DivorcedFemales 16.5% Never married56.0% Now married5.5% Separated13.4% Widowed8.6% DivorcedWomen who gave birth in the past 12 months Now married:
34.7% (17)Unmarried:
65.3% (31)
Women who did not give birth in the past 12 months Now married:
76.7% (268)Unmarried:
23.3% (81)
Marital status - American Indian / Alaska Native population 15 years and over
Males 21.7% Never married26.5% Now married21.7% Separated30.1% Widowed0.0% DivorcedFemales 67.3% Never married32.7% Now married0.0% Separated0.0% Widowed0.0% DivorcedWomen who did not give birth in the past 12 months Now married:
27.0% (37)Unmarried:
73.0% (101)
Marital status - Asian population 15 years and over
Males 21.9% Never married63.9% Now married1.1% Separated0.0% Widowed13.1% DivorcedFemales 20.3% Never married70.1% Now married0.0% Separated5.3% Widowed4.3% DivorcedWomen who gave birth in the past 12 months Now married:
100.0% (17)Unmarried:
0.0% (0)
Women who did not give birth in the past 12 months Now married:
57.3% (277)Unmarried:
42.7% (206)
Marital status - Native Hawaiian / Pacific Islander population 15 years and over
Males 100.0% Never married0.0% Now married0.0% Separated0.0% Widowed0.0% DivorcedFemales 18.9% Never married21.0% Now married0.0% Separated8.4% Widowed51.7% DivorcedWomen who gave birth in the past 12 months Now married:
0.0% (0)Unmarried:
100.0% (83)
Women who did not give birth in the past 12 months Now married:
52.6% (34)Unmarried:
47.4% (30)
Marital status - Other race population 15 years and over
Males 39.5% Never married53.6% Now married0.0% Separated0.0% Widowed6.9% DivorcedFemales 68.3% Never married31.7% Now married0.0% Separated0.0% Widowed0.0% DivorcedWomen who did not give birth in the past 12 months Now married:
26.2% (114)Unmarried:
73.8% (321)
Marital status - Two or more races population 15 years and over
Males 49.5% Never married36.5% Now married0.0% Separated0.0% Widowed14.0% DivorcedFemales 40.7% Never married52.7% Now married0.0% Separated1.3% Widowed5.2% DivorcedWomen who gave birth in the past 12 months Now married:
77.8% (9)Unmarried:
22.2% (3)
Women who did not give birth in the past 12 months Now married:
53.4% (574)Unmarried:
46.6% (501)
Marital status - White alone, not Hispanic / Latino population 15 years and over
Males 27.0% Never married56.0% Now married1.2% Separated1.9% Widowed13.8% DivorcedFemales 20.5% Never married56.1% Now married0.4% Separated5.1% Widowed17.8% DivorcedWomen who gave birth in the past 12 months Now married:
80.5% (88)Unmarried:
19.5% (21)
Women who did not give birth in the past 12 months Now married:
57.8% (1,722)Unmarried:
42.2% (1,257)
Marital status - Hispanic or Latino population 15 years and over
Males 48.5% Never married37.4% Now married0.0% Separated1.7% Widowed12.4% DivorcedFemales 36.2% Never married45.0% Now married0.0% Separated4.4% Widowed14.4% DivorcedWomen who gave birth in the past 12 months Now married:
51.4% (39)Unmarried:
48.6% (37)
Women who did not give birth in the past 12 months Now married:
45.6% (469)Unmarried:
54.4% (558)
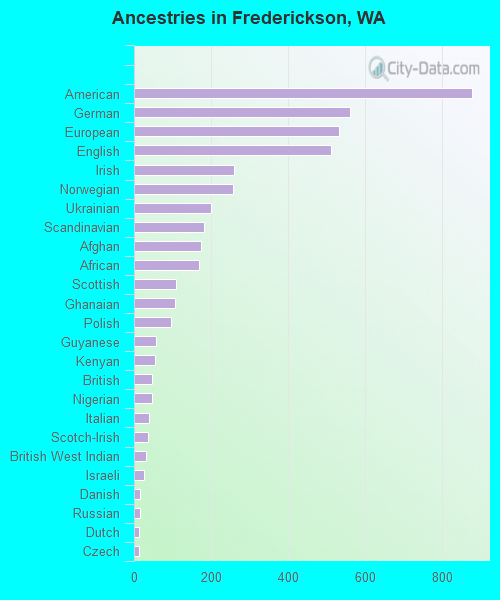
Ancestries in Frederickson
877 8.9% American559 5.6% German533 5.4% European510 5.1% English260 2.6% Irish256 2.6% Norwegian199 2.0% Ukrainian182 1.8% Scandinavian174 1.8% Afghan168 1.7% African110 1.1% Scottish107 1.1% Ghanaian97 1.0% Polish56 0.6% Guyanese55 0.6% Kenyan47 0.5% British47 0.5% Nigerian40 0.4% Italian37 0.4% Scotch-Irish30 0.3% British West Indian25 0.3% Israeli16 0.2% Danish16 0.2% Russian13 0.1% Dutch12 0.1% Czech9 0.09% Pennsylvania German8 0.08% Swedish7 0.07% Canadian7 0.07% French Canadian5 0.05% Romanian
Geographical mobility in Frederickson Same house 1 year ago 11,477 85.9% White (Caucasian)2,123 69.5% Black or African American59 24.4% American Indian / Alaska Native1,371 70.1% Asian281 89.3% Native Hawaiian / Pacific Islander1,048 100.0% Other race4,530 92.6% Two or more races10,690 85.5% White alone, not Hispanic / Latino4,300 95.6% Hispanic or LatinoMoved within same county 989 7.4% White / Caucasian488 16.0% Black or African American14 0.7% Asian36 11.4% Native Hawaiian / Pacific Islander13 1.3% Other race319 6.5% Two or more races917 7.3% White alone, not Hispanic / Latino124 2.8% Hispanic or LatinoMoved within same state 330 2.5% White / Caucasian116 3.8% Black or African American209 86.3% American Indian / Alaska Native480 24.5% Asian91 1.9% Two or more races313 2.5% White alone, not Hispanic / Latino112 2.5% Hispanic or LatinoMoved from different state 589 4.4% White / Caucasian53 1.7% Black or African American101 5.1% Asian12 1.2% Other race25 0.5% Two or more races583 4.7% White alone, not Hispanic / Latino9 0.2% Hispanic or LatinoMoved from abroad 88 4.5% Asian
Children Nativity (place of birth) in Frederickson
Children under 6 years - Living with two parents Both parents native 968 100.0% NativeBoth parents foreign-born 222 77.2% Native65 22.8% Foreign-bornOne native, one foreign-born parent 321 100.0% NativeChildren under 6 years - Living with one parent Native parent 517 100.0% NativeForeign-born parent 37 100.0% NativeChildren 6 to 17 years - Living with two parents Both parents native 2,095 100.0% NativeBoth parents foreign-born 650 79.4% Native169 20.6% Foreign-bornOne native, one foreign-born parent 158 88.5% Native21 11.5% Foreign-bornChildren 6 to 17 years - Living with one parent Native parent 1,601 100.0% NativeForeign-born parent 205 49.7% Native208 50.3% Foreign-born
Grandparents responsible for own grandchildren in Frederickson
Grandparents (30 to 59 years) White / Caucasian 47 18.9% Responsible for grandchildren204 81.1% Not responsible for grandchildrenBlack or African American 79 100.0% Not responsible for grandchildrenTwo or more races 15 100.0% Not responsible for grandchildrenWhite alone, not Hispanic / Latino 42 16.6% Responsible for grandchildren209 83.4% Not responsible for grandchildrenGrandparents (60 years and over) White / Caucasian 28 21.0% Responsible for grandchildren106 79.0% Not responsible for grandchildrenBlack or African American 12 100.0% Not responsible for grandchildrenTwo or more races 3 100.0% Not responsible for grandchildrenWhite alone, not Hispanic / Latino 30 22.0% Responsible for grandchildren105 78.0% Not responsible for grandchildren