Races in Freehold, New Jersey (NJ) Detailed Stats
Data:
Races - White alone (%)
Races - White alone (% change since 2000)
Races - Black alone (%)
Races - Black alone (% change since 2000)
Races - American Indian alone (%)
Races - American Indian alone (% change since 2000)
Races - Asian alone (%)
Races - Asian alone (% change since 2000)
Races - Hispanic (%)
Races - Hispanic (% change since 2000)
Races - Native Hawaiian and Other Pacific Islander alone (%)
Races - Native Hawaiian and Other Pacific Islander alone (% change since 2000)
Races - Two or more races(%)
Races - Two or more races(% change since 2000)
Races - Other race alone (%)
Races - Other race alone (% change since 2000)
Racial diversity
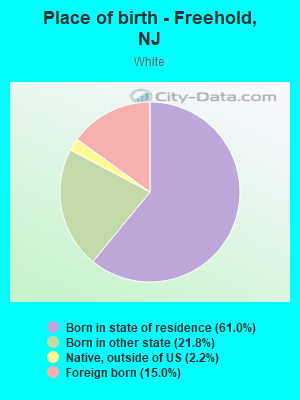
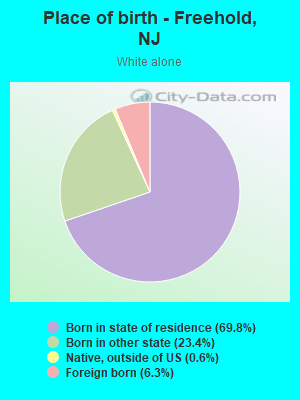
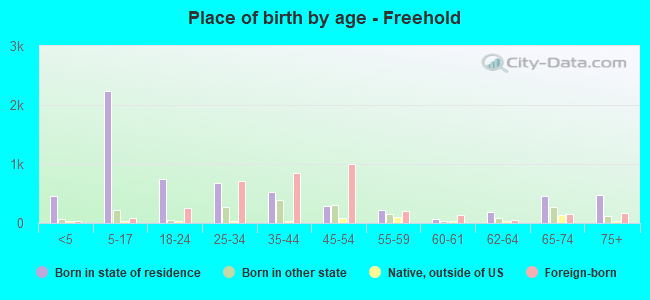
Place of birth - Born in state of residence (%)
Place of birth - Born in state of residence (%) - White
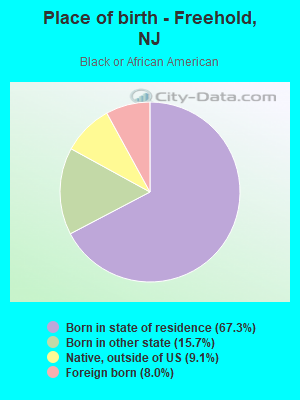
Place of birth - Born in state of residence (%) - Black or African American
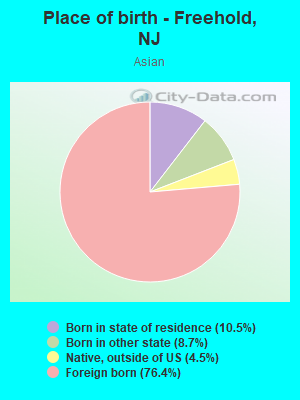
Place of birth - Born in state of residence (%) - Asian
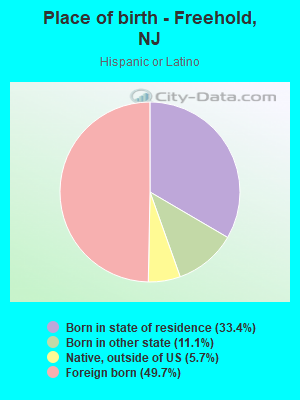
Place of birth - Born in state of residence (%) - Hispanic or Latino
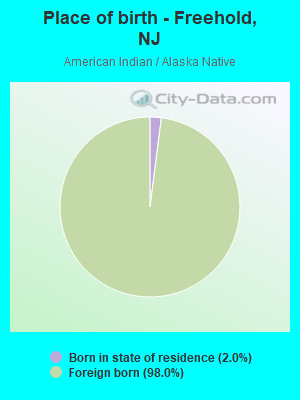
Place of birth - Born in state of residence (%) - American Indian and Alaska Native
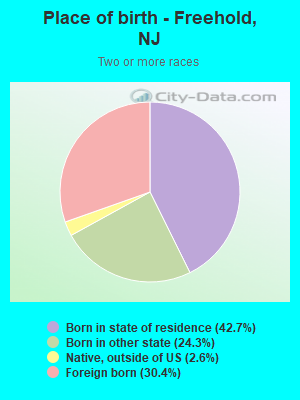
Place of birth - Born in state of residence (%) - Multirace
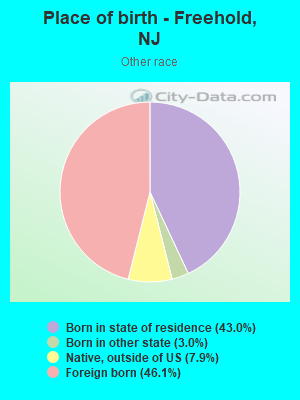
Place of birth - Born in state of residence (%) - Other Race
Place of birth - Born in other state (%)
Place of birth - Born in other state (%) - White
Place of birth - Born in other state (%) - Black or African American
Place of birth - Born in other state (%) - Asian
Place of birth - Born in other state (%) - Hispanic or Latino
Place of birth - Born in other state (%) - American Indian and Alaska Native
Place of birth - Born in other state (%) - Multirace
Place of birth - Born in other state (%) - Other Race
Place of birth - Native, outside of US (%)
Place of birth - Native, outside of US (%) - White
Place of birth - Native, outside of US (%) - Black or African American
Place of birth - Native, outside of US (%) - Asian
Place of birth - Native, outside of US (%) - Hispanic or Latino
Place of birth - Native, outside of US (%) - American Indian and Alaska Native
Place of birth - Native, outside of US (%) - Multirace
Place of birth - Native, outside of US (%) - Other Race
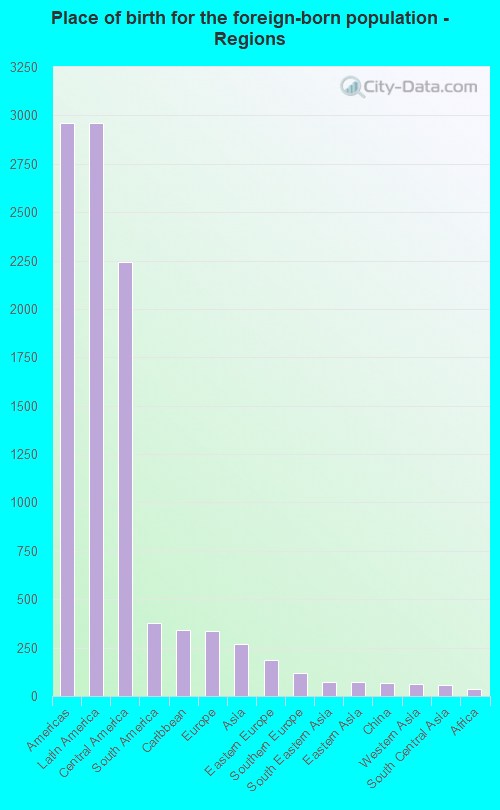
Place of birth - Foreign born (%)
Place of birth - Foreign born (%) - White
Place of birth - Foreign born (%) - Black or African American
Place of birth - Foreign born (%) - Asian
Place of birth - Foreign born (%) - Hispanic or Latino
Place of birth - Foreign born (%) - American Indian and Alaska Native
Place of birth - Foreign born (%) - Multirace
Place of birth - Foreign born (%) - Other Race
Residents speaking English at home (%)
Residents speaking English at home - Born in the United States (%)
Residents speaking English at home - Native, born elsewhere (%)
Residents speaking English at home - Foreign born (%)
Residents speaking Spanish at home (%)
Residents speaking Spanish at home - Born in the United States (%)
Residents speaking Spanish at home - Native, born elsewhere (%)
Residents speaking Spanish at home - Foreign born (%)
Residents speaking other language at home (%)
Residents speaking other language at home - Born in the United States (%)
Residents speaking other language at home - Native, born elsewhere (%)
Residents speaking other language at home - Foreign born (%)
Marital status - Never married (%)
Marital status - Now married (%)
Marital status - Separated (%)
Marital status - Widowed (%)
Marital status - Divorced (%)
Ancestries Reported - Arab (%)
Ancestries Reported - Czech (%)
Ancestries Reported - Danish (%)
Ancestries Reported - Dutch (%)
Ancestries Reported - English (%)
Ancestries Reported - French (%)
Ancestries Reported - French Canadian (%)
Ancestries Reported - German (%)
Ancestries Reported - Greek (%)
Ancestries Reported - Hungarian (%)
Ancestries Reported - Irish (%)
Ancestries Reported - Italian (%)
Ancestries Reported - Lithuanian (%)
Ancestries Reported - Norwegian (%)
Ancestries Reported - Polish (%)
Ancestries Reported - Portuguese (%)
Ancestries Reported - Russian (%)
Ancestries Reported - Scotch-Irish (%)
Ancestries Reported - Scottish (%)
Ancestries Reported - Slovak (%)
Ancestries Reported - Subsaharan African (%)
Ancestries Reported - Swedish (%)
Ancestries Reported - Swiss (%)
Ancestries Reported - Ukrainian (%)
Ancestries Reported - United States (%)
Ancestries Reported - Welsh (%)
Ancestries Reported - West Indian (%)
Ancestries Reported - Other (%)
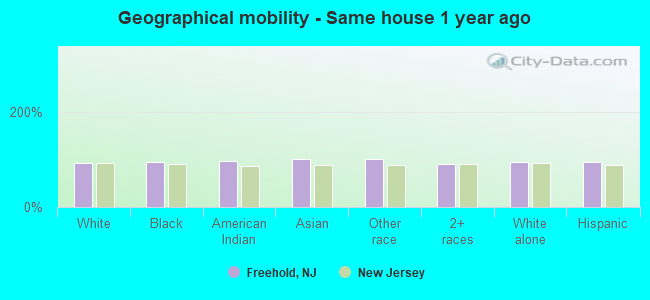
Geographical mobility - Same house 1 year ago (%)
Geographical mobility - Same house 1 year ago (%) - White
Geographical mobility - Same house 1 year ago (%) - Black or African American
Geographical mobility - Same house 1 year ago (%) - Asian
Geographical mobility - Same house 1 year ago (%) - Hispanic or Latino
Geographical mobility - Same house 1 year ago (%) - American Indian and Alaska Native
Geographical mobility - Same house 1 year ago (%) - Multirace
Geographical mobility - Same house 1 year ago (%) - Other Race
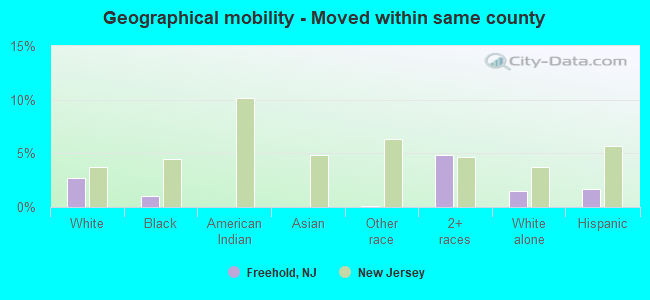
Geographical mobility - Moved within same county (%)
Geographical mobility - Moved within same county (%) - White
Geographical mobility - Moved within same county (%) - Black or African American
Geographical mobility - Moved within same county (%) - Asian
Geographical mobility - Moved within same county (%) - Hispanic or Latino
Geographical mobility - Moved within same county (%) - American Indian and Alaska Native
Geographical mobility - Moved within same county (%) - Multirace
Geographical mobility - Moved within same county (%) - Other Race
Geographical mobility - Moved from different county within same state (%)
Geographical mobility - Moved from different county within same state (%) - White
Geographical mobility - Moved from different county within same state (%) - Black or African American
Geographical mobility - Moved from different county within same state (%) - Asian
Geographical mobility - Moved from different county within same state (%) - Hispanic or Latino
Geographical mobility - Moved from different county within same state (%) - American Indian and Alaska Native
Geographical mobility - Moved from different county within same state (%) - Multirace
Geographical mobility - Moved from different county within same state (%) - Other Race
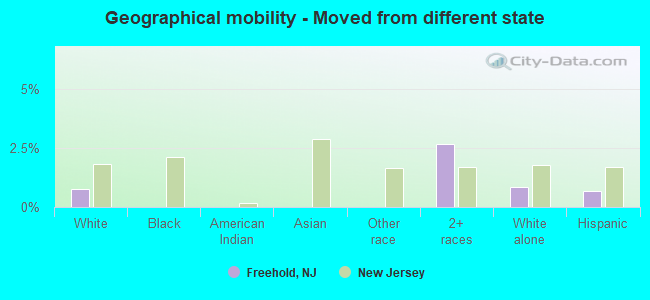
Geographical mobility - Moved from different state (%)
Geographical mobility - Moved from different state (%) - White
Geographical mobility - Moved from different state (%) - Black or African American
Geographical mobility - Moved from different state (%) - Asian
Geographical mobility - Moved from different state (%) - Hispanic or Latino
Geographical mobility - Moved from different state (%) - American Indian and Alaska Native
Geographical mobility - Moved from different state (%) - Multirace
Geographical mobility - Moved from different state (%) - Other Race
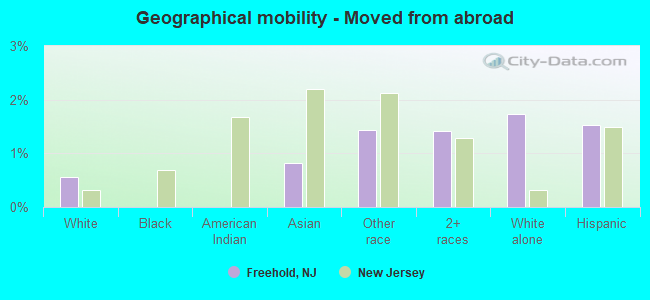
Geographical mobility - Moved from abroad (%)
Geographical mobility - Moved from abroad (%) - White
Geographical mobility - Moved from abroad (%) - Black or African American
Geographical mobility - Moved from abroad (%) - Asian
Geographical mobility - Moved from abroad (%) - Hispanic or Latino
Geographical mobility - Moved from abroad (%) - American Indian and Alaska Native
Geographical mobility - Moved from abroad (%) - Multirace
Geographical mobility - Moved from abroad (%) - Other Race
Place of birth for the foreign-born population - Ireland (%)
Place of birth for the foreign-born population - Denmark (%)
Place of birth for the foreign-born population - Norway (%)
Place of birth for the foreign-born population - Sweden (%)
Place of birth for the foreign-born population - United Kingdom (%)
Place of birth for the foreign-born population - England (%)
Place of birth for the foreign-born population - Scotland (%)
Place of birth for the foreign-born population - Other Northern Europe (%)
Place of birth for the foreign-born population - Austria (%)
Place of birth for the foreign-born population - Belgium (%)
Place of birth for the foreign-born population - France (%)
Place of birth for the foreign-born population - Germany (%)
Place of birth for the foreign-born population - Netherlands (%)
Place of birth for the foreign-born population - Switzerland (%)
Place of birth for the foreign-born population - Other Western Europe (%)
Place of birth for the foreign-born population - Greece (%)
Place of birth for the foreign-born population - Italy (%)
Place of birth for the foreign-born population - Portugal (%)
Place of birth for the foreign-born population - Spain (%)
Place of birth for the foreign-born population - Other Southern Europe (%)
Place of birth for the foreign-born population - Albania (%)
Place of birth for the foreign-born population - Belarus (%)
Place of birth for the foreign-born population - Bosnia and Herzegovina (%)
Place of birth for the foreign-born population - Bulgaria (%)
Place of birth for the foreign-born population - Croatia (%)
Place of birth for the foreign-born population - Czechoslovakia (%)
Place of birth for the foreign-born population - Hungary (%)
Place of birth for the foreign-born population - Latvia (%)
Place of birth for the foreign-born population - Lithuania (%)
Place of birth for the foreign-born population - North Macedonia (Macedonia) (%)
Place of birth for the foreign-born population - Moldova (%)
Place of birth for the foreign-born population - Poland (%)
Place of birth for the foreign-born population - Romania (%)
Place of birth for the foreign-born population - Russia (%)
Place of birth for the foreign-born population - Serbia (%)
Place of birth for the foreign-born population - Ukraine (%)
Place of birth for the foreign-born population - Other Eastern Europe (%)
Place of birth for the foreign-born population - China (%)
Place of birth for the foreign-born population - Hong Kong (%)
Place of birth for the foreign-born population - Taiwan (%)
Place of birth for the foreign-born population - Japan (%)
Place of birth for the foreign-born population - Korea (%)
Place of birth for the foreign-born population - Other Eastern Asia (%)
Place of birth for the foreign-born population - Afghanistan (%)
Place of birth for the foreign-born population - Bangladesh (%)
Place of birth for the foreign-born population - India (%)
Place of birth for the foreign-born population - Iran (%)
Place of birth for the foreign-born population - Kazakhstan (%)
Place of birth for the foreign-born population - Nepal (%)
Place of birth for the foreign-born population - Pakistan (%)
Place of birth for the foreign-born population - Sri Lanka (%)
Place of birth for the foreign-born population - Uzbekistan (%)
Place of birth for the foreign-born population - Other South Central Asia (%)
Place of birth for the foreign-born population - Burma (%)
Place of birth for the foreign-born population - Cambodia (%)
Place of birth for the foreign-born population - Indonesia (%)
Place of birth for the foreign-born population - Laos (%)
Place of birth for the foreign-born population - Malaysia (%)
Place of birth for the foreign-born population - Philippines (%)
Place of birth for the foreign-born population - Singapore (%)
Place of birth for the foreign-born population - Thailand (%)
Place of birth for the foreign-born population - Vietnam (%)
Place of birth for the foreign-born population - Other South Eastern Asia (%)
Place of birth for the foreign-born population - Armenia (%)
Place of birth for the foreign-born population - Iraq (%)
Place of birth for the foreign-born population - Israel (%)
Place of birth for the foreign-born population - Jordan (%)
Place of birth for the foreign-born population - Kuwait (%)
Place of birth for the foreign-born population - Lebanon (%)
Place of birth for the foreign-born population - Saudi Arabia (%)
Place of birth for the foreign-born population - Syria (%)
Place of birth for the foreign-born population - Turkey (%)
Place of birth for the foreign-born population - Yemen (%)
Place of birth for the foreign-born population - Other Western Asia (%)
Place of birth for the foreign-born population - Eritrea (%)
Place of birth for the foreign-born population - Ethiopia (%)
Place of birth for the foreign-born population - Kenya (%)
Place of birth for the foreign-born population - Somalia (%)
Place of birth for the foreign-born population - Uganda (%)
Place of birth for the foreign-born population - Zimbabwe (%)
Place of birth for the foreign-born population - Other Eastern Africa (%)
Place of birth for the foreign-born population - Cameroon (%)
Place of birth for the foreign-born population - Congo (%)
Place of birth for the foreign-born population - Democratic Republic of Congo (Zaire) (%)
Place of birth for the foreign-born population - Other Middle Africa (%)
Place of birth for the foreign-born population - Egypt (%)
Place of birth for the foreign-born population - Morocco (%)
Place of birth for the foreign-born population - Sudan (%)
Place of birth for the foreign-born population - Other Northern Africa (%)
Place of birth for the foreign-born population - South Africa (%)
Place of birth for the foreign-born population - Other Southern Africa (%)
Place of birth for the foreign-born population - Cabo Verde (%)
Place of birth for the foreign-born population - Ghana (%)
Place of birth for the foreign-born population - Liberia (%)
Place of birth for the foreign-born population - Nigeria (%)
Place of birth for the foreign-born population - Senegal (%)
Place of birth for the foreign-born population - Sierra Leone (%)
Place of birth for the foreign-born population - Other Western Africa (%)
Place of birth for the foreign-born population - Australia (%)
Place of birth for the foreign-born population - New Zealand (%)
Place of birth for the foreign-born population - Fiji (%)
Place of birth for the foreign-born population - Micronesia (%)
Place of birth for the foreign-born population - Bahamas (%)
Place of birth for the foreign-born population - Barbados (%)
Place of birth for the foreign-born population - Cuba (%)
Place of birth for the foreign-born population - Dominica (%)
Place of birth for the foreign-born population - Dominican Republic (%)
Place of birth for the foreign-born population - Grenada (%)
Place of birth for the foreign-born population - Haiti (%)
Place of birth for the foreign-born population - Jamaica (%)
Place of birth for the foreign-born population - St. Vincent and the Grenadines (%)
Place of birth for the foreign-born population - Trinidad and Tobago (%)
Place of birth for the foreign-born population - West Indies (%)
Place of birth for the foreign-born population - Other Caribbean (%)
Place of birth for the foreign-born population - Belize (%)
Place of birth for the foreign-born population - Costa Rica (%)
Place of birth for the foreign-born population - El Salvador (%)
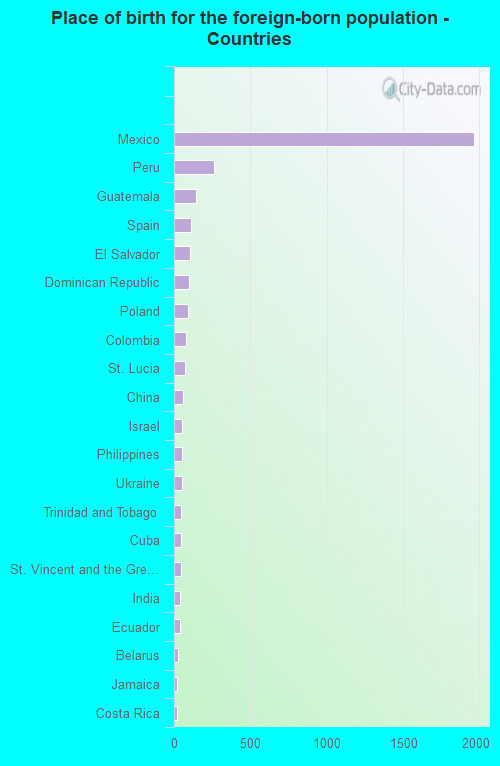
Place of birth for the foreign-born population - Guatemala (%)
Place of birth for the foreign-born population - Honduras (%)
Place of birth for the foreign-born population - Mexico (%)
Place of birth for the foreign-born population - Nicaragua (%)
Place of birth for the foreign-born population - Panama (%)
Place of birth for the foreign-born population - Other Central America (%)
Place of birth for the foreign-born population - Argentina (%)
Place of birth for the foreign-born population - Bolivia (%)
Place of birth for the foreign-born population - Brazil (%)
Place of birth for the foreign-born population - Chile (%)
Place of birth for the foreign-born population - Colombia (%)
Place of birth for the foreign-born population - Ecuador (%)
Place of birth for the foreign-born population - Guyana (%)
Place of birth for the foreign-born population - Peru (%)
Place of birth for the foreign-born population - Uruguay (%)
Place of birth for the foreign-born population - Venezuela (%)
Place of birth for the foreign-born population - Other South America (%)
Place of birth for the foreign-born population - Canada (%)
Place of birth for the foreign-born population - Other Northern America (%)
Place of birth for the foreign-born population - Other (%)
Latest news about races in Freehold, NJ collected exclusively by city-data.com from local newspapers, TV, and radio stations
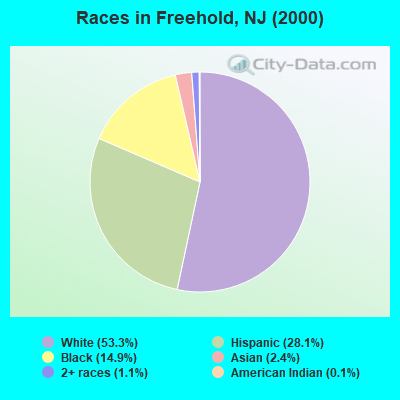
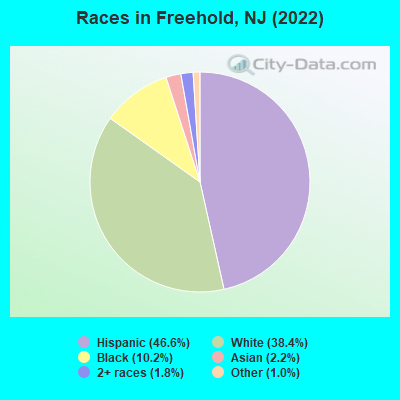
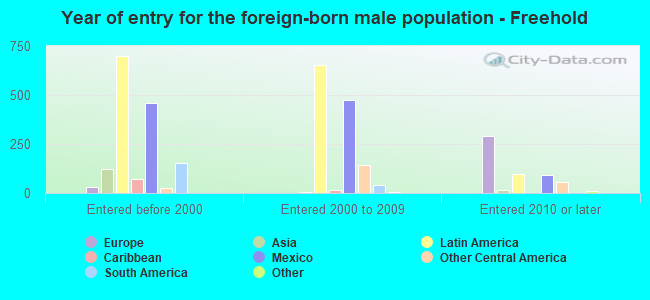
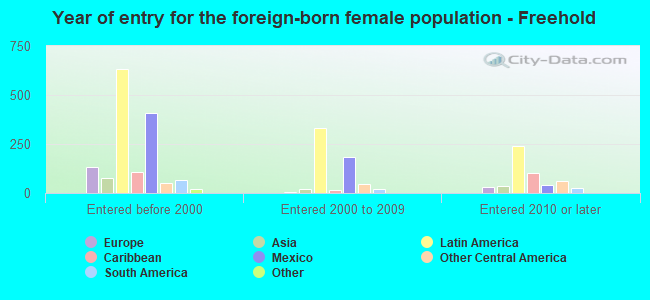
According to 2022 data, the most numerous races in Freehold, NJ are White alone (4,812 residents), Hispanic (5,830 residents), and Black alone (1,280 residents). 53.5% of Freehold residents speak English at home. 28.8% of Freehold, NJ residents are foreign-born (23.3% born in Latin America), which is 20.2% greater than the foreign-born rate of 23.0% across the entire state of New Jersey.
Race distribution in Freehold
2000 2022
5,557,209 66.0% White alone 1,117,191 13.3% Hispanic 1,096,171 13.0% Black alone 477,012 5.7% Asian alone 133,689 1.6% Two or more races 19,565 0.2% Other race alone 11,338 0.1% American Indian alone 2,175 0.03% Native Hawaiian and Other
4,766,476 51.5% White alone 2,028,470 21.9% Hispanic 1,111,632 12.0% Black alone 923,546 10.0% Asian alone 332,237 3.6% Two or more races 89,847 1.0% Other race alone 8,557 0.09% American Indian alone 934 0.01% Native Hawaiian and Other
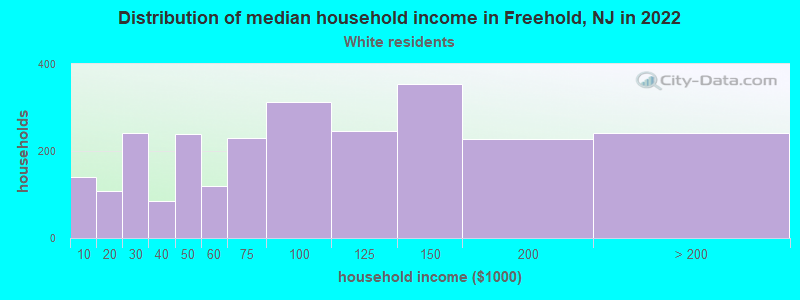
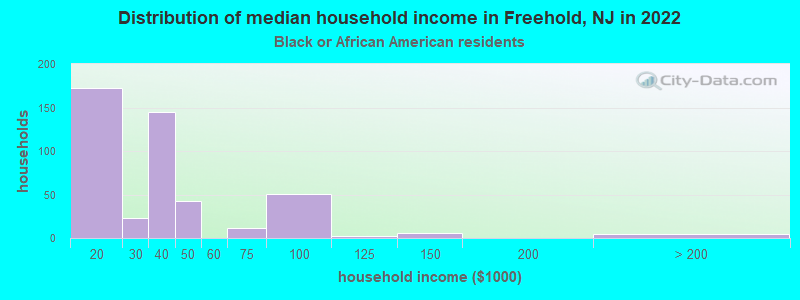
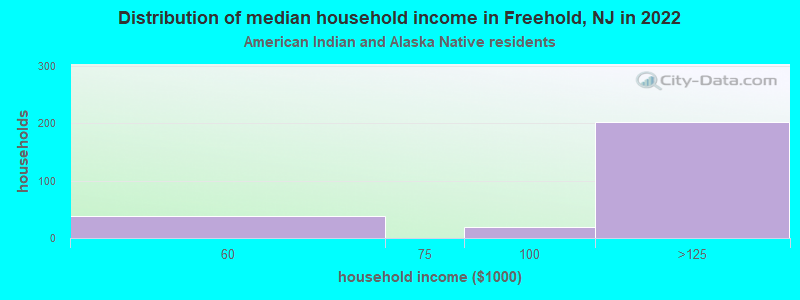
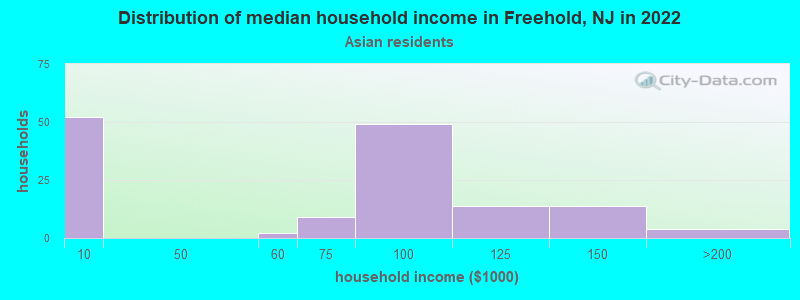
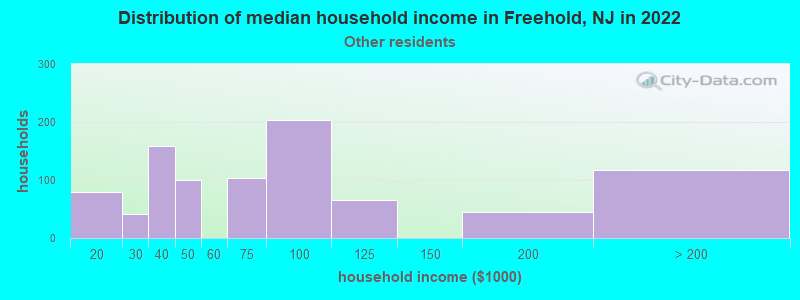
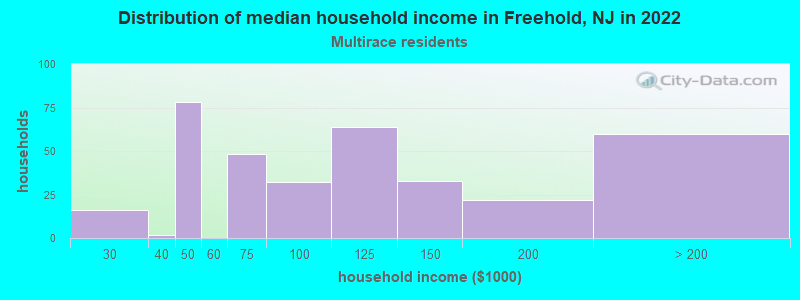
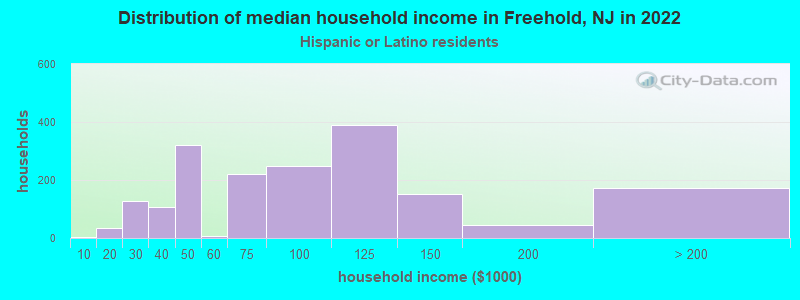
Income and house value in Freehold Median household income in 2022 $91,656 White non-Hispanic householders$24,152 Black householders$105,929 American Indian and Alaska Native householders$73,330 Asian householders$71,400 Some other race householders$89,088 Two or more races householders$93,100 Hispanic or Latino race householdersMedian 2022 house value $416,859 White Non-Hispanic householders$333,309 Black or African American householders$111,103 American Indian or Alaska Native householders $282,943 Asian householders$376,566 Some other race householders$280,276 Two or more races householders$447,376 Hispanic or Latino householders
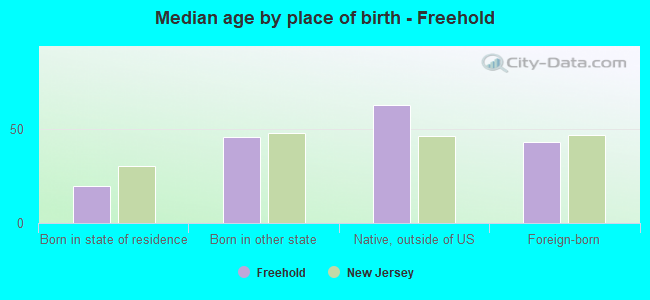
Median age by race in Freehold
40.0 Median age for White residents39.4 41.9 27.3 Median age for Black or African American residents26.8 24.9 31.7 Median age for American Indian / Alaska Native residents24.6 28.5 52.1 Median age for Asian residents61.2 47.9 -804,177,544.9 Median age for Native Hawaiian / Pacific Islander residents-860,335,194.7 -713,070,378.3 27.9 Median age for Other race residents35.8 25.4 30.6 Median age for Two or more races residents28.2 29.8 44.4 Median age for White alone residents42.9 46.1 30.4 Median age for Hispanic or Latino residents28.5 31.3
Owner/renter occupied households by race in Freehold
House owners and renters - White residents 1,701 67.6% Owner occupied816 32.4% Renter occupiedHouse owners and renters - Black or African American residents 168 30.7% Owner occupied378 69.3% Renter occupiedHouse owners and renters - American Indian / Alaska Native residents 22 5.9% Owner occupied348 94.1% Renter occupiedHouse owners and renters - Asian residents 95 73.5% Owner occupied34 26.5% Renter occupiedHouse owners and renters - Other race residents 261 28.1% Owner occupied668 71.9% Renter occupiedHouse owners and renters - Two or more races residents 165 45.1% Owner occupied201 54.9% Renter occupiedHouse owners and renters - White alone residents 1,509 77.0% Owner occupied450 23.0% Renter occupiedHouse owners and renters - Hispanic or Latino residents 457 26.3% Owner occupied1,280 73.7% Renter occupied
Language usage in Freehold
English speakers - Total 53.5% of residents of Freehold speak English at home.
37.4% of residents speak Spanish at home 2,294 51.3% Speak English very well2,177 48.7% Speak English less than very well5.3% of residents speak other language at home 353 55.3% Speak English very well285 44.7% Speak English less than very well
English speakers - Born in the United States 86.4% of residents of Freehold speak English at home.
11.5% of residents speak Spanish at home 176 78.9% Speak English very well47 21.1% Speak English less than very well1.3% of residents speak other language at home 26 100.0% Speak English very well
English speakers - Native, born elsewhere 30.4% of residents of Freehold speak English at home.
68.3% of residents speak Spanish at home 120 39.0% Speak English very well188 61.0% Speak English less than very well3.1% of residents speak other language at home 14 100.0% Speak English very well
English speakers - Foreign-born 9.2% of residents of Freehold speak English at home.
73.0% of residents speak Spanish at home 607 23.1% Speak English very well2,020 76.9% Speak English less than very well14.2% of residents speak other language at home 237 46.2% Speak English very well276 53.8% Speak English less than very well
White (Caucasian) - Speak only English Native:
80.3% (4,001)Foreign-born:
13.6% (123)
White (Caucasian) - Speak another language Native:
16.5% (824)Foreign-born:
87.1% (787)
Black or African American - Speak only English Native:
98.0% (1,180)Foreign-born:
48.7% (54)
Asian - Speak only English Native:
42.9% (29)Foreign-born:
3.4% (7)
Asian - Speak another language Native:
59.5% (40)Foreign-born:
100.0% (216)
Other race - Speak only English Native:
14.5% (259)Foreign-born:
13.1% (185)
Other race - Speak another language Native:
71.8% (1,283)Foreign-born:
86.7% (1,222)
Two or more races - Speak only English Native:
62.4% (620)Foreign-born:
8.4% (41)
Two or more races - Speak another language Native:
32.6% (324)Foreign-born:
93.1% (458)
White alone - Speak only English Native:
87.6% (3,800)Foreign-born:
31.3% (95)
White alone - Speak another language Native:
11.8% (510)Foreign-born:
68.5% (209)
Hispanic or Latino - Speak only English Native:
29.3% (746)Foreign-born:
6.8% (191)
Hispanic or Latino - Speak another language Native:
65.2% (1,659)Foreign-born:
91.4% (2,552)
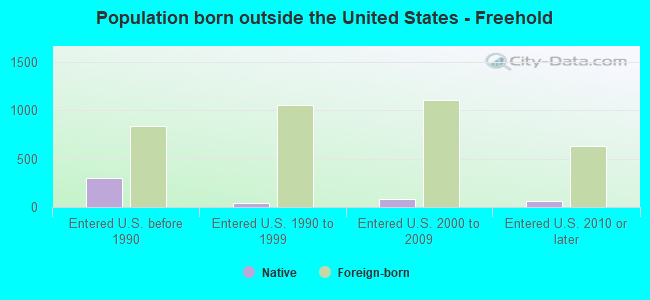
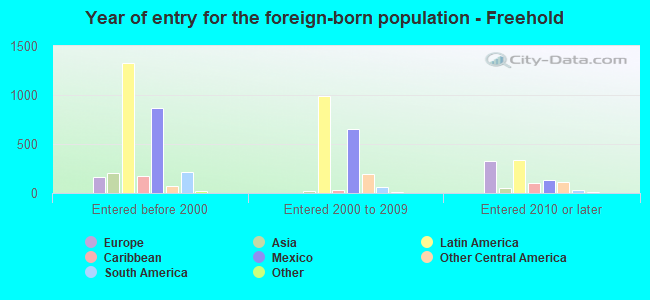
Foreign-born residents in Freehold 3,607 residents are foreign born (23.3% Latin America ).
This city:
28.8%New Jersey:
23.2%
Marital status for residents in Freehold Marital status - White (Caucasian) population 15 years and over
Males 31.1% Never married58.3% Now married0.7% Separated3.8% Widowed6.1% DivorcedFemales 30.8% Never married42.5% Now married0.5% Separated15.5% Widowed10.7% DivorcedWomen who gave birth in the past 12 months Now married:
27.6% (33)Unmarried:
72.4% (86)
Women who did not give birth in the past 12 months Now married:
38.0% (519)Unmarried:
62.0% (845)
Marital status - Black or African American population 15 years and over
Males 54.4% Never married20.2% Now married4.2% Separated0.4% Widowed20.7% DivorcedFemales 81.0% Never married7.9% Now married4.6% Separated5.4% Widowed1.1% DivorcedWomen who gave birth in the past 12 months Now married:
0.0% (0)Unmarried:
100.0% (4)
Women who did not give birth in the past 12 months Now married:
13.0% (69)Unmarried:
87.0% (463)
Marital status - American Indian / Alaska Native population 15 years and over
Males 28.9% Never married71.1% Now married0.0% Separated0.0% Widowed0.0% DivorcedFemales 7.2% Never married92.8% Now married0.0% Separated0.0% Widowed0.0% DivorcedWomen who did not give birth in the past 12 months Now married:
92.8% (320)Unmarried:
7.2% (25)
Marital status - Asian population 15 years and over
Males 21.7% Never married78.3% Now married0.0% Separated0.0% Widowed0.0% DivorcedFemales 36.8% Never married55.3% Now married0.0% Separated6.6% Widowed1.3% DivorcedWomen who did not give birth in the past 12 months Now married:
30.9% (26)Unmarried:
69.1% (58)
Marital status - Other race population 15 years and over
Males 36.2% Never married34.5% Now married3.2% Separated12.4% Widowed13.7% DivorcedFemales 50.3% Never married30.2% Now married4.5% Separated0.0% Widowed15.0% DivorcedWomen who gave birth in the past 12 months Now married:
100.0% (28)Unmarried:
0.0% (0)
Women who did not give birth in the past 12 months Now married:
33.9% (264)Unmarried:
66.1% (516)
Marital status - Two or more races population 15 years and over
Males 50.3% Never married39.7% Now married2.6% Separated0.0% Widowed7.3% DivorcedFemales 50.2% Never married41.2% Now married0.0% Separated4.5% Widowed4.1% DivorcedWomen who gave birth in the past 12 months Now married:
95.5% (90)Unmarried:
4.5% (4)
Women who did not give birth in the past 12 months Now married:
19.7% (68)Unmarried:
80.3% (279)
Marital status - White alone, not Hispanic / Latino population 15 years and over
Males 24.5% Never married62.3% Now married0.4% Separated5.3% Widowed7.4% DivorcedFemales 26.0% Never married47.5% Now married0.6% Separated16.7% Widowed9.2% DivorcedWomen who gave birth in the past 12 months Now married:
42.7% (34)Unmarried:
57.3% (46)
Women who did not give birth in the past 12 months Now married:
43.6% (439)Unmarried:
56.4% (567)
Marital status - Hispanic or Latino population 15 years and over
Males 39.2% Never married47.8% Now married2.0% Separated3.9% Widowed7.1% DivorcedFemales 43.3% Never married39.4% Now married1.5% Separated4.0% Widowed11.8% DivorcedWomen who gave birth in the past 12 months Now married:
62.8% (84)Unmarried:
37.2% (50)
Women who did not give birth in the past 12 months Now married:
39.0% (546)Unmarried:
61.0% (856)
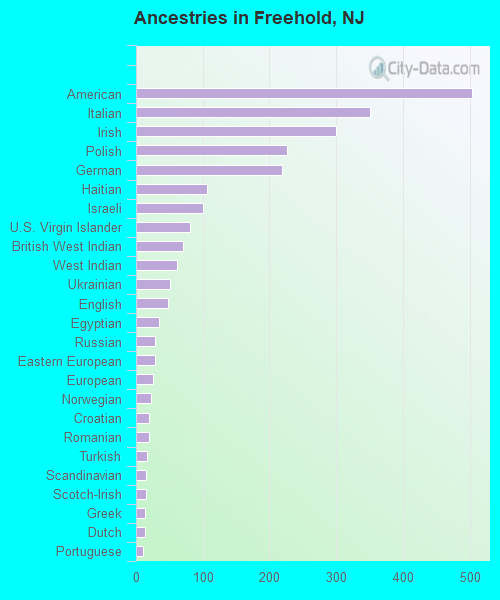
Ancestries in Freehold
504 6.4% American351 4.4% Italian300 3.8% Irish226 2.9% Polish219 2.8% German106 1.3% Haitian100 1.3% Israeli81 1.0% U.S. Virgin Islander70 0.9% British West Indian62 0.8% West Indian51 0.6% Ukrainian48 0.6% English34 0.4% Egyptian29 0.4% Russian28 0.4% Eastern European26 0.3% European22 0.3% Norwegian20 0.3% Croatian19 0.2% Romanian16 0.2% Turkish15 0.2% Scandinavian15 0.2% Scotch-Irish14 0.2% Greek13 0.2% Dutch11 0.1% Portuguese11 0.1% Scottish8 0.1% British8 0.1% French5 0.06% French Canadian3 0.04% Lebanese
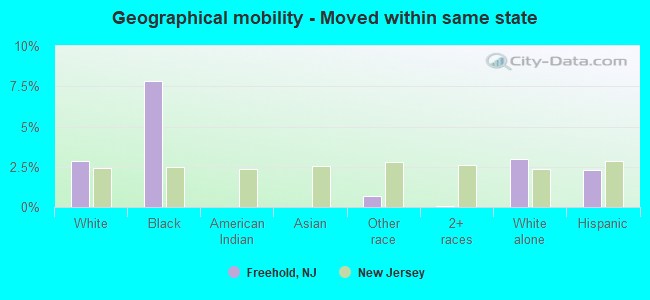
Geographical mobility in Freehold Same house 1 year ago 5,743 92.7% White (Caucasian)1,273 94.5% Black or African American1,164 96.6% American Indian / Alaska Native279 99.8% Asian3,467 100.0% Other race1,338 90.6% Two or more races4,502 93.6% White alone, not Hispanic / Latino5,378 94.8% Hispanic or LatinoMoved within same county 165 2.7% White / Caucasian14 1.0% Black or African American4 0.1% Other race72 4.9% Two or more races72 1.5% White alone, not Hispanic / Latino93 1.6% Hispanic or LatinoMoved within same state 176 2.8% White / Caucasian105 7.8% Black or African American23 0.7% Other race1 0.1% Two or more races142 3.0% White alone, not Hispanic / Latino132 2.3% Hispanic or LatinoMoved from different state 47 0.8% White / Caucasian39 2.7% Two or more races40 0.8% White alone, not Hispanic / Latino39 0.7% Hispanic or LatinoMoved from abroad 35 0.6% White2 0.8% Asian48 1.4% Other race21 1.4% Two or more races83 1.7% White alone, not Hispanic / Latino87 1.5% Hispanic or Latino
Children Nativity (place of birth) in Freehold
Children under 6 years - Living with two parents Both parents native 245 100.0% NativeBoth parents foreign-born 299 96.3% Native11 3.7% Foreign-bornOne native, one foreign-born parent 4 100.0% NativeChildren under 6 years - Living with one parent Native parent 107 100.0% NativeForeign-born parent 79 79.8% Native20 20.2% Foreign-bornChildren 6 to 17 years - Living with two parents Both parents native 361 100.0% NativeBoth parents foreign-born 396 100.0% NativeOne native, one foreign-born parent 251 100.0% NativeChildren 6 to 17 years - Living with one parent Native parent 391 100.0% NativeForeign-born parent 717 52.4% Native651 47.6% Foreign-born
Grandparents responsible for own grandchildren in Freehold
Grandparents (30 to 59 years) White / Caucasian 12 34.7% Responsible for grandchildren22 65.3% Not responsible for grandchildrenBlack or African American 8 100.0% Not responsible for grandchildrenOther race 66 100.0% Responsible for grandchildrenWhite alone, not Hispanic / Latino 4 46.0% Responsible for grandchildren4 54.0% Not responsible for grandchildrenHispanic or Latino 54 69.4% Responsible for grandchildren24 30.6% Not responsible for grandchildrenGrandparents (60 years and over) White / Caucasian 7 10.6% Responsible for grandchildren57 89.4% Not responsible for grandchildrenBlack or African American 25 100.0% Not responsible for grandchildrenWhite alone, not Hispanic / Latino 7 10.7% Responsible for grandchildren56 89.3% Not responsible for grandchildren