Races in Freeport, New York (NY) Detailed Stats
Data:
Races - White alone (%)
Races - White alone (% change since 2000)
Races - Black alone (%)
Races - Black alone (% change since 2000)
Races - American Indian alone (%)
Races - American Indian alone (% change since 2000)
Races - Asian alone (%)
Races - Asian alone (% change since 2000)
Races - Hispanic (%)
Races - Hispanic (% change since 2000)
Races - Native Hawaiian and Other Pacific Islander alone (%)
Races - Native Hawaiian and Other Pacific Islander alone (% change since 2000)
Races - Two or more races(%)
Races - Two or more races(% change since 2000)
Races - Other race alone (%)
Races - Other race alone (% change since 2000)
Racial diversity
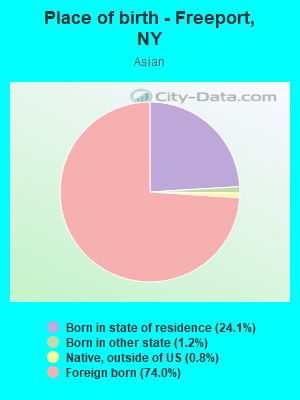
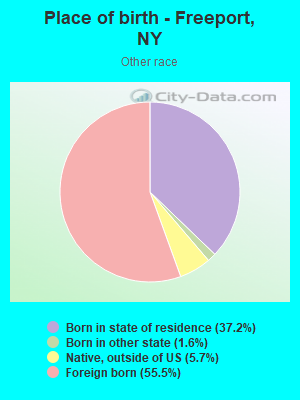
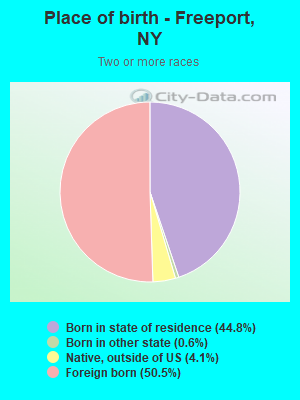
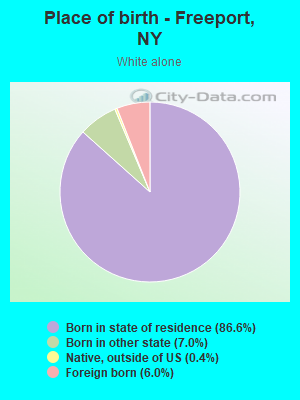
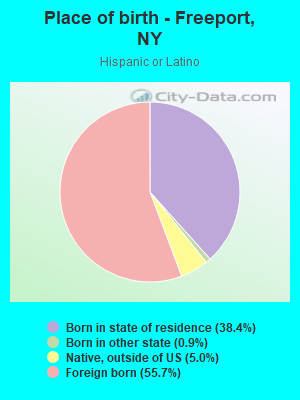
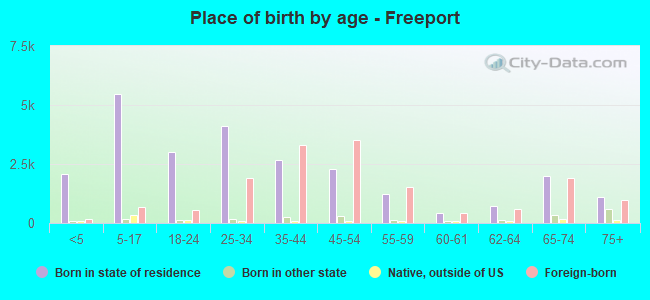
Place of birth - Born in state of residence (%)
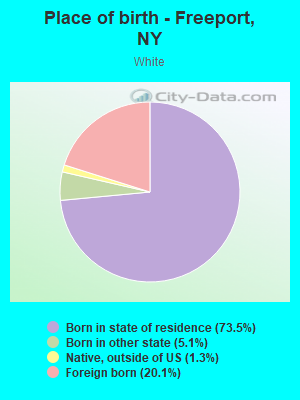
Place of birth - Born in state of residence (%) - White
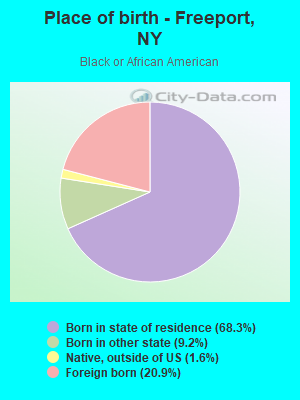
Place of birth - Born in state of residence (%) - Black or African American
Place of birth - Born in state of residence (%) - Asian
Place of birth - Born in state of residence (%) - Hispanic or Latino
Place of birth - Born in state of residence (%) - American Indian and Alaska Native
Place of birth - Born in state of residence (%) - Multirace
Place of birth - Born in state of residence (%) - Other Race
Place of birth - Born in other state (%)
Place of birth - Born in other state (%) - White
Place of birth - Born in other state (%) - Black or African American
Place of birth - Born in other state (%) - Asian
Place of birth - Born in other state (%) - Hispanic or Latino
Place of birth - Born in other state (%) - American Indian and Alaska Native
Place of birth - Born in other state (%) - Multirace
Place of birth - Born in other state (%) - Other Race
Place of birth - Native, outside of US (%)
Place of birth - Native, outside of US (%) - White
Place of birth - Native, outside of US (%) - Black or African American
Place of birth - Native, outside of US (%) - Asian
Place of birth - Native, outside of US (%) - Hispanic or Latino
Place of birth - Native, outside of US (%) - American Indian and Alaska Native
Place of birth - Native, outside of US (%) - Multirace
Place of birth - Native, outside of US (%) - Other Race
Place of birth - Foreign born (%)
Place of birth - Foreign born (%) - White
Place of birth - Foreign born (%) - Black or African American
Place of birth - Foreign born (%) - Asian
Place of birth - Foreign born (%) - Hispanic or Latino
Place of birth - Foreign born (%) - American Indian and Alaska Native
Place of birth - Foreign born (%) - Multirace
Place of birth - Foreign born (%) - Other Race
Residents speaking English at home (%)
Residents speaking English at home - Born in the United States (%)
Residents speaking English at home - Native, born elsewhere (%)
Residents speaking English at home - Foreign born (%)
Residents speaking Spanish at home (%)
Residents speaking Spanish at home - Born in the United States (%)
Residents speaking Spanish at home - Native, born elsewhere (%)
Residents speaking Spanish at home - Foreign born (%)
Residents speaking other language at home (%)
Residents speaking other language at home - Born in the United States (%)
Residents speaking other language at home - Native, born elsewhere (%)
Residents speaking other language at home - Foreign born (%)
Marital status - Never married (%)
Marital status - Now married (%)
Marital status - Separated (%)
Marital status - Widowed (%)
Marital status - Divorced (%)
Ancestries Reported - Arab (%)
Ancestries Reported - Czech (%)
Ancestries Reported - Danish (%)
Ancestries Reported - Dutch (%)
Ancestries Reported - English (%)
Ancestries Reported - French (%)
Ancestries Reported - French Canadian (%)
Ancestries Reported - German (%)
Ancestries Reported - Greek (%)
Ancestries Reported - Hungarian (%)
Ancestries Reported - Irish (%)
Ancestries Reported - Italian (%)
Ancestries Reported - Lithuanian (%)
Ancestries Reported - Norwegian (%)
Ancestries Reported - Polish (%)
Ancestries Reported - Portuguese (%)
Ancestries Reported - Russian (%)
Ancestries Reported - Scotch-Irish (%)
Ancestries Reported - Scottish (%)
Ancestries Reported - Slovak (%)
Ancestries Reported - Subsaharan African (%)
Ancestries Reported - Swedish (%)
Ancestries Reported - Swiss (%)
Ancestries Reported - Ukrainian (%)
Ancestries Reported - United States (%)
Ancestries Reported - Welsh (%)
Ancestries Reported - West Indian (%)
Ancestries Reported - Other (%)
Geographical mobility - Same house 1 year ago (%)
Geographical mobility - Same house 1 year ago (%) - White
Geographical mobility - Same house 1 year ago (%) - Black or African American
Geographical mobility - Same house 1 year ago (%) - Asian
Geographical mobility - Same house 1 year ago (%) - Hispanic or Latino
Geographical mobility - Same house 1 year ago (%) - American Indian and Alaska Native
Geographical mobility - Same house 1 year ago (%) - Multirace
Geographical mobility - Same house 1 year ago (%) - Other Race
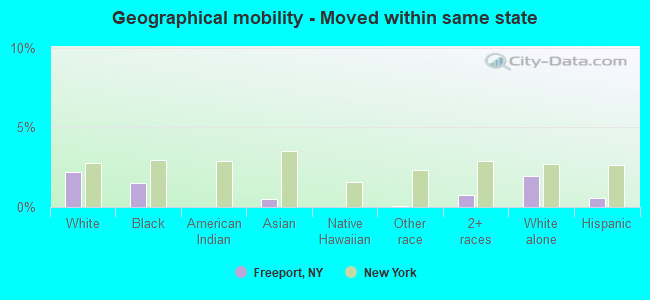
Geographical mobility - Moved within same county (%)
Geographical mobility - Moved within same county (%) - White
Geographical mobility - Moved within same county (%) - Black or African American
Geographical mobility - Moved within same county (%) - Asian
Geographical mobility - Moved within same county (%) - Hispanic or Latino
Geographical mobility - Moved within same county (%) - American Indian and Alaska Native
Geographical mobility - Moved within same county (%) - Multirace
Geographical mobility - Moved within same county (%) - Other Race
Geographical mobility - Moved from different county within same state (%)
Geographical mobility - Moved from different county within same state (%) - White
Geographical mobility - Moved from different county within same state (%) - Black or African American
Geographical mobility - Moved from different county within same state (%) - Asian
Geographical mobility - Moved from different county within same state (%) - Hispanic or Latino
Geographical mobility - Moved from different county within same state (%) - American Indian and Alaska Native
Geographical mobility - Moved from different county within same state (%) - Multirace
Geographical mobility - Moved from different county within same state (%) - Other Race
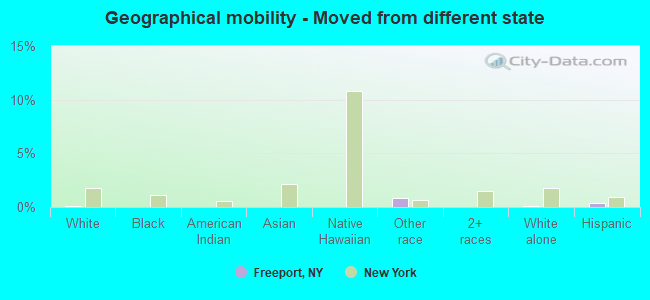
Geographical mobility - Moved from different state (%)
Geographical mobility - Moved from different state (%) - White
Geographical mobility - Moved from different state (%) - Black or African American
Geographical mobility - Moved from different state (%) - Asian
Geographical mobility - Moved from different state (%) - Hispanic or Latino
Geographical mobility - Moved from different state (%) - American Indian and Alaska Native
Geographical mobility - Moved from different state (%) - Multirace
Geographical mobility - Moved from different state (%) - Other Race
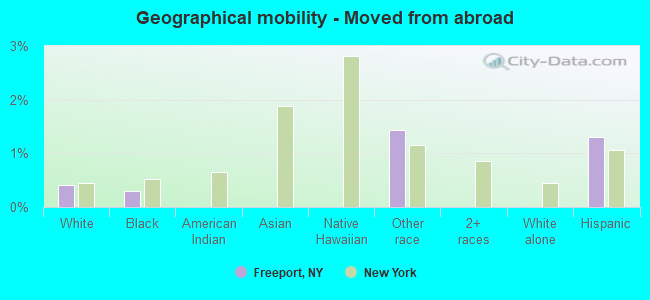
Geographical mobility - Moved from abroad (%)
Geographical mobility - Moved from abroad (%) - White
Geographical mobility - Moved from abroad (%) - Black or African American
Geographical mobility - Moved from abroad (%) - Asian
Geographical mobility - Moved from abroad (%) - Hispanic or Latino
Geographical mobility - Moved from abroad (%) - American Indian and Alaska Native
Geographical mobility - Moved from abroad (%) - Multirace
Geographical mobility - Moved from abroad (%) - Other Race
Place of birth for the foreign-born population - Ireland (%)
Place of birth for the foreign-born population - Denmark (%)
Place of birth for the foreign-born population - Norway (%)
Place of birth for the foreign-born population - Sweden (%)
Place of birth for the foreign-born population - United Kingdom (%)
Place of birth for the foreign-born population - England (%)
Place of birth for the foreign-born population - Scotland (%)
Place of birth for the foreign-born population - Other Northern Europe (%)
Place of birth for the foreign-born population - Austria (%)
Place of birth for the foreign-born population - Belgium (%)
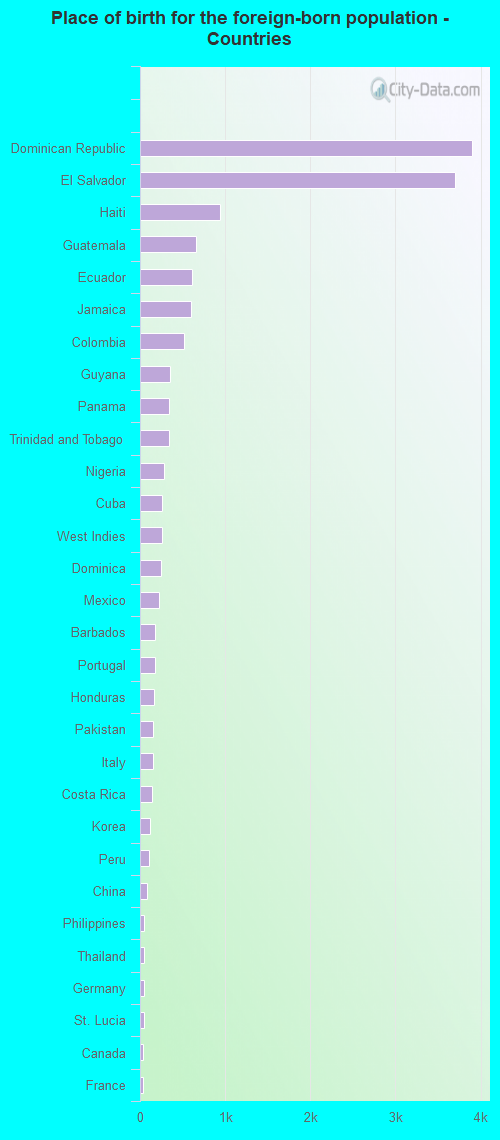
Place of birth for the foreign-born population - France (%)
Place of birth for the foreign-born population - Germany (%)
Place of birth for the foreign-born population - Netherlands (%)
Place of birth for the foreign-born population - Switzerland (%)
Place of birth for the foreign-born population - Other Western Europe (%)
Place of birth for the foreign-born population - Greece (%)
Place of birth for the foreign-born population - Italy (%)
Place of birth for the foreign-born population - Portugal (%)
Place of birth for the foreign-born population - Spain (%)
Place of birth for the foreign-born population - Other Southern Europe (%)
Place of birth for the foreign-born population - Albania (%)
Place of birth for the foreign-born population - Belarus (%)
Place of birth for the foreign-born population - Bosnia and Herzegovina (%)
Place of birth for the foreign-born population - Bulgaria (%)
Place of birth for the foreign-born population - Croatia (%)
Place of birth for the foreign-born population - Czechoslovakia (%)
Place of birth for the foreign-born population - Hungary (%)
Place of birth for the foreign-born population - Latvia (%)
Place of birth for the foreign-born population - Lithuania (%)
Place of birth for the foreign-born population - North Macedonia (Macedonia) (%)
Place of birth for the foreign-born population - Moldova (%)
Place of birth for the foreign-born population - Poland (%)
Place of birth for the foreign-born population - Romania (%)
Place of birth for the foreign-born population - Russia (%)
Place of birth for the foreign-born population - Serbia (%)
Place of birth for the foreign-born population - Ukraine (%)
Place of birth for the foreign-born population - Other Eastern Europe (%)
Place of birth for the foreign-born population - China (%)
Place of birth for the foreign-born population - Hong Kong (%)
Place of birth for the foreign-born population - Taiwan (%)
Place of birth for the foreign-born population - Japan (%)
Place of birth for the foreign-born population - Korea (%)
Place of birth for the foreign-born population - Other Eastern Asia (%)
Place of birth for the foreign-born population - Afghanistan (%)
Place of birth for the foreign-born population - Bangladesh (%)
Place of birth for the foreign-born population - India (%)
Place of birth for the foreign-born population - Iran (%)
Place of birth for the foreign-born population - Kazakhstan (%)
Place of birth for the foreign-born population - Nepal (%)
Place of birth for the foreign-born population - Pakistan (%)
Place of birth for the foreign-born population - Sri Lanka (%)
Place of birth for the foreign-born population - Uzbekistan (%)
Place of birth for the foreign-born population - Other South Central Asia (%)
Place of birth for the foreign-born population - Burma (%)
Place of birth for the foreign-born population - Cambodia (%)
Place of birth for the foreign-born population - Indonesia (%)
Place of birth for the foreign-born population - Laos (%)
Place of birth for the foreign-born population - Malaysia (%)
Place of birth for the foreign-born population - Philippines (%)
Place of birth for the foreign-born population - Singapore (%)
Place of birth for the foreign-born population - Thailand (%)
Place of birth for the foreign-born population - Vietnam (%)
Place of birth for the foreign-born population - Other South Eastern Asia (%)
Place of birth for the foreign-born population - Armenia (%)
Place of birth for the foreign-born population - Iraq (%)
Place of birth for the foreign-born population - Israel (%)
Place of birth for the foreign-born population - Jordan (%)
Place of birth for the foreign-born population - Kuwait (%)
Place of birth for the foreign-born population - Lebanon (%)
Place of birth for the foreign-born population - Saudi Arabia (%)
Place of birth for the foreign-born population - Syria (%)
Place of birth for the foreign-born population - Turkey (%)
Place of birth for the foreign-born population - Yemen (%)
Place of birth for the foreign-born population - Other Western Asia (%)
Place of birth for the foreign-born population - Eritrea (%)
Place of birth for the foreign-born population - Ethiopia (%)
Place of birth for the foreign-born population - Kenya (%)
Place of birth for the foreign-born population - Somalia (%)
Place of birth for the foreign-born population - Uganda (%)
Place of birth for the foreign-born population - Zimbabwe (%)
Place of birth for the foreign-born population - Other Eastern Africa (%)
Place of birth for the foreign-born population - Cameroon (%)
Place of birth for the foreign-born population - Congo (%)
Place of birth for the foreign-born population - Democratic Republic of Congo (Zaire) (%)
Place of birth for the foreign-born population - Other Middle Africa (%)
Place of birth for the foreign-born population - Egypt (%)
Place of birth for the foreign-born population - Morocco (%)
Place of birth for the foreign-born population - Sudan (%)
Place of birth for the foreign-born population - Other Northern Africa (%)
Place of birth for the foreign-born population - South Africa (%)
Place of birth for the foreign-born population - Other Southern Africa (%)
Place of birth for the foreign-born population - Cabo Verde (%)
Place of birth for the foreign-born population - Ghana (%)
Place of birth for the foreign-born population - Liberia (%)
Place of birth for the foreign-born population - Nigeria (%)
Place of birth for the foreign-born population - Senegal (%)
Place of birth for the foreign-born population - Sierra Leone (%)
Place of birth for the foreign-born population - Other Western Africa (%)
Place of birth for the foreign-born population - Australia (%)
Place of birth for the foreign-born population - New Zealand (%)
Place of birth for the foreign-born population - Fiji (%)
Place of birth for the foreign-born population - Micronesia (%)
Place of birth for the foreign-born population - Bahamas (%)
Place of birth for the foreign-born population - Barbados (%)
Place of birth for the foreign-born population - Cuba (%)
Place of birth for the foreign-born population - Dominica (%)
Place of birth for the foreign-born population - Dominican Republic (%)
Place of birth for the foreign-born population - Grenada (%)
Place of birth for the foreign-born population - Haiti (%)
Place of birth for the foreign-born population - Jamaica (%)
Place of birth for the foreign-born population - St. Vincent and the Grenadines (%)
Place of birth for the foreign-born population - Trinidad and Tobago (%)
Place of birth for the foreign-born population - West Indies (%)
Place of birth for the foreign-born population - Other Caribbean (%)
Place of birth for the foreign-born population - Belize (%)
Place of birth for the foreign-born population - Costa Rica (%)
Place of birth for the foreign-born population - El Salvador (%)
Place of birth for the foreign-born population - Guatemala (%)
Place of birth for the foreign-born population - Honduras (%)
Place of birth for the foreign-born population - Mexico (%)
Place of birth for the foreign-born population - Nicaragua (%)
Place of birth for the foreign-born population - Panama (%)
Place of birth for the foreign-born population - Other Central America (%)
Place of birth for the foreign-born population - Argentina (%)
Place of birth for the foreign-born population - Bolivia (%)
Place of birth for the foreign-born population - Brazil (%)
Place of birth for the foreign-born population - Chile (%)
Place of birth for the foreign-born population - Colombia (%)
Place of birth for the foreign-born population - Ecuador (%)
Place of birth for the foreign-born population - Guyana (%)
Place of birth for the foreign-born population - Peru (%)
Place of birth for the foreign-born population - Uruguay (%)
Place of birth for the foreign-born population - Venezuela (%)
Place of birth for the foreign-born population - Other South America (%)
Place of birth for the foreign-born population - Canada (%)
Place of birth for the foreign-born population - Other Northern America (%)
Place of birth for the foreign-born population - Other (%)
Latest news about races in Freeport, NY collected exclusively by city-data.com from local newspapers, TV, and radio stations
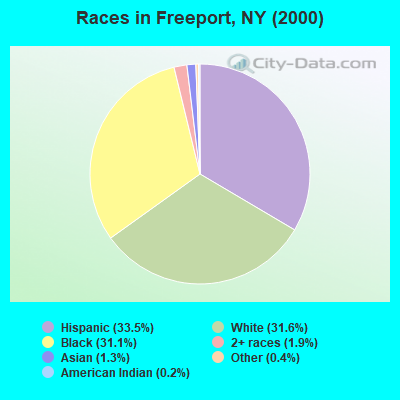
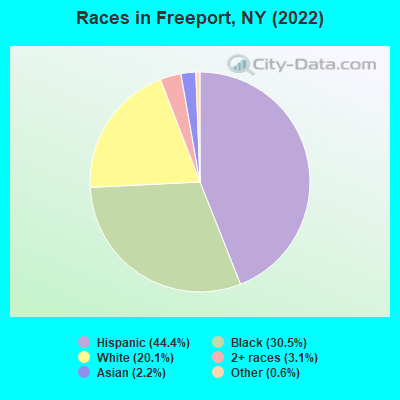
According to 2022 data, the most numerous races in Freeport, NY are White alone (8,839 residents), Hispanic (19,552 residents), and Black alone (13,448 residents). 54.9% of Freeport residents speak English at home. 34.7% of Freeport, NY residents are foreign-born (31.5% born in Latin America), which is 36.5% greater than the foreign-born rate of 22.0% across the entire state of New York.
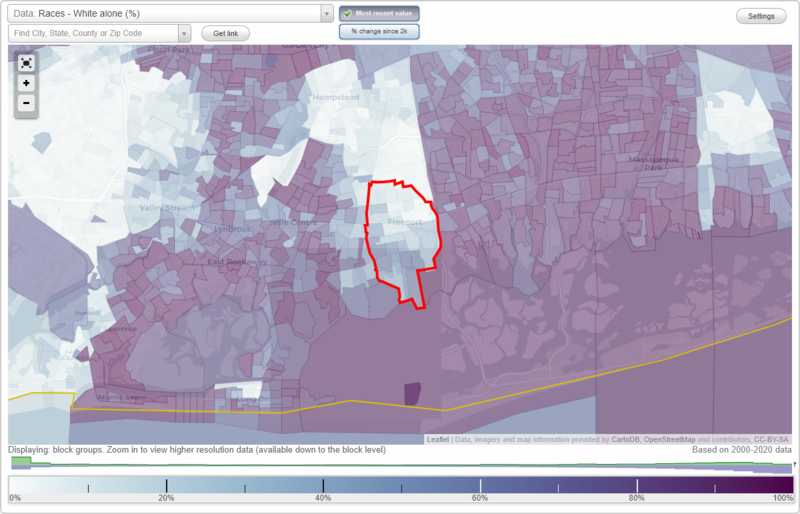
Race distribution in Freeport
2000 2022
11,760,981 62.0% White alone 2,867,583 15.1% Hispanic 2,812,623 14.8% Black alone 1,035,926 5.5% Asian alone 366,116 1.9% Two or more races 75,499 0.4% Other race alone 52,499 0.3% American Indian alone 5,230 0.03% Native Hawaiian and Other
10,408,933 52.9% White alone 3,867,299 19.7% Hispanic 2,633,840 13.4% Black alone 1,776,286 9.0% Asian alone 732,670 3.7% Two or more races 216,110 1.1% Other race alone 35,082 0.2% American Indian alone 6,931 0.04% Native Hawaiian and Other
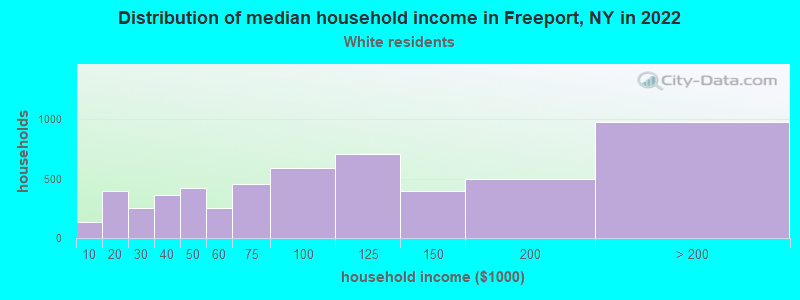
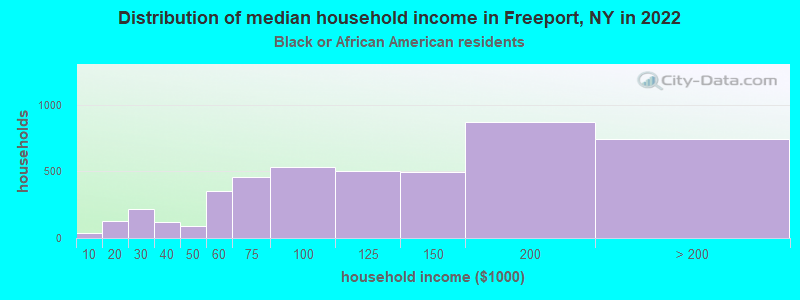
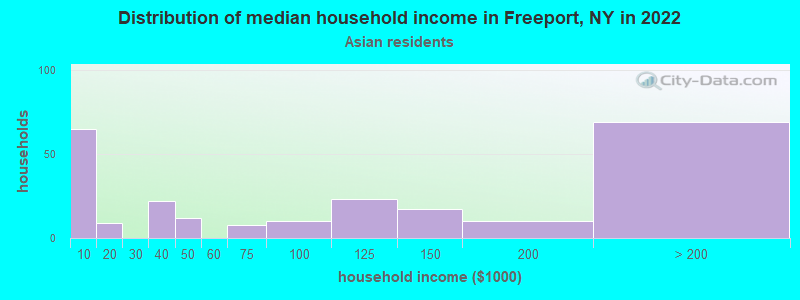
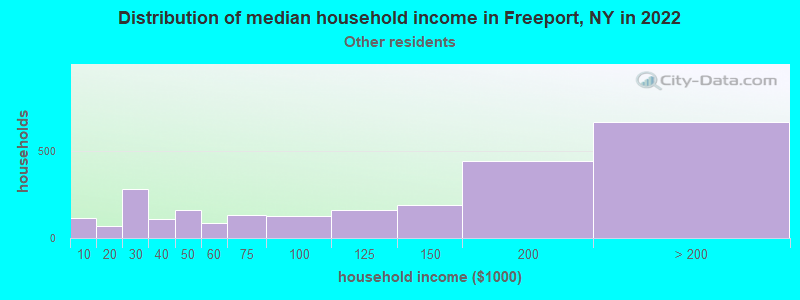
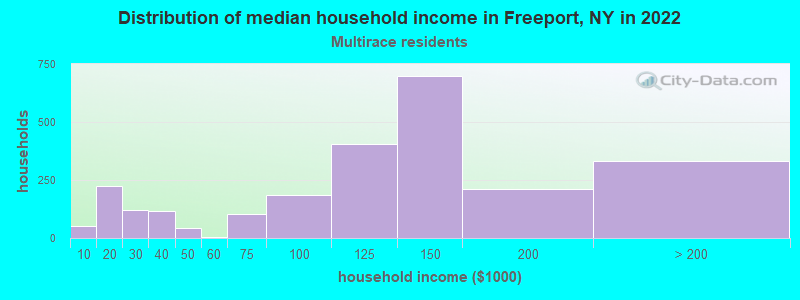
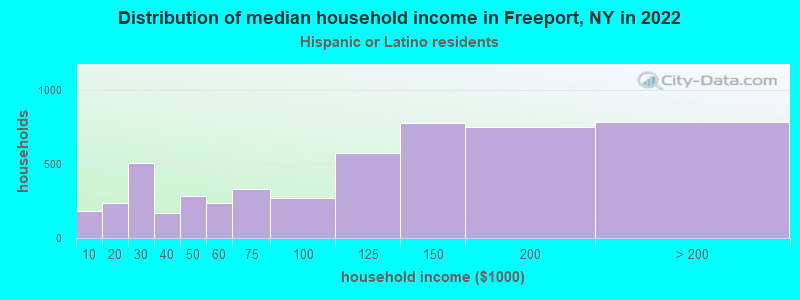
Income and house value in Freeport Median household income in 2022 $102,598 White non-Hispanic householders$119,460 Black householders$111,854 Some other race householders$127,359 Two or more races householders$109,154 Hispanic or Latino race householdersMedian 2022 house value $476,932 White Non-Hispanic householders$454,171 Black or African American householders$457,834 American Indian or Alaska Native householders $490,536 Asian householders$463,851 Some other race householders$496,292 Two or more races householders$476,932 Hispanic or Latino householders
Median age by race in Freeport
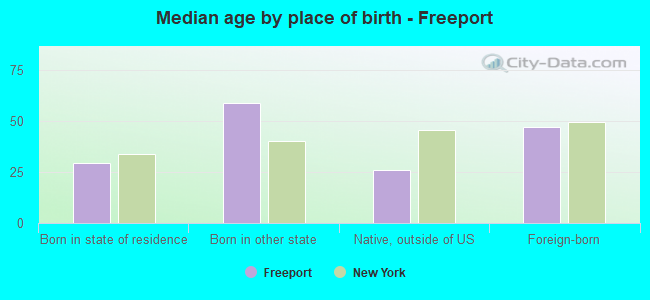
47.7 Median age for White residents47.5 48.8 37.3 Median age for Black or African American residents34.5 40.8 58.9 Median age for American Indian / Alaska Native residents-607,543,322.5 77.3 39.9 Median age for Asian residents55.2 34.2 -487,992,314.6 Median age for Native Hawaiian / Pacific Islander residents-477,502,295.2 -497,387,669.3 34.7 Median age for Other race residents35.6 32.8 40.7 Median age for Two or more races residents40.7 38.6 55.3 Median age for White alone residents52.5 56.5 36.4 Median age for Hispanic or Latino residents36.9 35.8
Owner/renter occupied households by race in Freeport
House owners and renters - White residents 3,959 73.5% Owner occupied1,431 26.5% Renter occupiedHouse owners and renters - Black or African American residents 3,562 80.8% Owner occupied844 19.2% Renter occupiedHouse owners and renters - American Indian / Alaska Native residents 6 100.0% Owner occupiedHouse owners and renters - Asian residents 153 64.6% Owner occupied84 35.4% Renter occupiedHouse owners and renters - Other race residents 1,450 59.8% Owner occupied974 40.2% Renter occupiedHouse owners and renters - Two or more races residents 1,123 45.7% Owner occupied1,335 54.3% Renter occupiedHouse owners and renters - White alone residents 3,414 83.6% Owner occupied672 16.4% Renter occupiedHouse owners and renters - Hispanic or Latino residents 2,391 47.4% Owner occupied2,657 52.6% Renter occupied
Language usage in Freeport
English speakers - Total 54.9% of residents of Freeport speak English at home.
39.0% of residents speak Spanish at home 7,705 47.3% Speak English very well8,594 52.7% Speak English less than very well5.6% of residents speak other language at home 1,659 71.4% Speak English very well663 28.6% Speak English less than very well
English speakers - Born in the United States 89.3% of residents of Freeport speak English at home.
9.5% of residents speak Spanish at home 213 100.0% Speak English very well2.9% of residents speak other language at home 49 75.4% Speak English very well16 24.6% Speak English less than very well
English speakers - Native, born elsewhere 30.2% of residents of Freeport speak English at home.
56.3% of residents speak Spanish at home 440 69.7% Speak English very well191 30.3% Speak English less than very well12.0% of residents speak other language at home 110 82.1% Speak English very well24 17.9% Speak English less than very well
English speakers - Foreign-born 21.0% of residents of Freeport speak English at home.
65.1% of residents speak Spanish at home 2,676 26.3% Speak English very well7,505 73.7% Speak English less than very well9.4% of residents speak other language at home 955 64.9% Speak English very well517 35.1% Speak English less than very well
White (Caucasian) - Speak only English Native:
80.2% (7,728)Foreign-born:
11.1% (283)
White (Caucasian) - Speak another language Native:
16.7% (1,612)Foreign-born:
84.9% (2,158)
Black or African American - Speak only English Native:
91.6% (9,299)Foreign-born:
64.2% (1,830)
Black or African American - Speak another language Native:
8.2% (836)Foreign-born:
35.7% (1,017)
Asian - Speak only English Native:
73.8% (154)Foreign-born:
42.1% (313)
Asian - Speak another language Native:
27.8% (58)Foreign-born:
50.1% (373)
Other race - Speak only English Native:
24.8% (994)Foreign-born:
10.2% (571)
Other race - Speak another language Native:
72.9% (2,922)Foreign-born:
88.9% (4,974)
Two or more races - Speak only English Native:
53.5% (2,067)Foreign-born:
5.8% (243)
Two or more races - Speak another language Native:
49.5% (1,913)Foreign-born:
96.1% (4,053)
White alone - Speak only English Native:
89.7% (7,277)Foreign-born:
57.0% (300)
White alone - Speak another language Native:
9.8% (795)Foreign-born:
42.4% (223)
Hispanic or Latino - Speak only English Native:
27.8% (2,089)Foreign-born:
5.9% (630)
Hispanic or Latino - Speak another language Native:
72.6% (5,445)Foreign-born:
94.1% (10,003)
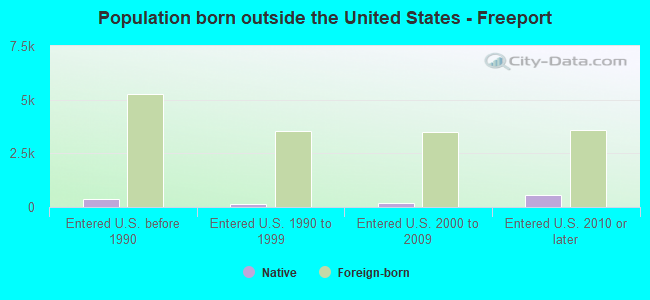
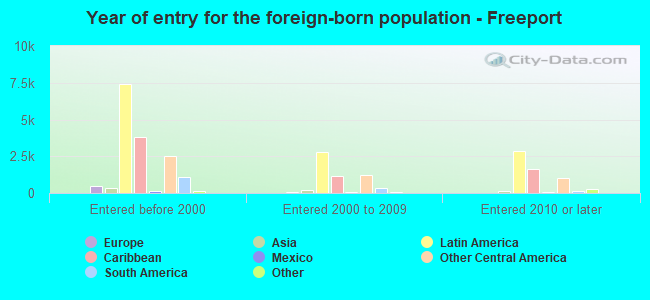
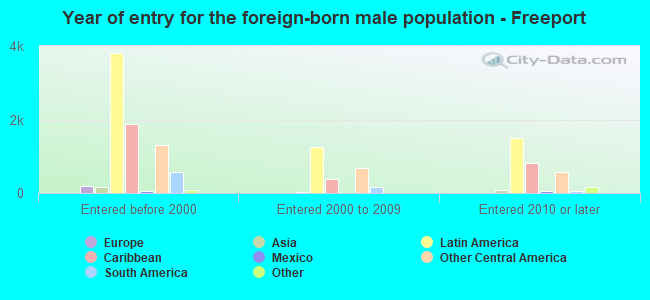
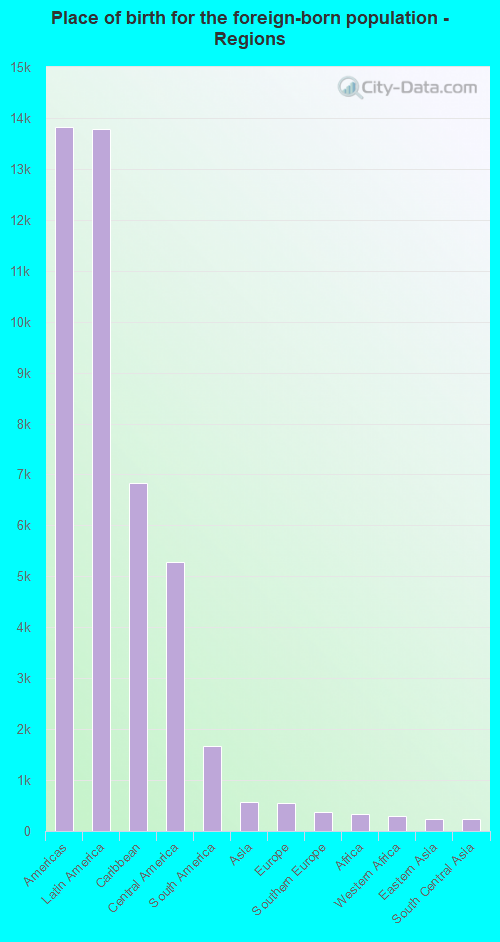
Foreign-born residents in Freeport 15,264 residents are foreign born (31.5% Latin America ).
This city:
34.7%New York:
22.6%
Marital status for residents in Freeport Marital status - White (Caucasian) population 15 years and over
Males 39.3% Never married46.2% Now married2.1% Separated2.1% Widowed10.3% DivorcedFemales 31.8% Never married41.8% Now married2.4% Separated7.7% Widowed16.3% DivorcedWomen who gave birth in the past 12 months Now married:
78.6% (39)Unmarried:
21.4% (11)
Women who did not give birth in the past 12 months Now married:
38.8% (1,042)Unmarried:
61.2% (1,643)
Marital status - Black or African American population 15 years and over
Males 45.7% Never married44.3% Now married2.3% Separated1.6% Widowed6.2% DivorcedFemales 39.5% Never married34.4% Now married3.0% Separated7.1% Widowed16.0% DivorcedWomen who gave birth in the past 12 months Now married:
64.1% (86)Unmarried:
35.9% (48)
Women who did not give birth in the past 12 months Now married:
27.5% (830)Unmarried:
72.5% (2,185)
Marital status - American Indian / Alaska Native population 15 years and over
Males 0.0% Never married100.0% Now married0.0% Separated0.0% Widowed0.0% DivorcedFemales 38.5% Never married0.0% Now married0.0% Separated0.0% Widowed61.5% DivorcedMarital status - Asian population 15 years and over
Males 32.2% Never married46.0% Now married0.0% Separated21.9% Widowed0.0% DivorcedFemales 37.8% Never married33.6% Now married0.0% Separated11.4% Widowed17.2% DivorcedWomen who did not give birth in the past 12 months Now married:
20.5% (55)Unmarried:
79.5% (214)
Marital status - Other race population 15 years and over
Males 45.8% Never married47.4% Now married2.8% Separated0.6% Widowed3.4% DivorcedFemales 44.9% Never married38.4% Now married2.8% Separated5.4% Widowed8.5% DivorcedWomen who gave birth in the past 12 months Now married:
0.0% (0)Unmarried:
100.0% (35)
Women who did not give birth in the past 12 months Now married:
38.5% (1,015)Unmarried:
61.5% (1,621)
Marital status - Two or more races population 15 years and over
Males 49.7% Never married26.4% Now married11.4% Separated3.2% Widowed9.3% DivorcedFemales 31.1% Never married45.7% Now married7.1% Separated5.0% Widowed11.1% DivorcedWomen who gave birth in the past 12 months Now married:
58.8% (30)Unmarried:
41.2% (21)
Women who did not give birth in the past 12 months Now married:
46.2% (1,069)Unmarried:
53.8% (1,242)
Marital status - White alone, not Hispanic / Latino population 15 years and over
Males 36.5% Never married49.7% Now married1.4% Separated2.4% Widowed9.9% DivorcedFemales 23.3% Never married44.4% Now married1.9% Separated10.8% Widowed19.5% DivorcedWomen who gave birth in the past 12 months Now married:
73.3% (31)Unmarried:
26.7% (11)
Women who did not give birth in the past 12 months Now married:
48.1% (698)Unmarried:
51.9% (754)
Marital status - Hispanic or Latino population 15 years and over
Males 46.7% Never married38.9% Now married6.5% Separated1.6% Widowed6.3% DivorcedFemales 42.5% Never married40.5% Now married3.9% Separated3.7% Widowed9.4% DivorcedWomen who gave birth in the past 12 months Now married:
14.5% (11)Unmarried:
85.5% (64)
Women who did not give birth in the past 12 months Now married:
38.4% (1,946)Unmarried:
61.6% (3,128)
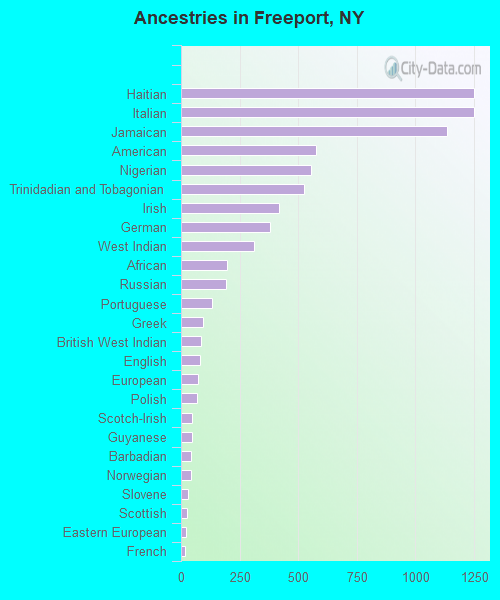
Ancestries in Freeport
1,251 4.7% Haitian1,249 4.7% Italian1,133 4.3% Jamaican576 2.2% American555 2.1% Nigerian524 2.0% Trinidadian and Tobagonian420 1.6% Irish381 1.4% German310 1.2% West Indian195 0.7% African193 0.7% Russian132 0.5% Portuguese93 0.4% Greek84 0.3% British West Indian81 0.3% English71 0.3% European68 0.3% Polish46 0.2% Scotch-Irish45 0.2% Guyanese44 0.2% Barbadian43 0.2% Norwegian30 0.1% Slovene27 0.1% Scottish22 0.08% Eastern European19 0.07% French18 0.07% Slovak18 0.07% Zimbabwean18 0.07% Bermudan15 0.06% French Canadian14 0.05% Swedish12 0.05% Lithuanian11 0.04% Finnish10 0.04% Brazilian10 0.04% Estonian10 0.04% Belizean8 0.03% Czech8 0.03% Slavic8 0.03% Ukrainian7 0.03% Dutch6 0.02% Egyptian6 0.02% Iranian2 0.01% Ugandan
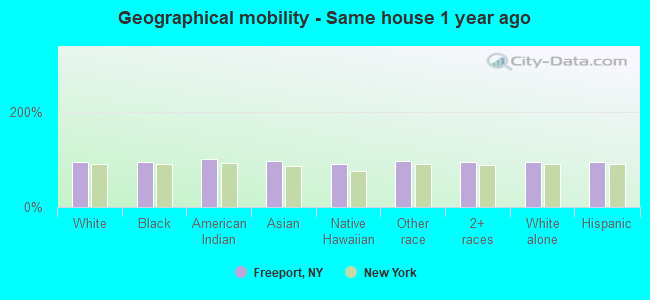
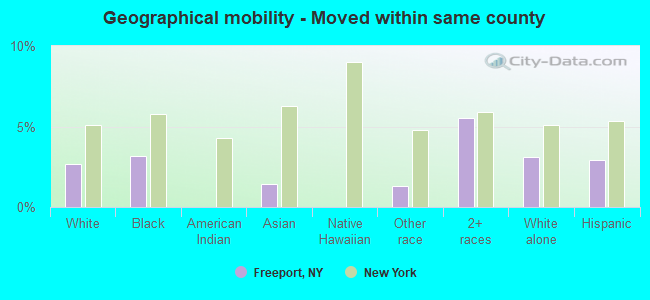
Geographical mobility in Freeport Same house 1 year ago 12,153 94.4% White (Caucasian)12,995 94.6% Black or African American40 100.0% American Indian / Alaska Native953 95.9% Asian4 89.7% Native Hawaiian / Pacific Islander10,006 97.0% Other race7,883 93.9% Two or more races8,323 94.6% White alone, not Hispanic / Latino18,467 95.0% Hispanic or LatinoMoved within same county 345 2.7% White / Caucasian438 3.2% Black or African American14 1.5% Asian136 1.3% Other race465 5.5% Two or more races271 3.1% White alone, not Hispanic / Latino562 2.9% Hispanic or LatinoMoved within same state 286 2.2% White / Caucasian204 1.5% Black or African American5 0.5% Asian4 0.0% Other race65 0.8% Two or more races170 1.9% White alone, not Hispanic / Latino104 0.5% Hispanic or LatinoMoved from different state 8 0.1% White / Caucasian88 0.9% Other race8 0.1% White alone, not Hispanic / Latino67 0.3% Hispanic or LatinoMoved from abroad 54 0.4% White40 0.3% Black or African American147 1.4% Other race255 1.3% Hispanic or Latino
Children Nativity (place of birth) in Freeport
Children under 6 years - Living with two parents Both parents native 374 100.0% NativeBoth parents foreign-born 456 81.6% Native103 18.4% Foreign-bornOne native, one foreign-born parent 242 88.0% Native33 12.0% Foreign-bornChildren under 6 years - Living with one parent Native parent 684 100.0% NativeForeign-born parent 562 88.6% Native72 11.4% Foreign-bornChildren 6 to 17 years - Living with two parents Both parents native 785 100.0% NativeBoth parents foreign-born 801 68.9% Native361 31.1% Foreign-bornOne native, one foreign-born parent 685 97.4% Native18 2.6% Foreign-bornChildren 6 to 17 years - Living with one parent Native parent 2,181 100.0% NativeForeign-born parent 1,099 52.7% Native987 47.3% Foreign-born
Grandparents responsible for own grandchildren in Freeport
Grandparents (30 to 59 years) White / Caucasian 44 32.4% Responsible for grandchildren91 67.6% Not responsible for grandchildrenBlack or African American 26 4.9% Responsible for grandchildren507 95.1% Not responsible for grandchildrenAsian 33 100.0% Not responsible for grandchildrenOther race 16 4.3% Responsible for grandchildren352 95.7% Not responsible for grandchildrenTwo or more races 54 100.0% Not responsible for grandchildrenWhite alone, not Hispanic / Latino 24 100.0% Responsible for grandchildrenHispanic or Latino 40 9.3% Responsible for grandchildren389 90.7% Not responsible for grandchildrenGrandparents (60 years and over) White / Caucasian 23 11.7% Responsible for grandchildren175 88.3% Not responsible for grandchildrenBlack or African American 105 18.6% Responsible for grandchildren460 81.4% Not responsible for grandchildrenAsian 44 100.0% Responsible for grandchildrenOther race 17 10.2% Responsible for grandchildren148 89.8% Not responsible for grandchildrenTwo or more races 141 100.0% Not responsible for grandchildrenWhite alone, not Hispanic / Latino 22 14.0% Responsible for grandchildren134 86.0% Not responsible for grandchildrenHispanic or Latino 28 7.2% Responsible for grandchildren358 92.8% Not responsible for grandchildren