Races in Friendswood, Texas (TX) Detailed Stats
Data:
Races - White alone (%)
Races - White alone (% change since 2000)
Races - Black alone (%)
Races - Black alone (% change since 2000)
Races - American Indian alone (%)
Races - American Indian alone (% change since 2000)
Races - Asian alone (%)
Races - Asian alone (% change since 2000)
Races - Hispanic (%)
Races - Hispanic (% change since 2000)
Races - Native Hawaiian and Other Pacific Islander alone (%)
Races - Native Hawaiian and Other Pacific Islander alone (% change since 2000)
Races - Two or more races(%)
Races - Two or more races(% change since 2000)
Races - Other race alone (%)
Races - Other race alone (% change since 2000)
Racial diversity
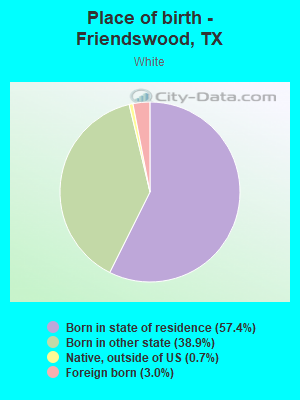
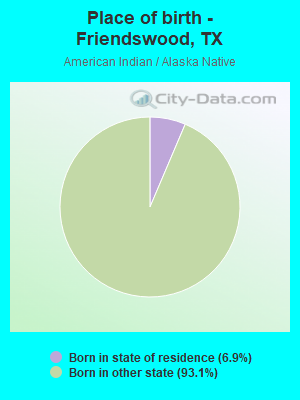
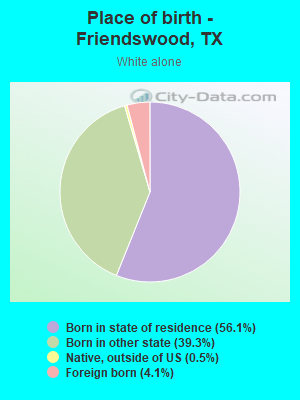
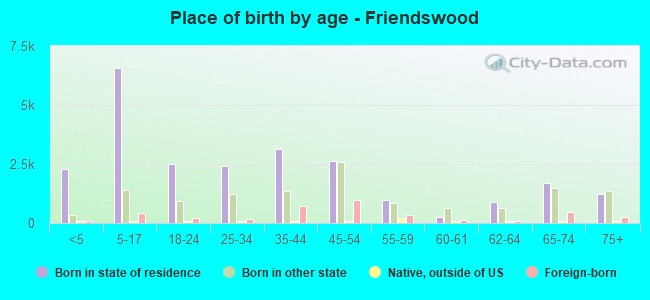
Place of birth - Born in state of residence (%)
Place of birth - Born in state of residence (%) - White
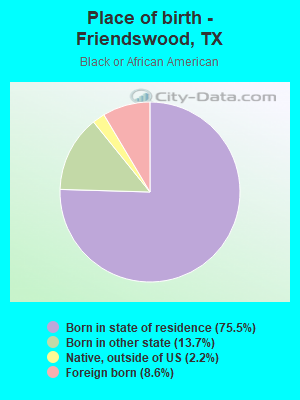
Place of birth - Born in state of residence (%) - Black or African American
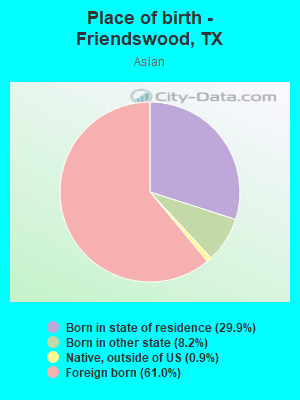
Place of birth - Born in state of residence (%) - Asian
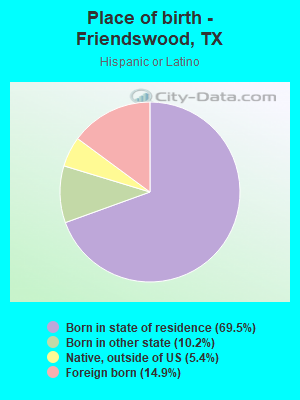
Place of birth - Born in state of residence (%) - Hispanic or Latino
Place of birth - Born in state of residence (%) - American Indian and Alaska Native
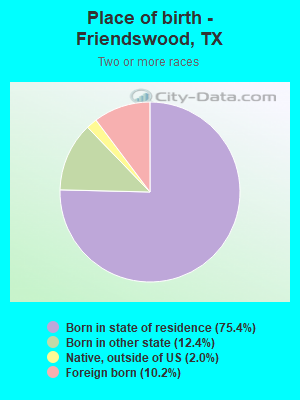
Place of birth - Born in state of residence (%) - Multirace
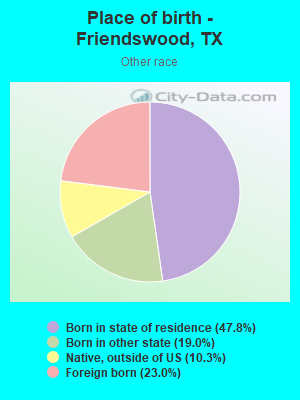
Place of birth - Born in state of residence (%) - Other Race
Place of birth - Born in other state (%)
Place of birth - Born in other state (%) - White
Place of birth - Born in other state (%) - Black or African American
Place of birth - Born in other state (%) - Asian
Place of birth - Born in other state (%) - Hispanic or Latino
Place of birth - Born in other state (%) - American Indian and Alaska Native
Place of birth - Born in other state (%) - Multirace
Place of birth - Born in other state (%) - Other Race
Place of birth - Native, outside of US (%)
Place of birth - Native, outside of US (%) - White
Place of birth - Native, outside of US (%) - Black or African American
Place of birth - Native, outside of US (%) - Asian
Place of birth - Native, outside of US (%) - Hispanic or Latino
Place of birth - Native, outside of US (%) - American Indian and Alaska Native
Place of birth - Native, outside of US (%) - Multirace
Place of birth - Native, outside of US (%) - Other Race
Place of birth - Foreign born (%)
Place of birth - Foreign born (%) - White
Place of birth - Foreign born (%) - Black or African American
Place of birth - Foreign born (%) - Asian
Place of birth - Foreign born (%) - Hispanic or Latino
Place of birth - Foreign born (%) - American Indian and Alaska Native
Place of birth - Foreign born (%) - Multirace
Place of birth - Foreign born (%) - Other Race
Residents speaking English at home (%)
Residents speaking English at home - Born in the United States (%)
Residents speaking English at home - Native, born elsewhere (%)
Residents speaking English at home - Foreign born (%)
Residents speaking Spanish at home (%)
Residents speaking Spanish at home - Born in the United States (%)
Residents speaking Spanish at home - Native, born elsewhere (%)
Residents speaking Spanish at home - Foreign born (%)
Residents speaking other language at home (%)
Residents speaking other language at home - Born in the United States (%)
Residents speaking other language at home - Native, born elsewhere (%)
Residents speaking other language at home - Foreign born (%)
Marital status - Never married (%)
Marital status - Now married (%)
Marital status - Separated (%)
Marital status - Widowed (%)
Marital status - Divorced (%)
Ancestries Reported - Arab (%)
Ancestries Reported - Czech (%)
Ancestries Reported - Danish (%)
Ancestries Reported - Dutch (%)
Ancestries Reported - English (%)
Ancestries Reported - French (%)
Ancestries Reported - French Canadian (%)
Ancestries Reported - German (%)
Ancestries Reported - Greek (%)
Ancestries Reported - Hungarian (%)
Ancestries Reported - Irish (%)
Ancestries Reported - Italian (%)
Ancestries Reported - Lithuanian (%)
Ancestries Reported - Norwegian (%)
Ancestries Reported - Polish (%)
Ancestries Reported - Portuguese (%)
Ancestries Reported - Russian (%)
Ancestries Reported - Scotch-Irish (%)
Ancestries Reported - Scottish (%)
Ancestries Reported - Slovak (%)
Ancestries Reported - Subsaharan African (%)
Ancestries Reported - Swedish (%)
Ancestries Reported - Swiss (%)
Ancestries Reported - Ukrainian (%)
Ancestries Reported - United States (%)
Ancestries Reported - Welsh (%)
Ancestries Reported - West Indian (%)
Ancestries Reported - Other (%)
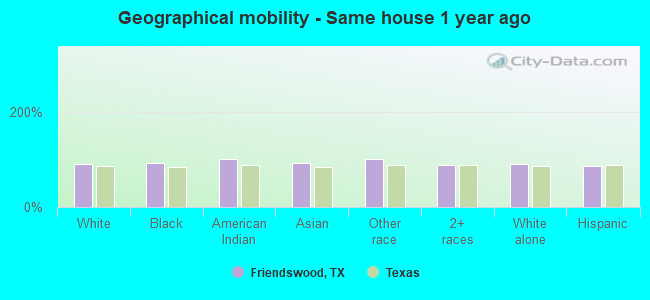
Geographical mobility - Same house 1 year ago (%)
Geographical mobility - Same house 1 year ago (%) - White
Geographical mobility - Same house 1 year ago (%) - Black or African American
Geographical mobility - Same house 1 year ago (%) - Asian
Geographical mobility - Same house 1 year ago (%) - Hispanic or Latino
Geographical mobility - Same house 1 year ago (%) - American Indian and Alaska Native
Geographical mobility - Same house 1 year ago (%) - Multirace
Geographical mobility - Same house 1 year ago (%) - Other Race
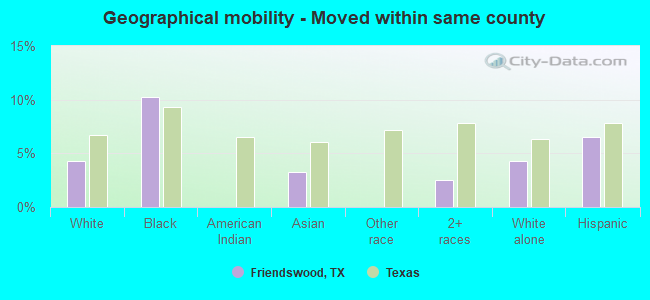
Geographical mobility - Moved within same county (%)
Geographical mobility - Moved within same county (%) - White
Geographical mobility - Moved within same county (%) - Black or African American
Geographical mobility - Moved within same county (%) - Asian
Geographical mobility - Moved within same county (%) - Hispanic or Latino
Geographical mobility - Moved within same county (%) - American Indian and Alaska Native
Geographical mobility - Moved within same county (%) - Multirace
Geographical mobility - Moved within same county (%) - Other Race
Geographical mobility - Moved from different county within same state (%)
Geographical mobility - Moved from different county within same state (%) - White
Geographical mobility - Moved from different county within same state (%) - Black or African American
Geographical mobility - Moved from different county within same state (%) - Asian
Geographical mobility - Moved from different county within same state (%) - Hispanic or Latino
Geographical mobility - Moved from different county within same state (%) - American Indian and Alaska Native
Geographical mobility - Moved from different county within same state (%) - Multirace
Geographical mobility - Moved from different county within same state (%) - Other Race
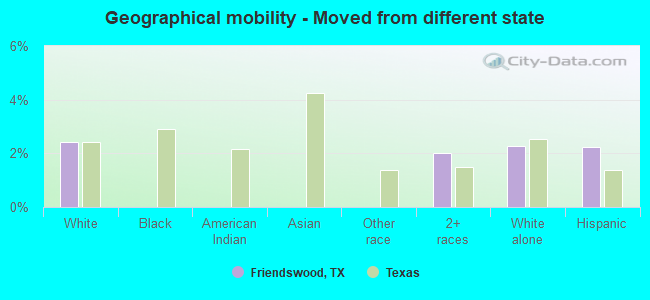
Geographical mobility - Moved from different state (%)
Geographical mobility - Moved from different state (%) - White
Geographical mobility - Moved from different state (%) - Black or African American
Geographical mobility - Moved from different state (%) - Asian
Geographical mobility - Moved from different state (%) - Hispanic or Latino
Geographical mobility - Moved from different state (%) - American Indian and Alaska Native
Geographical mobility - Moved from different state (%) - Multirace
Geographical mobility - Moved from different state (%) - Other Race
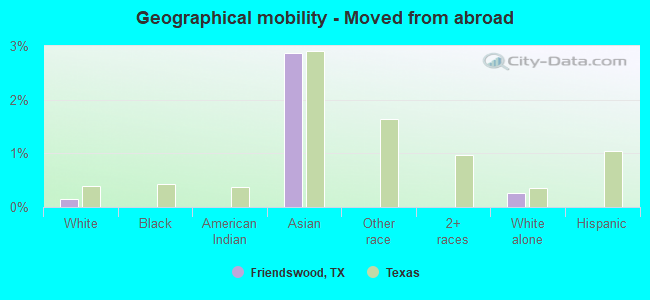
Geographical mobility - Moved from abroad (%)
Geographical mobility - Moved from abroad (%) - White
Geographical mobility - Moved from abroad (%) - Black or African American
Geographical mobility - Moved from abroad (%) - Asian
Geographical mobility - Moved from abroad (%) - Hispanic or Latino
Geographical mobility - Moved from abroad (%) - American Indian and Alaska Native
Geographical mobility - Moved from abroad (%) - Multirace
Geographical mobility - Moved from abroad (%) - Other Race
Place of birth for the foreign-born population - Ireland (%)
Place of birth for the foreign-born population - Denmark (%)
Place of birth for the foreign-born population - Norway (%)
Place of birth for the foreign-born population - Sweden (%)
Place of birth for the foreign-born population - United Kingdom (%)
Place of birth for the foreign-born population - England (%)
Place of birth for the foreign-born population - Scotland (%)
Place of birth for the foreign-born population - Other Northern Europe (%)
Place of birth for the foreign-born population - Austria (%)
Place of birth for the foreign-born population - Belgium (%)
Place of birth for the foreign-born population - France (%)
Place of birth for the foreign-born population - Germany (%)
Place of birth for the foreign-born population - Netherlands (%)
Place of birth for the foreign-born population - Switzerland (%)
Place of birth for the foreign-born population - Other Western Europe (%)
Place of birth for the foreign-born population - Greece (%)
Place of birth for the foreign-born population - Italy (%)
Place of birth for the foreign-born population - Portugal (%)
Place of birth for the foreign-born population - Spain (%)
Place of birth for the foreign-born population - Other Southern Europe (%)
Place of birth for the foreign-born population - Albania (%)
Place of birth for the foreign-born population - Belarus (%)
Place of birth for the foreign-born population - Bosnia and Herzegovina (%)
Place of birth for the foreign-born population - Bulgaria (%)
Place of birth for the foreign-born population - Croatia (%)
Place of birth for the foreign-born population - Czechoslovakia (%)
Place of birth for the foreign-born population - Hungary (%)
Place of birth for the foreign-born population - Latvia (%)
Place of birth for the foreign-born population - Lithuania (%)
Place of birth for the foreign-born population - North Macedonia (Macedonia) (%)
Place of birth for the foreign-born population - Moldova (%)
Place of birth for the foreign-born population - Poland (%)
Place of birth for the foreign-born population - Romania (%)
Place of birth for the foreign-born population - Russia (%)
Place of birth for the foreign-born population - Serbia (%)
Place of birth for the foreign-born population - Ukraine (%)
Place of birth for the foreign-born population - Other Eastern Europe (%)
Place of birth for the foreign-born population - China (%)
Place of birth for the foreign-born population - Hong Kong (%)
Place of birth for the foreign-born population - Taiwan (%)
Place of birth for the foreign-born population - Japan (%)
Place of birth for the foreign-born population - Korea (%)
Place of birth for the foreign-born population - Other Eastern Asia (%)
Place of birth for the foreign-born population - Afghanistan (%)
Place of birth for the foreign-born population - Bangladesh (%)
Place of birth for the foreign-born population - India (%)
Place of birth for the foreign-born population - Iran (%)
Place of birth for the foreign-born population - Kazakhstan (%)
Place of birth for the foreign-born population - Nepal (%)
Place of birth for the foreign-born population - Pakistan (%)
Place of birth for the foreign-born population - Sri Lanka (%)
Place of birth for the foreign-born population - Uzbekistan (%)
Place of birth for the foreign-born population - Other South Central Asia (%)
Place of birth for the foreign-born population - Burma (%)
Place of birth for the foreign-born population - Cambodia (%)
Place of birth for the foreign-born population - Indonesia (%)
Place of birth for the foreign-born population - Laos (%)
Place of birth for the foreign-born population - Malaysia (%)
Place of birth for the foreign-born population - Philippines (%)
Place of birth for the foreign-born population - Singapore (%)
Place of birth for the foreign-born population - Thailand (%)
Place of birth for the foreign-born population - Vietnam (%)
Place of birth for the foreign-born population - Other South Eastern Asia (%)
Place of birth for the foreign-born population - Armenia (%)
Place of birth for the foreign-born population - Iraq (%)
Place of birth for the foreign-born population - Israel (%)
Place of birth for the foreign-born population - Jordan (%)
Place of birth for the foreign-born population - Kuwait (%)
Place of birth for the foreign-born population - Lebanon (%)
Place of birth for the foreign-born population - Saudi Arabia (%)
Place of birth for the foreign-born population - Syria (%)
Place of birth for the foreign-born population - Turkey (%)
Place of birth for the foreign-born population - Yemen (%)
Place of birth for the foreign-born population - Other Western Asia (%)
Place of birth for the foreign-born population - Eritrea (%)
Place of birth for the foreign-born population - Ethiopia (%)
Place of birth for the foreign-born population - Kenya (%)
Place of birth for the foreign-born population - Somalia (%)
Place of birth for the foreign-born population - Uganda (%)
Place of birth for the foreign-born population - Zimbabwe (%)
Place of birth for the foreign-born population - Other Eastern Africa (%)
Place of birth for the foreign-born population - Cameroon (%)
Place of birth for the foreign-born population - Congo (%)
Place of birth for the foreign-born population - Democratic Republic of Congo (Zaire) (%)
Place of birth for the foreign-born population - Other Middle Africa (%)
Place of birth for the foreign-born population - Egypt (%)
Place of birth for the foreign-born population - Morocco (%)
Place of birth for the foreign-born population - Sudan (%)
Place of birth for the foreign-born population - Other Northern Africa (%)
Place of birth for the foreign-born population - South Africa (%)
Place of birth for the foreign-born population - Other Southern Africa (%)
Place of birth for the foreign-born population - Cabo Verde (%)
Place of birth for the foreign-born population - Ghana (%)
Place of birth for the foreign-born population - Liberia (%)
Place of birth for the foreign-born population - Nigeria (%)
Place of birth for the foreign-born population - Senegal (%)
Place of birth for the foreign-born population - Sierra Leone (%)
Place of birth for the foreign-born population - Other Western Africa (%)
Place of birth for the foreign-born population - Australia (%)
Place of birth for the foreign-born population - New Zealand (%)
Place of birth for the foreign-born population - Fiji (%)
Place of birth for the foreign-born population - Micronesia (%)
Place of birth for the foreign-born population - Bahamas (%)
Place of birth for the foreign-born population - Barbados (%)
Place of birth for the foreign-born population - Cuba (%)
Place of birth for the foreign-born population - Dominica (%)
Place of birth for the foreign-born population - Dominican Republic (%)
Place of birth for the foreign-born population - Grenada (%)
Place of birth for the foreign-born population - Haiti (%)
Place of birth for the foreign-born population - Jamaica (%)
Place of birth for the foreign-born population - St. Vincent and the Grenadines (%)
Place of birth for the foreign-born population - Trinidad and Tobago (%)
Place of birth for the foreign-born population - West Indies (%)
Place of birth for the foreign-born population - Other Caribbean (%)
Place of birth for the foreign-born population - Belize (%)
Place of birth for the foreign-born population - Costa Rica (%)
Place of birth for the foreign-born population - El Salvador (%)
Place of birth for the foreign-born population - Guatemala (%)
Place of birth for the foreign-born population - Honduras (%)
Place of birth for the foreign-born population - Mexico (%)
Place of birth for the foreign-born population - Nicaragua (%)
Place of birth for the foreign-born population - Panama (%)
Place of birth for the foreign-born population - Other Central America (%)
Place of birth for the foreign-born population - Argentina (%)
Place of birth for the foreign-born population - Bolivia (%)
Place of birth for the foreign-born population - Brazil (%)
Place of birth for the foreign-born population - Chile (%)
Place of birth for the foreign-born population - Colombia (%)
Place of birth for the foreign-born population - Ecuador (%)
Place of birth for the foreign-born population - Guyana (%)
Place of birth for the foreign-born population - Peru (%)
Place of birth for the foreign-born population - Uruguay (%)
Place of birth for the foreign-born population - Venezuela (%)
Place of birth for the foreign-born population - Other South America (%)
Place of birth for the foreign-born population - Canada (%)
Place of birth for the foreign-born population - Other Northern America (%)
Place of birth for the foreign-born population - Other (%)
Latest news about races in Friendswood, TX collected exclusively by city-data.com from local newspapers, TV, and radio stations
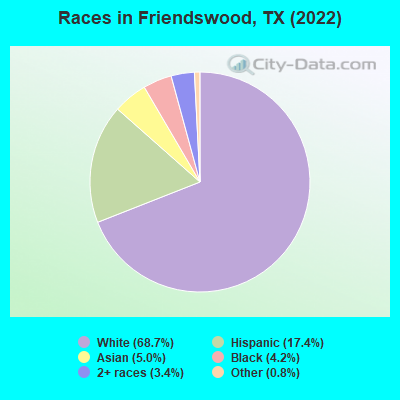
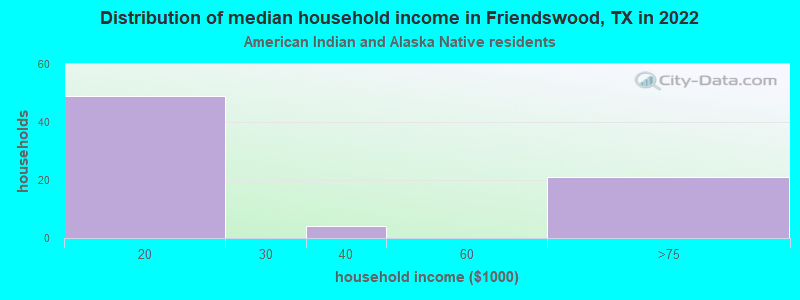
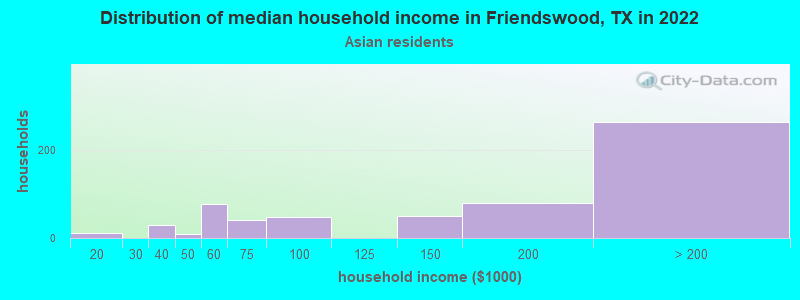
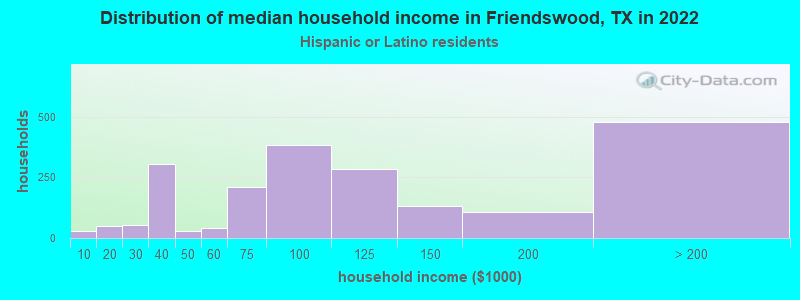
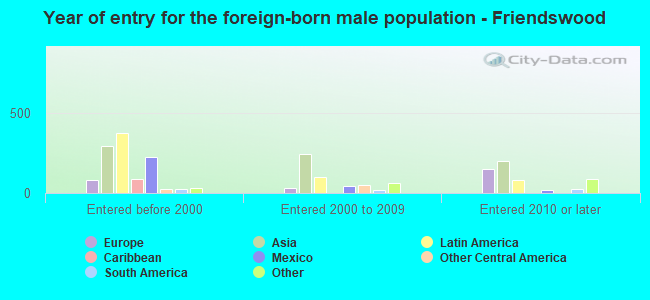
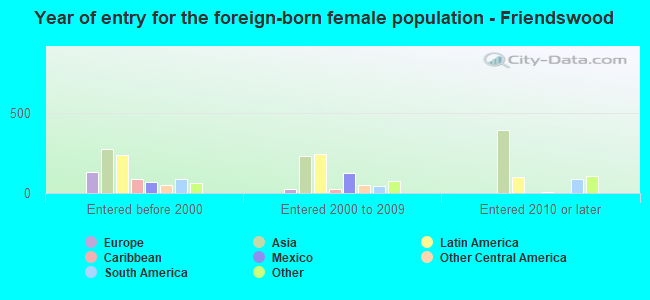
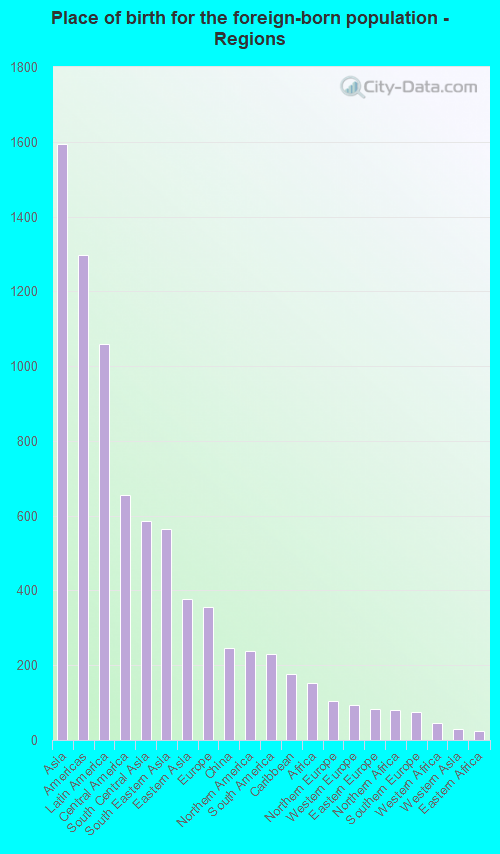
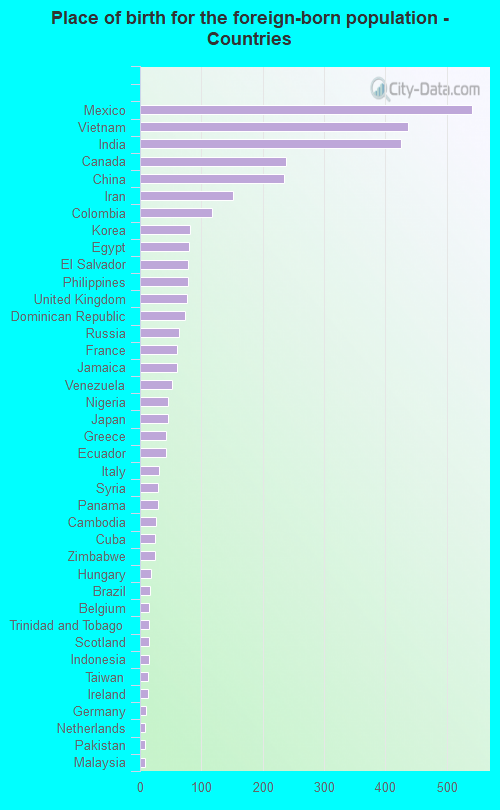
According to 2022 data, the most numerous races in Friendswood, TX are Hispanic (7,230 residents), White alone (28,609 residents), and Black alone (1,751 residents). 85.7% of Friendswood residents speak English at home. 8.2% of Friendswood, TX residents are foreign-born (3.8% born in Asia, 2.5% born in Latin America, 0.8% born in Europe), which is 107.9% less than the foreign-born rate of 17.0% across the entire state of Texas.
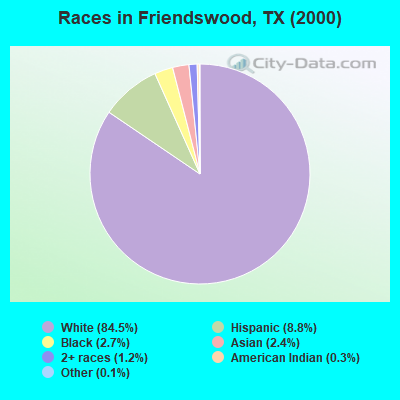
Race distribution in Friendswood
2000 2022
10,933,313 52.4% White alone 6,669,666 32.0% Hispanic 2,364,255 11.3% Black alone 554,445 2.7% Asian alone 230,567 1.1% Two or more races 68,859 0.3% American Indian alone 19,958 0.10% Other race alone 10,757 0.05% Native Hawaiian and Other
12,070,642 40.2% Hispanic 11,683,430 38.9% White alone 3,508,706 11.7% Black alone 1,608,173 5.4% Asian alone 956,560 3.2% Two or more races 125,763 0.4% Other race alone 47,023 0.2% American Indian alone 29,275 0.10% Native Hawaiian and Other
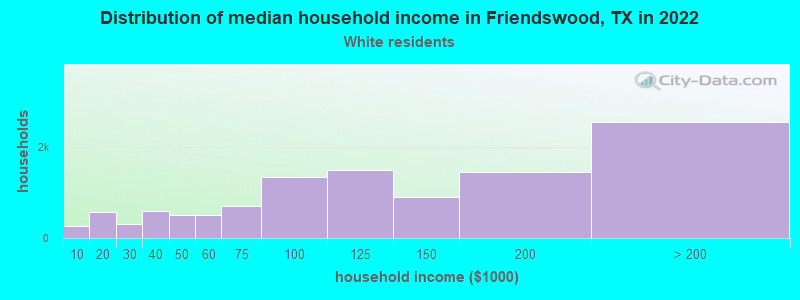
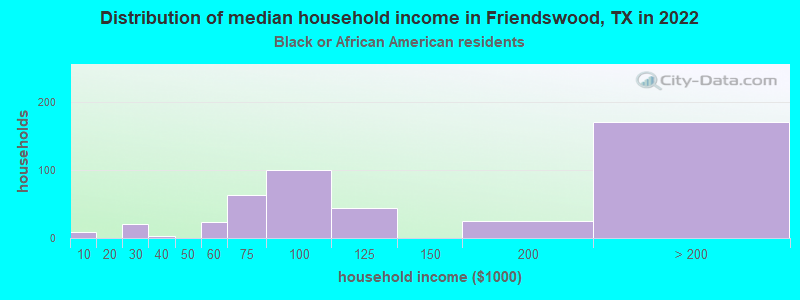
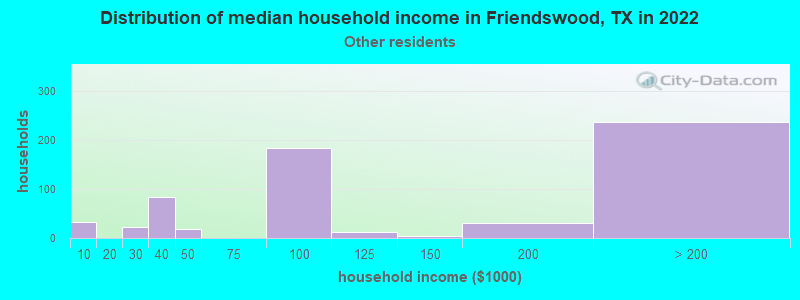
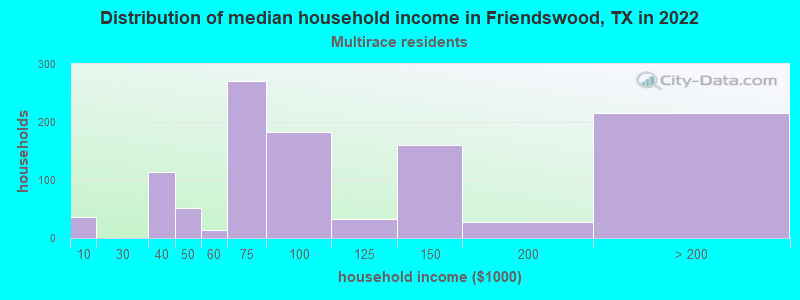
Income and house value in Friendswood Median household income in 2022 $113,205 White non-Hispanic householders$129,807 Black householders$129,047 Asian householders$74,626 Two or more races householders$110,084 Hispanic or Latino race householdersMedian 2022 house value $417,962 White Non-Hispanic householders$323,945 Black or African American householders$259,948 American Indian or Alaska Native householders $448,311 Asian householders$317,347 Some other race householders$369,799 Two or more races householders$326,914 Hispanic or Latino householders
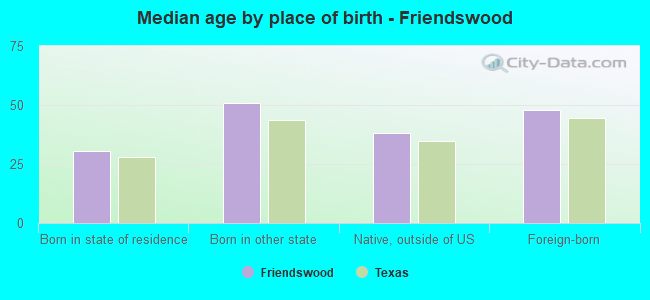
Median age by race in Friendswood
41.7 Median age for White residents41.4 41.9 38.0 Median age for Black or African American residents29.6 47.4 77.1 Median age for American Indian / Alaska Native residents-513,227,512.7 -673,582,295.3 43.3 Median age for Asian residents43.0 44.9 -581,560,283.1 Median age for Native Hawaiian / Pacific Islander residents-612,729,233.5 -577,777,777.2 36.2 Median age for Other race residents38.7 35.2 25.5 Median age for Two or more races residents23.9 33.4 40.4 Median age for White alone residents39.5 42.6 35.8 Median age for Hispanic or Latino residents37.5 34.3
Owner/renter occupied households by race in Friendswood
House owners and renters - White residents 8,946 77.4% Owner occupied2,616 22.6% Renter occupiedHouse owners and renters - Black or African American residents 362 81.5% Owner occupied82 18.5% Renter occupiedHouse owners and renters - American Indian / Alaska Native residents 6 100.0% Owner occupiedHouse owners and renters - Asian residents 555 91.8% Owner occupied50 8.2% Renter occupiedHouse owners and renters - Other race residents 665 86.7% Owner occupied102 13.3% Renter occupiedHouse owners and renters - Two or more races residents 730 63.4% Owner occupied421 36.6% Renter occupiedHouse owners and renters - White alone residents 8,684 76.9% Owner occupied2,609 23.1% Renter occupiedHouse owners and renters - Hispanic or Latino residents 1,681 75.0% Owner occupied560 25.0% Renter occupied
Language usage in Friendswood
English speakers - Total 85.7% of residents of Friendswood speak English at home.
7.5% of residents speak Spanish at home 2,291 78.8% Speak English very well617 21.2% Speak English less than very well6.1% of residents speak other language at home 1,339 56.3% Speak English very well1,039 43.7% Speak English less than very well
English speakers - Born in the United States 95.0% of residents of Friendswood speak English at home.
2.8% of residents speak Spanish at home 324 92.3% Speak English very well27 7.7% Speak English less than very well1.9% of residents speak other language at home 232 100.0% Speak English very well
English speakers - Native, born elsewhere 57.4% of residents of Friendswood speak English at home.
43.9% of residents speak Spanish at home 143 54.4% Speak English very well120 45.6% Speak English less than very well8.5% of residents speak other language at home 51 100.0% Speak English very well
English speakers - Foreign-born 28.8% of residents of Friendswood speak English at home.
22.7% of residents speak Spanish at home 569 67.7% Speak English very well272 32.3% Speak English less than very well47.3% of residents speak other language at home 916 52.3% Speak English very well834 47.7% Speak English less than very well
White (Caucasian) - Speak only English Native:
98.5% (26,416)Foreign-born:
73.2% (659)
White (Caucasian) - Speak another language Native:
3.2% (854)Foreign-born:
42.9% (387)
Black or African American - Speak only English Native:
96.0% (1,425)Foreign-born:
42.2% (68)
Black or African American - Speak another language Native:
3.9% (58)Foreign-born:
23.3% (37)
Asian - Speak only English Native:
46.8% (299)Foreign-born:
13.4% (175)
Asian - Speak another language Native:
53.3% (341)Foreign-born:
86.3% (1,130)
Other race - Speak only English Native:
71.9% (848)Foreign-born:
49.8% (201)
Other race - Speak another language Native:
30.8% (363)Foreign-born:
52.9% (213)
Two or more races - Speak another language Native:
19.8% (764)Foreign-born:
100.0% (476)
White alone - Speak only English Native:
97.9% (25,258)Foreign-born:
54.3% (640)
White alone - Speak another language Native:
2.1% (544)Foreign-born:
45.8% (540)
Hispanic or Latino - Speak only English Native:
68.7% (3,987)Foreign-born:
22.6% (242)
Hispanic or Latino - Speak another language Native:
30.0% (1,742)Foreign-born:
77.7% (830)
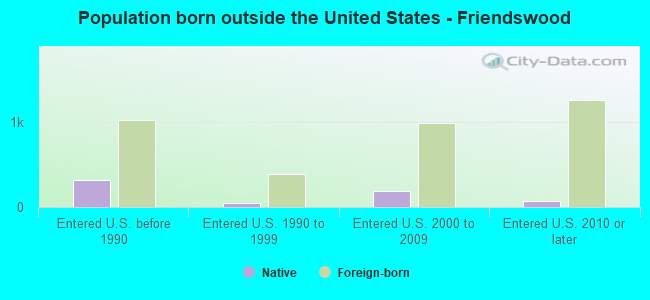
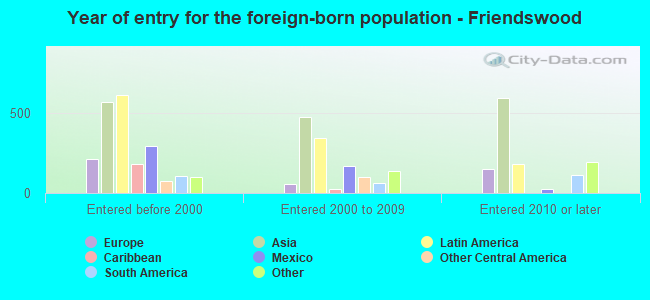
Foreign-born residents in Friendswood 3,404 residents are foreign born (3.8% Asia , 2.5% Latin America , 0.8% Europe ).
This city:
8.2%Texas:
17.1%
Marital status for residents in Friendswood Marital status - White (Caucasian) population 15 years and over
Males 25.8% Never married65.1% Now married0.4% Separated1.6% Widowed7.0% DivorcedFemales 21.8% Never married57.1% Now married0.7% Separated10.1% Widowed10.3% DivorcedWomen who gave birth in the past 12 months Now married:
94.5% (212)Unmarried:
5.5% (12)
Women who did not give birth in the past 12 months Now married:
54.1% (3,458)Unmarried:
45.9% (2,939)
Marital status - Black or African American population 15 years and over
Males 15.6% Never married75.0% Now married0.0% Separated0.0% Widowed9.4% DivorcedFemales 6.7% Never married73.6% Now married6.7% Separated5.3% Widowed7.7% DivorcedWomen who did not give birth in the past 12 months Now married:
79.9% (322)Unmarried:
20.1% (81)
Marital status - American Indian / Alaska Native population 15 years and over
Males 0.0% Never married75.0% Now married0.0% Separated0.0% Widowed25.0% DivorcedFemales 0.0% Never married0.0% Now married0.0% Separated0.0% Widowed100.0% DivorcedMarital status - Asian population 15 years and over
Males 6.0% Never married91.6% Now married0.0% Separated2.4% Widowed0.0% DivorcedFemales 16.2% Never married71.0% Now married3.4% Separated6.6% Widowed2.8% DivorcedWomen who gave birth in the past 12 months Now married:
100.0% (17)Unmarried:
0.0% (0)
Women who did not give birth in the past 12 months Now married:
70.2% (365)Unmarried:
29.8% (155)
Marital status - Other race population 15 years and over
Males 26.6% Never married55.3% Now married0.0% Separated0.0% Widowed18.1% DivorcedFemales 42.3% Never married48.7% Now married0.0% Separated3.7% Widowed5.3% DivorcedWomen who gave birth in the past 12 months Now married:
0.0% (0)Unmarried:
100.0% (23)
Women who did not give birth in the past 12 months Now married:
44.1% (161)Unmarried:
55.9% (204)
Marital status - Two or more races population 15 years and over
Males 41.5% Never married54.5% Now married0.0% Separated4.0% Widowed0.0% DivorcedFemales 37.8% Never married44.8% Now married1.8% Separated0.0% Widowed15.6% DivorcedWomen who gave birth in the past 12 months Now married:
100.0% (18)Unmarried:
0.0% (0)
Women who did not give birth in the past 12 months Now married:
32.0% (363)Unmarried:
68.0% (770)
Marital status - White alone, not Hispanic / Latino population 15 years and over
Males 24.6% Never married65.7% Now married0.5% Separated1.6% Widowed7.6% DivorcedFemales 20.7% Never married56.6% Now married0.7% Separated11.1% Widowed10.9% DivorcedWomen who gave birth in the past 12 months Now married:
100.0% (199)Unmarried:
0.0% (0)
Women who did not give birth in the past 12 months Now married:
54.5% (3,322)Unmarried:
45.5% (2,775)
Marital status - Hispanic or Latino population 15 years and over
Males 34.0% Never married59.4% Now married0.0% Separated2.3% Widowed4.4% DivorcedFemales 31.3% Never married58.6% Now married0.7% Separated2.0% Widowed7.5% DivorcedWomen who gave birth in the past 12 months Now married:
73.6% (41)Unmarried:
26.4% (15)
Women who did not give birth in the past 12 months Now married:
49.7% (926)Unmarried:
50.3% (938)
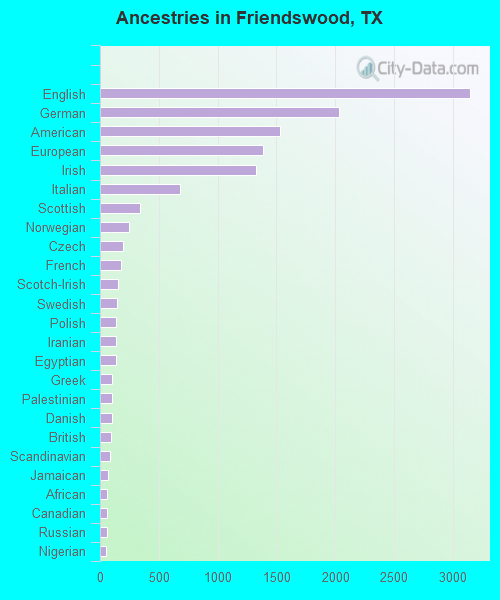
Ancestries in Friendswood
3,151 15.6% English2,030 10.0% German1,527 7.6% American1,383 6.8% European1,330 6.6% Irish680 3.4% Italian341 1.7% Scottish247 1.2% Norwegian195 1.0% Czech178 0.9% French151 0.7% Scotch-Irish142 0.7% Swedish136 0.7% Polish136 0.7% Iranian134 0.7% Egyptian99 0.5% Greek98 0.5% Palestinian98 0.5% Danish96 0.5% British89 0.4% Scandinavian70 0.3% Jamaican63 0.3% African62 0.3% Canadian62 0.3% Russian49 0.2% Nigerian48 0.2% Welsh39 0.2% French Canadian38 0.2% Eastern European35 0.2% Romanian34 0.2% Czechoslovakian33 0.2% Dutch31 0.2% Lithuanian27 0.1% Swiss23 0.1% Northern European22 0.1% Cajun21 0.1% Slovene18 0.09% Finnish15 0.07% Belgian13 0.06% Trinidadian and Tobagonian8 0.04% Lebanese7 0.03% Slovak5 0.02% Hungarian5 0.02% Austrian
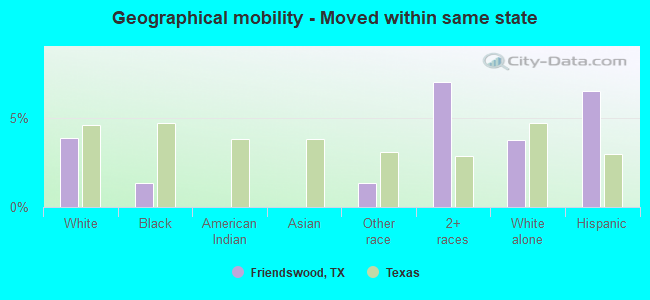
Geographical mobility in Friendswood Same house 1 year ago 26,135 89.8% White (Caucasian)1,681 91.5% Black or African American11 100.0% American Indian / Alaska Native2,017 93.1% Asian1,726 100.0% Other race4,172 87.8% Two or more races25,573 89.9% White alone, not Hispanic / Latino6,151 85.1% Hispanic or LatinoMoved within same county 1,236 4.2% White / Caucasian188 10.2% Black or African American72 3.3% Asian118 2.5% Two or more races1,225 4.3% White alone, not Hispanic / Latino474 6.6% Hispanic or LatinoMoved within same state 1,123 3.9% White / Caucasian24 1.3% Black or African American23 1.4% Other race331 7.0% Two or more races1,066 3.7% White alone, not Hispanic / Latino467 6.5% Hispanic or LatinoMoved from different state 706 2.4% White / Caucasian95 2.0% Two or more races642 2.3% White alone, not Hispanic / Latino163 2.3% Hispanic or LatinoMoved from abroad 45 0.2% White62 2.9% Asian77 0.3% White alone, not Hispanic / Latino
Children Nativity (place of birth) in Friendswood
Children under 6 years - Living with two parents Both parents native 2,609 100.0% NativeBoth parents foreign-born 141 100.0% NativeOne native, one foreign-born parent 94 100.0% NativeChildren under 6 years - Living with one parent Native parent 283 100.0% NativeForeign-born parent 28 100.0% NativeChildren 6 to 17 years - Living with two parents Both parents native 4,992 98.5% Native77 1.5% Foreign-bornBoth parents foreign-born 415 72.4% Native158 27.6% Foreign-bornOne native, one foreign-born parent 380 89.6% Native44 10.4% Foreign-bornChildren 6 to 17 years - Living with one parent Native parent 1,397 100.0% NativeForeign-born parent 325 61.1% Native207 38.9% Foreign-born
Grandparents responsible for own grandchildren in Friendswood
Grandparents (30 to 59 years) White / Caucasian 97 36.4% Responsible for grandchildren169 63.6% Not responsible for grandchildrenBlack or African American 53 100.0% Not responsible for grandchildrenAsian 27 100.0% Not responsible for grandchildrenOther race 98 100.0% Not responsible for grandchildrenTwo or more races 7 100.0% Responsible for grandchildrenWhite alone, not Hispanic / Latino 55 34.6% Responsible for grandchildren105 65.4% Not responsible for grandchildrenHispanic or Latino 60 29.8% Responsible for grandchildren141 70.2% Not responsible for grandchildrenGrandparents (60 years and over) White / Caucasian 20 21.3% Responsible for grandchildren73 78.7% Not responsible for grandchildrenBlack or African American 37 100.0% Not responsible for grandchildrenAsian 97 100.0% Not responsible for grandchildrenOther race 13 100.0% Not responsible for grandchildrenTwo or more races 8 8.9% Responsible for grandchildren83 91.1% Not responsible for grandchildrenWhite alone, not Hispanic / Latino 24 21.2% Responsible for grandchildren91 78.8% Not responsible for grandchildrenHispanic or Latino 56 100.0% Not responsible for grandchildren