Races in Fulshear, Texas (TX) Detailed Stats
Data:
Races - White alone (%)
Races - White alone (% change since 2000)
Races - Black alone (%)
Races - Black alone (% change since 2000)
Races - American Indian alone (%)
Races - American Indian alone (% change since 2000)
Races - Asian alone (%)
Races - Asian alone (% change since 2000)
Races - Hispanic (%)
Races - Hispanic (% change since 2000)
Races - Native Hawaiian and Other Pacific Islander alone (%)
Races - Native Hawaiian and Other Pacific Islander alone (% change since 2000)
Races - Two or more races(%)
Races - Two or more races(% change since 2000)
Races - Other race alone (%)
Races - Other race alone (% change since 2000)
Racial diversity
Place of birth - Born in state of residence (%)
Place of birth - Born in state of residence (%) - White
Place of birth - Born in state of residence (%) - Black or African American
Place of birth - Born in state of residence (%) - Asian
Place of birth - Born in state of residence (%) - Hispanic or Latino
Place of birth - Born in state of residence (%) - American Indian and Alaska Native
Place of birth - Born in state of residence (%) - Multirace
Place of birth - Born in state of residence (%) - Other Race
Place of birth - Born in other state (%)
Place of birth - Born in other state (%) - White
Place of birth - Born in other state (%) - Black or African American
Place of birth - Born in other state (%) - Asian
Place of birth - Born in other state (%) - Hispanic or Latino
Place of birth - Born in other state (%) - American Indian and Alaska Native
Place of birth - Born in other state (%) - Multirace
Place of birth - Born in other state (%) - Other Race
Place of birth - Native, outside of US (%)
Place of birth - Native, outside of US (%) - White
Place of birth - Native, outside of US (%) - Black or African American
Place of birth - Native, outside of US (%) - Asian
Place of birth - Native, outside of US (%) - Hispanic or Latino
Place of birth - Native, outside of US (%) - American Indian and Alaska Native
Place of birth - Native, outside of US (%) - Multirace
Place of birth - Native, outside of US (%) - Other Race
Place of birth - Foreign born (%)
Place of birth - Foreign born (%) - White
Place of birth - Foreign born (%) - Black or African American
Place of birth - Foreign born (%) - Asian
Place of birth - Foreign born (%) - Hispanic or Latino
Place of birth - Foreign born (%) - American Indian and Alaska Native
Place of birth - Foreign born (%) - Multirace
Place of birth - Foreign born (%) - Other Race
Residents speaking English at home (%)
Residents speaking English at home - Born in the United States (%)
Residents speaking English at home - Native, born elsewhere (%)
Residents speaking English at home - Foreign born (%)
Residents speaking Spanish at home (%)
Residents speaking Spanish at home - Born in the United States (%)
Residents speaking Spanish at home - Native, born elsewhere (%)
Residents speaking Spanish at home - Foreign born (%)
Residents speaking other language at home (%)
Residents speaking other language at home - Born in the United States (%)
Residents speaking other language at home - Native, born elsewhere (%)
Residents speaking other language at home - Foreign born (%)
Marital status - Never married (%)
Marital status - Now married (%)
Marital status - Separated (%)
Marital status - Widowed (%)
Marital status - Divorced (%)
Ancestries Reported - Arab (%)
Ancestries Reported - Czech (%)
Ancestries Reported - Danish (%)
Ancestries Reported - Dutch (%)
Ancestries Reported - English (%)
Ancestries Reported - French (%)
Ancestries Reported - French Canadian (%)
Ancestries Reported - German (%)
Ancestries Reported - Greek (%)
Ancestries Reported - Hungarian (%)
Ancestries Reported - Irish (%)
Ancestries Reported - Italian (%)
Ancestries Reported - Lithuanian (%)
Ancestries Reported - Norwegian (%)
Ancestries Reported - Polish (%)
Ancestries Reported - Portuguese (%)
Ancestries Reported - Russian (%)
Ancestries Reported - Scotch-Irish (%)
Ancestries Reported - Scottish (%)
Ancestries Reported - Slovak (%)
Ancestries Reported - Subsaharan African (%)
Ancestries Reported - Swedish (%)
Ancestries Reported - Swiss (%)
Ancestries Reported - Ukrainian (%)
Ancestries Reported - United States (%)
Ancestries Reported - Welsh (%)
Ancestries Reported - West Indian (%)
Ancestries Reported - Other (%)
Geographical mobility - Same house 1 year ago (%)
Geographical mobility - Same house 1 year ago (%) - White
Geographical mobility - Same house 1 year ago (%) - Black or African American
Geographical mobility - Same house 1 year ago (%) - Asian
Geographical mobility - Same house 1 year ago (%) - Hispanic or Latino
Geographical mobility - Same house 1 year ago (%) - American Indian and Alaska Native
Geographical mobility - Same house 1 year ago (%) - Multirace
Geographical mobility - Same house 1 year ago (%) - Other Race
Geographical mobility - Moved within same county (%)
Geographical mobility - Moved within same county (%) - White
Geographical mobility - Moved within same county (%) - Black or African American
Geographical mobility - Moved within same county (%) - Asian
Geographical mobility - Moved within same county (%) - Hispanic or Latino
Geographical mobility - Moved within same county (%) - American Indian and Alaska Native
Geographical mobility - Moved within same county (%) - Multirace
Geographical mobility - Moved within same county (%) - Other Race
Geographical mobility - Moved from different county within same state (%)
Geographical mobility - Moved from different county within same state (%) - White
Geographical mobility - Moved from different county within same state (%) - Black or African American
Geographical mobility - Moved from different county within same state (%) - Asian
Geographical mobility - Moved from different county within same state (%) - Hispanic or Latino
Geographical mobility - Moved from different county within same state (%) - American Indian and Alaska Native
Geographical mobility - Moved from different county within same state (%) - Multirace
Geographical mobility - Moved from different county within same state (%) - Other Race
Geographical mobility - Moved from different state (%)
Geographical mobility - Moved from different state (%) - White
Geographical mobility - Moved from different state (%) - Black or African American
Geographical mobility - Moved from different state (%) - Asian
Geographical mobility - Moved from different state (%) - Hispanic or Latino
Geographical mobility - Moved from different state (%) - American Indian and Alaska Native
Geographical mobility - Moved from different state (%) - Multirace
Geographical mobility - Moved from different state (%) - Other Race
Geographical mobility - Moved from abroad (%)
Geographical mobility - Moved from abroad (%) - White
Geographical mobility - Moved from abroad (%) - Black or African American
Geographical mobility - Moved from abroad (%) - Asian
Geographical mobility - Moved from abroad (%) - Hispanic or Latino
Geographical mobility - Moved from abroad (%) - American Indian and Alaska Native
Geographical mobility - Moved from abroad (%) - Multirace
Geographical mobility - Moved from abroad (%) - Other Race
Place of birth for the foreign-born population - Ireland (%)
Place of birth for the foreign-born population - Denmark (%)
Place of birth for the foreign-born population - Norway (%)
Place of birth for the foreign-born population - Sweden (%)
Place of birth for the foreign-born population - United Kingdom (%)
Place of birth for the foreign-born population - England (%)
Place of birth for the foreign-born population - Scotland (%)
Place of birth for the foreign-born population - Other Northern Europe (%)
Place of birth for the foreign-born population - Austria (%)
Place of birth for the foreign-born population - Belgium (%)
Place of birth for the foreign-born population - France (%)
Place of birth for the foreign-born population - Germany (%)
Place of birth for the foreign-born population - Netherlands (%)
Place of birth for the foreign-born population - Switzerland (%)
Place of birth for the foreign-born population - Other Western Europe (%)
Place of birth for the foreign-born population - Greece (%)
Place of birth for the foreign-born population - Italy (%)
Place of birth for the foreign-born population - Portugal (%)
Place of birth for the foreign-born population - Spain (%)
Place of birth for the foreign-born population - Other Southern Europe (%)
Place of birth for the foreign-born population - Albania (%)
Place of birth for the foreign-born population - Belarus (%)
Place of birth for the foreign-born population - Bosnia and Herzegovina (%)
Place of birth for the foreign-born population - Bulgaria (%)
Place of birth for the foreign-born population - Croatia (%)
Place of birth for the foreign-born population - Czechoslovakia (%)
Place of birth for the foreign-born population - Hungary (%)
Place of birth for the foreign-born population - Latvia (%)
Place of birth for the foreign-born population - Lithuania (%)
Place of birth for the foreign-born population - North Macedonia (Macedonia) (%)
Place of birth for the foreign-born population - Moldova (%)
Place of birth for the foreign-born population - Poland (%)
Place of birth for the foreign-born population - Romania (%)
Place of birth for the foreign-born population - Russia (%)
Place of birth for the foreign-born population - Serbia (%)
Place of birth for the foreign-born population - Ukraine (%)
Place of birth for the foreign-born population - Other Eastern Europe (%)
Place of birth for the foreign-born population - China (%)
Place of birth for the foreign-born population - Hong Kong (%)
Place of birth for the foreign-born population - Taiwan (%)
Place of birth for the foreign-born population - Japan (%)
Place of birth for the foreign-born population - Korea (%)
Place of birth for the foreign-born population - Other Eastern Asia (%)
Place of birth for the foreign-born population - Afghanistan (%)
Place of birth for the foreign-born population - Bangladesh (%)
Place of birth for the foreign-born population - India (%)
Place of birth for the foreign-born population - Iran (%)
Place of birth for the foreign-born population - Kazakhstan (%)
Place of birth for the foreign-born population - Nepal (%)
Place of birth for the foreign-born population - Pakistan (%)
Place of birth for the foreign-born population - Sri Lanka (%)
Place of birth for the foreign-born population - Uzbekistan (%)
Place of birth for the foreign-born population - Other South Central Asia (%)
Place of birth for the foreign-born population - Burma (%)
Place of birth for the foreign-born population - Cambodia (%)
Place of birth for the foreign-born population - Indonesia (%)
Place of birth for the foreign-born population - Laos (%)
Place of birth for the foreign-born population - Malaysia (%)
Place of birth for the foreign-born population - Philippines (%)
Place of birth for the foreign-born population - Singapore (%)
Place of birth for the foreign-born population - Thailand (%)
Place of birth for the foreign-born population - Vietnam (%)
Place of birth for the foreign-born population - Other South Eastern Asia (%)
Place of birth for the foreign-born population - Armenia (%)
Place of birth for the foreign-born population - Iraq (%)
Place of birth for the foreign-born population - Israel (%)
Place of birth for the foreign-born population - Jordan (%)
Place of birth for the foreign-born population - Kuwait (%)
Place of birth for the foreign-born population - Lebanon (%)
Place of birth for the foreign-born population - Saudi Arabia (%)
Place of birth for the foreign-born population - Syria (%)
Place of birth for the foreign-born population - Turkey (%)
Place of birth for the foreign-born population - Yemen (%)
Place of birth for the foreign-born population - Other Western Asia (%)
Place of birth for the foreign-born population - Eritrea (%)
Place of birth for the foreign-born population - Ethiopia (%)
Place of birth for the foreign-born population - Kenya (%)
Place of birth for the foreign-born population - Somalia (%)
Place of birth for the foreign-born population - Uganda (%)
Place of birth for the foreign-born population - Zimbabwe (%)
Place of birth for the foreign-born population - Other Eastern Africa (%)
Place of birth for the foreign-born population - Cameroon (%)
Place of birth for the foreign-born population - Congo (%)
Place of birth for the foreign-born population - Democratic Republic of Congo (Zaire) (%)
Place of birth for the foreign-born population - Other Middle Africa (%)
Place of birth for the foreign-born population - Egypt (%)
Place of birth for the foreign-born population - Morocco (%)
Place of birth for the foreign-born population - Sudan (%)
Place of birth for the foreign-born population - Other Northern Africa (%)
Place of birth for the foreign-born population - South Africa (%)
Place of birth for the foreign-born population - Other Southern Africa (%)
Place of birth for the foreign-born population - Cabo Verde (%)
Place of birth for the foreign-born population - Ghana (%)
Place of birth for the foreign-born population - Liberia (%)
Place of birth for the foreign-born population - Nigeria (%)
Place of birth for the foreign-born population - Senegal (%)
Place of birth for the foreign-born population - Sierra Leone (%)
Place of birth for the foreign-born population - Other Western Africa (%)
Place of birth for the foreign-born population - Australia (%)
Place of birth for the foreign-born population - New Zealand (%)
Place of birth for the foreign-born population - Fiji (%)
Place of birth for the foreign-born population - Micronesia (%)
Place of birth for the foreign-born population - Bahamas (%)
Place of birth for the foreign-born population - Barbados (%)
Place of birth for the foreign-born population - Cuba (%)
Place of birth for the foreign-born population - Dominica (%)
Place of birth for the foreign-born population - Dominican Republic (%)
Place of birth for the foreign-born population - Grenada (%)
Place of birth for the foreign-born population - Haiti (%)
Place of birth for the foreign-born population - Jamaica (%)
Place of birth for the foreign-born population - St. Vincent and the Grenadines (%)
Place of birth for the foreign-born population - Trinidad and Tobago (%)
Place of birth for the foreign-born population - West Indies (%)
Place of birth for the foreign-born population - Other Caribbean (%)
Place of birth for the foreign-born population - Belize (%)
Place of birth for the foreign-born population - Costa Rica (%)
Place of birth for the foreign-born population - El Salvador (%)
Place of birth for the foreign-born population - Guatemala (%)
Place of birth for the foreign-born population - Honduras (%)
Place of birth for the foreign-born population - Mexico (%)
Place of birth for the foreign-born population - Nicaragua (%)
Place of birth for the foreign-born population - Panama (%)
Place of birth for the foreign-born population - Other Central America (%)
Place of birth for the foreign-born population - Argentina (%)
Place of birth for the foreign-born population - Bolivia (%)
Place of birth for the foreign-born population - Brazil (%)
Place of birth for the foreign-born population - Chile (%)
Place of birth for the foreign-born population - Colombia (%)
Place of birth for the foreign-born population - Ecuador (%)
Place of birth for the foreign-born population - Guyana (%)
Place of birth for the foreign-born population - Peru (%)
Place of birth for the foreign-born population - Uruguay (%)
Place of birth for the foreign-born population - Venezuela (%)
Place of birth for the foreign-born population - Other South America (%)
Place of birth for the foreign-born population - Canada (%)
Place of birth for the foreign-born population - Other Northern America (%)
Place of birth for the foreign-born population - Other (%)
Latest news about races in Fulshear, TX collected exclusively by city-data.com from local newspapers, TV, and radio stations
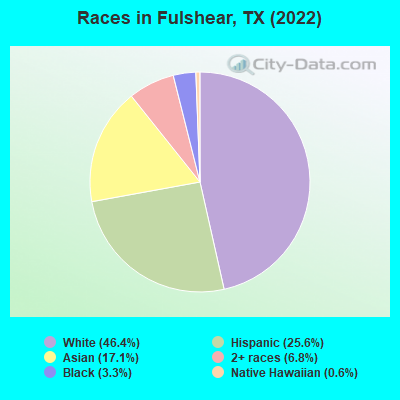
According to 2022 data, the most numerous races in Fulshear, TX are Hispanic (5,882 residents), White alone (10,677 residents), and Black alone (757 residents). 62.3% of Fulshear residents speak English at home. 30.6% of Fulshear, TX residents are foreign-born (13.8% born in Latin America, 10.1% born in Asia, 5.1% born in Africa), which is 44.5% greater than the foreign-born rate of 17.0% across the entire state of Texas.
Race distribution in Fulshear
2000 2022
10,933,313 52.4% White alone 6,669,666 32.0% Hispanic 2,364,255 11.3% Black alone 554,445 2.7% Asian alone 230,567 1.1% Two or more races 68,859 0.3% American Indian alone 19,958 0.10% Other race alone 10,757 0.05% Native Hawaiian and Other
12,070,642 40.2% Hispanic 11,683,430 38.9% White alone 3,508,706 11.7% Black alone 1,608,173 5.4% Asian alone 956,560 3.2% Two or more races 125,763 0.4% Other race alone 47,023 0.2% American Indian alone 29,275 0.10% Native Hawaiian and Other
Income and house value in Fulshear Median household income in 2022 $161,211 White non-Hispanic householders$184,992 Asian householders$161,928 Some other race householders$147,434 Two or more races householders$146,752 Hispanic or Latino race householdersMedian 2022 house value $983,556 White Non-Hispanic householders$157,110 Black or African American householders$53,799 Some other race householdersover $1,000,000 Two or more races householders$94,158 Hispanic or Latino householders
Median age by race in Fulshear
40.7 Median age for White residents41.0 40.6 50.1 Median age for Black or African American residents38.9 50.3 22.2 Median age for American Indian / Alaska Native residents21.3 -762,172,283.9 39.2 Median age for Asian residents43.7 34.2 0.0 Median age for Native Hawaiian / Pacific Islander residents-612,729,233.5 -577,777,777.2 39.0 Median age for Other race residents30.1 39.6 18.1 Median age for Two or more races residents39.2 18.2 40.8 Median age for White alone residents38.5 44.7 32.6 Median age for Hispanic or Latino residents39.1 20.7
Owner/renter occupied households by race in Fulshear
House owners and renters - White residents 3,563 92.9% Owner occupied271 7.1% Renter occupiedHouse owners and renters - Black or African American residents 186 100.0% Owner occupiedHouse owners and renters - American Indian / Alaska Native residents 43 100.0% Owner occupiedHouse owners and renters - Asian residents 1,130 100.0% Owner occupiedHouse owners and renters - Other race residents 405 76.2% Owner occupied126 23.8% Renter occupiedHouse owners and renters - Two or more races residents 1,273 100.0% Owner occupiedHouse owners and renters - White alone residents 3,294 91.5% Owner occupied306 8.5% Renter occupiedHouse owners and renters - Hispanic or Latino residents 1,579 92.4% Owner occupied131 7.6% Renter occupied
Language usage in Fulshear
English speakers - Total 62.3% of residents of Fulshear speak English at home.
21.2% of residents speak Spanish at home 4,031 86.0% Speak English very well657 14.0% Speak English less than very well16.7% of residents speak other language at home 3,099 83.8% Speak English very well600 16.2% Speak English less than very well
English speakers - Born in the United States 91.3% of residents of Fulshear speak English at home.
5.8% of residents speak Spanish at home 366 89.1% Speak English very well45 10.9% Speak English less than very well3.0% of residents speak other language at home 211 100.0% Speak English very well
English speakers - Native, born elsewhere 30.9% of residents of Fulshear speak English at home.
46.6% of residents speak Spanish at home 302 100.0% Speak English very well9.9% of residents speak other language at home 64 100.0% Speak English very well
English speakers - Foreign-born 16.3% of residents of Fulshear speak English at home.
34.2% of residents speak Spanish at home 2,004 81.1% Speak English very well466 18.9% Speak English less than very well48.1% of residents speak other language at home 2,875 82.7% Speak English very well603 17.3% Speak English less than very well
White (Caucasian) - Speak only English Native:
97.9% (9,428)Foreign-born:
35.5% (350)
White (Caucasian) - Speak another language Native:
4.8% (458)Foreign-born:
66.3% (654)
Black or African American - Speak only English Native:
100.0% (459)Foreign-born:
3.1% (7)
Asian - Speak only English Native:
81.9% (969)Foreign-born:
29.1% (750)
Asian - Speak another language Native:
18.4% (218)Foreign-born:
72.5% (1,868)
Other race - Speak only English Native:
11.4% (50)Foreign-born:
1.2% (11)
Other race - Speak another language Native:
92.7% (403)Foreign-born:
92.2% (855)
Two or more races - Speak another language Native:
62.7% (1,370)Foreign-born:
94.8% (3,226)
White alone - Speak only English Native:
98.8% (9,382)Foreign-born:
48.0% (344)
White alone - Speak another language Native:
1.4% (130)Foreign-born:
52.7% (377)
Hispanic or Latino - Speak only English Native:
34.4% (1,057)Foreign-born:
5.8% (158)
Hispanic or Latino - Speak another language Native:
67.1% (2,061)Foreign-born:
92.4% (2,495)
Foreign-born residents in Fulshear 7,052 residents are foreign born (13.8% Latin America , 10.1% Asia , 5.1% Africa ).
This city:
30.6%Texas:
17.1%
Marital status for residents in Fulshear Marital status - White (Caucasian) population 15 years and over
Males 21.6% Never married75.2% Now married0.1% Separated0.2% Widowed2.9% DivorcedFemales 24.9% Never married68.7% Now married0.0% Separated3.6% Widowed2.8% DivorcedWomen who gave birth in the past 12 months Now married:
100.0% (101)Unmarried:
0.0% (0)
Women who did not give birth in the past 12 months Now married:
61.6% (1,457)Unmarried:
38.4% (908)
Marital status - Black or African American population 15 years and over
Males 14.0% Never married85.6% Now married0.0% Separated0.0% Widowed0.4% DivorcedFemales 0.0% Never married100.0% Now married0.0% Separated0.0% Widowed0.0% DivorcedWomen who did not give birth in the past 12 months Now married:
100.0% (247)Unmarried:
0.0% (0)
Marital status - American Indian / Alaska Native population 15 years and over
Males 43.3% Never married56.7% Now married0.0% Separated0.0% Widowed0.0% DivorcedFemales 0.0% Never married100.0% Now married0.0% Separated0.0% Widowed0.0% DivorcedWomen who did not give birth in the past 12 months Now married:
100.0% (43)Unmarried:
0.0% (0)
Marital status - Asian population 15 years and over
Males 16.1% Never married83.9% Now married0.0% Separated0.0% Widowed0.0% DivorcedFemales 22.3% Never married69.5% Now married0.0% Separated6.0% Widowed2.2% DivorcedWomen who did not give birth in the past 12 months Now married:
75.3% (1,062)Unmarried:
24.7% (349)
Marital status - Other race population 15 years and over
Males 50.4% Never married49.6% Now married0.0% Separated0.0% Widowed0.0% DivorcedFemales 20.0% Never married80.0% Now married0.0% Separated0.0% Widowed0.0% DivorcedWomen who did not give birth in the past 12 months Now married:
76.6% (416)Unmarried:
23.4% (127)
Marital status - Two or more races population 15 years and over
Males 1.2% Never married98.8% Now married0.0% Separated0.0% Widowed0.0% DivorcedFemales 29.9% Never married70.1% Now married0.0% Separated0.0% Widowed0.0% DivorcedWomen who did not give birth in the past 12 months Now married:
55.8% (615)Unmarried:
44.2% (487)
Marital status - White alone, not Hispanic / Latino population 15 years and over
Males 21.5% Never married75.5% Now married0.1% Separated0.3% Widowed2.6% DivorcedFemales 17.4% Never married74.7% Now married0.0% Separated4.4% Widowed3.6% DivorcedWomen who gave birth in the past 12 months Now married:
100.0% (96)Unmarried:
0.0% (0)
Women who did not give birth in the past 12 months Now married:
70.7% (1,362)Unmarried:
29.3% (564)
Marital status - Hispanic or Latino population 15 years and over
Males 28.0% Never married70.0% Now married0.0% Separated0.0% Widowed2.0% DivorcedFemales 33.5% Never married65.9% Now married0.0% Separated0.6% Widowed0.0% DivorcedWomen who gave birth in the past 12 months Now married:
100.0% (30)Unmarried:
0.0% (0)
Women who did not give birth in the past 12 months Now married:
60.9% (1,179)Unmarried:
39.1% (756)
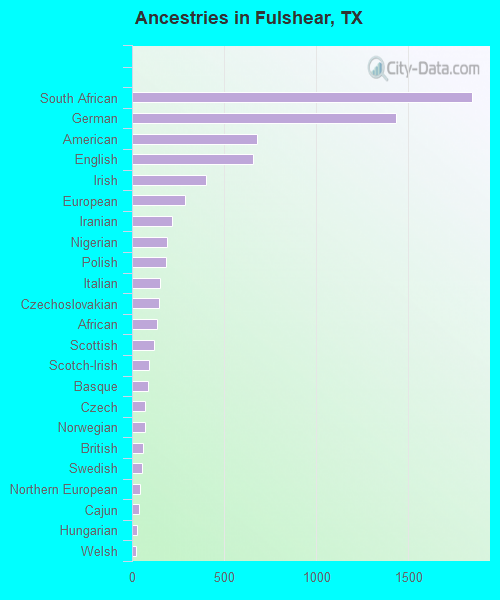
Ancestries in Fulshear
1,847 14.1% South African1,436 10.9% German677 5.2% American659 5.0% English402 3.1% Irish288 2.2% European215 1.6% Iranian188 1.4% Nigerian183 1.4% Polish150 1.1% Italian146 1.1% Czechoslovakian134 1.0% African118 0.9% Scottish94 0.7% Scotch-Irish89 0.7% Basque71 0.5% Czech68 0.5% Norwegian60 0.5% British57 0.4% Swedish41 0.3% Northern European36 0.3% Cajun27 0.2% Hungarian20 0.2% Welsh16 0.1% Dutch16 0.1% French12 0.09% Canadian10 0.08% Lithuanian9 0.07% Slavic4 0.03% Danish
Geographical mobility in Fulshear Same house 1 year ago 9,855 90.9% White (Caucasian)793 100.0% Black or African American206 100.0% American Indian / Alaska Native3,591 91.1% Asian45 98.2% Native Hawaiian / Pacific Islander1,403 96.8% Other race3,689 69.2% Two or more races9,850 93.2% White alone, not Hispanic / Latino4,257 72.2% Hispanic or LatinoMoved within same county 211 1.9% White / Caucasian3 0.4% Black or African American164 4.2% Asian1,353 25.4% Two or more races153 1.5% White alone, not Hispanic / Latino1,199 20.3% Hispanic or LatinoMoved within same state 545 5.0% White / Caucasian49 1.2% Asian248 2.4% White alone, not Hispanic / Latino282 4.8% Hispanic or LatinoMoved from different state 228 2.1% White / Caucasian10 0.7% Other race41 0.8% Two or more races226 2.1% White alone, not Hispanic / Latino46 0.8% Hispanic or LatinoMoved from abroad 78 2.0% Asian
Children Nativity (place of birth) in Fulshear
Children under 6 years - Living with two parents Both parents native 445 100.0% NativeBoth parents foreign-born 215 98.8% Native3 1.2% Foreign-bornOne native, one foreign-born parent 116 56.9% Native88 43.1% Foreign-bornChildren under 6 years - Living with one parent Native parent 10 100.0% NativeChildren 6 to 17 years - Living with two parents Both parents native 2,616 100.0% NativeBoth parents foreign-born 1,195 45.5% Native1,434 54.5% Foreign-bornOne native, one foreign-born parent 434 100.0% NativeChildren 6 to 17 years - Living with one parent Native parent 371 100.0% NativeForeign-born parent 239 51.2% Native228 48.8% Foreign-born