Races in Galesburg, Illinois (IL) Detailed Stats
Data:
Races - White alone (%)
Races - White alone (% change since 2000)
Races - Black alone (%)
Races - Black alone (% change since 2000)
Races - American Indian alone (%)
Races - American Indian alone (% change since 2000)
Races - Asian alone (%)
Races - Asian alone (% change since 2000)
Races - Hispanic (%)
Races - Hispanic (% change since 2000)
Races - Native Hawaiian and Other Pacific Islander alone (%)
Races - Native Hawaiian and Other Pacific Islander alone (% change since 2000)
Races - Two or more races(%)
Races - Two or more races(% change since 2000)
Races - Other race alone (%)
Races - Other race alone (% change since 2000)
Racial diversity
Place of birth - Born in state of residence (%)
Place of birth - Born in state of residence (%) - White
Place of birth - Born in state of residence (%) - Black or African American
Place of birth - Born in state of residence (%) - Asian
Place of birth - Born in state of residence (%) - Hispanic or Latino
Place of birth - Born in state of residence (%) - American Indian and Alaska Native
Place of birth - Born in state of residence (%) - Multirace
Place of birth - Born in state of residence (%) - Other Race
Place of birth - Born in other state (%)
Place of birth - Born in other state (%) - White
Place of birth - Born in other state (%) - Black or African American
Place of birth - Born in other state (%) - Asian
Place of birth - Born in other state (%) - Hispanic or Latino
Place of birth - Born in other state (%) - American Indian and Alaska Native
Place of birth - Born in other state (%) - Multirace
Place of birth - Born in other state (%) - Other Race
Place of birth - Native, outside of US (%)
Place of birth - Native, outside of US (%) - White
Place of birth - Native, outside of US (%) - Black or African American
Place of birth - Native, outside of US (%) - Asian
Place of birth - Native, outside of US (%) - Hispanic or Latino
Place of birth - Native, outside of US (%) - American Indian and Alaska Native
Place of birth - Native, outside of US (%) - Multirace
Place of birth - Native, outside of US (%) - Other Race
Place of birth - Foreign born (%)
Place of birth - Foreign born (%) - White
Place of birth - Foreign born (%) - Black or African American
Place of birth - Foreign born (%) - Asian
Place of birth - Foreign born (%) - Hispanic or Latino
Place of birth - Foreign born (%) - American Indian and Alaska Native
Place of birth - Foreign born (%) - Multirace
Place of birth - Foreign born (%) - Other Race
Residents speaking English at home (%)
Residents speaking English at home - Born in the United States (%)
Residents speaking English at home - Native, born elsewhere (%)
Residents speaking English at home - Foreign born (%)
Residents speaking Spanish at home (%)
Residents speaking Spanish at home - Born in the United States (%)
Residents speaking Spanish at home - Native, born elsewhere (%)
Residents speaking Spanish at home - Foreign born (%)
Residents speaking other language at home (%)
Residents speaking other language at home - Born in the United States (%)
Residents speaking other language at home - Native, born elsewhere (%)
Residents speaking other language at home - Foreign born (%)
Marital status - Never married (%)
Marital status - Now married (%)
Marital status - Separated (%)
Marital status - Widowed (%)
Marital status - Divorced (%)
Ancestries Reported - Arab (%)
Ancestries Reported - Czech (%)
Ancestries Reported - Danish (%)
Ancestries Reported - Dutch (%)
Ancestries Reported - English (%)
Ancestries Reported - French (%)
Ancestries Reported - French Canadian (%)
Ancestries Reported - German (%)
Ancestries Reported - Greek (%)
Ancestries Reported - Hungarian (%)
Ancestries Reported - Irish (%)
Ancestries Reported - Italian (%)
Ancestries Reported - Lithuanian (%)
Ancestries Reported - Norwegian (%)
Ancestries Reported - Polish (%)
Ancestries Reported - Portuguese (%)
Ancestries Reported - Russian (%)
Ancestries Reported - Scotch-Irish (%)
Ancestries Reported - Scottish (%)
Ancestries Reported - Slovak (%)
Ancestries Reported - Subsaharan African (%)
Ancestries Reported - Swedish (%)
Ancestries Reported - Swiss (%)
Ancestries Reported - Ukrainian (%)
Ancestries Reported - United States (%)
Ancestries Reported - Welsh (%)
Ancestries Reported - West Indian (%)
Ancestries Reported - Other (%)
Geographical mobility - Same house 1 year ago (%)
Geographical mobility - Same house 1 year ago (%) - White
Geographical mobility - Same house 1 year ago (%) - Black or African American
Geographical mobility - Same house 1 year ago (%) - Asian
Geographical mobility - Same house 1 year ago (%) - Hispanic or Latino
Geographical mobility - Same house 1 year ago (%) - American Indian and Alaska Native
Geographical mobility - Same house 1 year ago (%) - Multirace
Geographical mobility - Same house 1 year ago (%) - Other Race
Geographical mobility - Moved within same county (%)
Geographical mobility - Moved within same county (%) - White
Geographical mobility - Moved within same county (%) - Black or African American
Geographical mobility - Moved within same county (%) - Asian
Geographical mobility - Moved within same county (%) - Hispanic or Latino
Geographical mobility - Moved within same county (%) - American Indian and Alaska Native
Geographical mobility - Moved within same county (%) - Multirace
Geographical mobility - Moved within same county (%) - Other Race
Geographical mobility - Moved from different county within same state (%)
Geographical mobility - Moved from different county within same state (%) - White
Geographical mobility - Moved from different county within same state (%) - Black or African American
Geographical mobility - Moved from different county within same state (%) - Asian
Geographical mobility - Moved from different county within same state (%) - Hispanic or Latino
Geographical mobility - Moved from different county within same state (%) - American Indian and Alaska Native
Geographical mobility - Moved from different county within same state (%) - Multirace
Geographical mobility - Moved from different county within same state (%) - Other Race
Geographical mobility - Moved from different state (%)
Geographical mobility - Moved from different state (%) - White
Geographical mobility - Moved from different state (%) - Black or African American
Geographical mobility - Moved from different state (%) - Asian
Geographical mobility - Moved from different state (%) - Hispanic or Latino
Geographical mobility - Moved from different state (%) - American Indian and Alaska Native
Geographical mobility - Moved from different state (%) - Multirace
Geographical mobility - Moved from different state (%) - Other Race
Geographical mobility - Moved from abroad (%)
Geographical mobility - Moved from abroad (%) - White
Geographical mobility - Moved from abroad (%) - Black or African American
Geographical mobility - Moved from abroad (%) - Asian
Geographical mobility - Moved from abroad (%) - Hispanic or Latino
Geographical mobility - Moved from abroad (%) - American Indian and Alaska Native
Geographical mobility - Moved from abroad (%) - Multirace
Geographical mobility - Moved from abroad (%) - Other Race
Place of birth for the foreign-born population - Ireland (%)
Place of birth for the foreign-born population - Denmark (%)
Place of birth for the foreign-born population - Norway (%)
Place of birth for the foreign-born population - Sweden (%)
Place of birth for the foreign-born population - United Kingdom (%)
Place of birth for the foreign-born population - England (%)
Place of birth for the foreign-born population - Scotland (%)
Place of birth for the foreign-born population - Other Northern Europe (%)
Place of birth for the foreign-born population - Austria (%)
Place of birth for the foreign-born population - Belgium (%)
Place of birth for the foreign-born population - France (%)
Place of birth for the foreign-born population - Germany (%)
Place of birth for the foreign-born population - Netherlands (%)
Place of birth for the foreign-born population - Switzerland (%)
Place of birth for the foreign-born population - Other Western Europe (%)
Place of birth for the foreign-born population - Greece (%)
Place of birth for the foreign-born population - Italy (%)
Place of birth for the foreign-born population - Portugal (%)
Place of birth for the foreign-born population - Spain (%)
Place of birth for the foreign-born population - Other Southern Europe (%)
Place of birth for the foreign-born population - Albania (%)
Place of birth for the foreign-born population - Belarus (%)
Place of birth for the foreign-born population - Bosnia and Herzegovina (%)
Place of birth for the foreign-born population - Bulgaria (%)
Place of birth for the foreign-born population - Croatia (%)
Place of birth for the foreign-born population - Czechoslovakia (%)
Place of birth for the foreign-born population - Hungary (%)
Place of birth for the foreign-born population - Latvia (%)
Place of birth for the foreign-born population - Lithuania (%)
Place of birth for the foreign-born population - North Macedonia (Macedonia) (%)
Place of birth for the foreign-born population - Moldova (%)
Place of birth for the foreign-born population - Poland (%)
Place of birth for the foreign-born population - Romania (%)
Place of birth for the foreign-born population - Russia (%)
Place of birth for the foreign-born population - Serbia (%)
Place of birth for the foreign-born population - Ukraine (%)
Place of birth for the foreign-born population - Other Eastern Europe (%)
Place of birth for the foreign-born population - China (%)
Place of birth for the foreign-born population - Hong Kong (%)
Place of birth for the foreign-born population - Taiwan (%)
Place of birth for the foreign-born population - Japan (%)
Place of birth for the foreign-born population - Korea (%)
Place of birth for the foreign-born population - Other Eastern Asia (%)
Place of birth for the foreign-born population - Afghanistan (%)
Place of birth for the foreign-born population - Bangladesh (%)
Place of birth for the foreign-born population - India (%)
Place of birth for the foreign-born population - Iran (%)
Place of birth for the foreign-born population - Kazakhstan (%)
Place of birth for the foreign-born population - Nepal (%)
Place of birth for the foreign-born population - Pakistan (%)
Place of birth for the foreign-born population - Sri Lanka (%)
Place of birth for the foreign-born population - Uzbekistan (%)
Place of birth for the foreign-born population - Other South Central Asia (%)
Place of birth for the foreign-born population - Burma (%)
Place of birth for the foreign-born population - Cambodia (%)
Place of birth for the foreign-born population - Indonesia (%)
Place of birth for the foreign-born population - Laos (%)
Place of birth for the foreign-born population - Malaysia (%)
Place of birth for the foreign-born population - Philippines (%)
Place of birth for the foreign-born population - Singapore (%)
Place of birth for the foreign-born population - Thailand (%)
Place of birth for the foreign-born population - Vietnam (%)
Place of birth for the foreign-born population - Other South Eastern Asia (%)
Place of birth for the foreign-born population - Armenia (%)
Place of birth for the foreign-born population - Iraq (%)
Place of birth for the foreign-born population - Israel (%)
Place of birth for the foreign-born population - Jordan (%)
Place of birth for the foreign-born population - Kuwait (%)
Place of birth for the foreign-born population - Lebanon (%)
Place of birth for the foreign-born population - Saudi Arabia (%)
Place of birth for the foreign-born population - Syria (%)
Place of birth for the foreign-born population - Turkey (%)
Place of birth for the foreign-born population - Yemen (%)
Place of birth for the foreign-born population - Other Western Asia (%)
Place of birth for the foreign-born population - Eritrea (%)
Place of birth for the foreign-born population - Ethiopia (%)
Place of birth for the foreign-born population - Kenya (%)
Place of birth for the foreign-born population - Somalia (%)
Place of birth for the foreign-born population - Uganda (%)
Place of birth for the foreign-born population - Zimbabwe (%)
Place of birth for the foreign-born population - Other Eastern Africa (%)
Place of birth for the foreign-born population - Cameroon (%)
Place of birth for the foreign-born population - Congo (%)
Place of birth for the foreign-born population - Democratic Republic of Congo (Zaire) (%)
Place of birth for the foreign-born population - Other Middle Africa (%)
Place of birth for the foreign-born population - Egypt (%)
Place of birth for the foreign-born population - Morocco (%)
Place of birth for the foreign-born population - Sudan (%)
Place of birth for the foreign-born population - Other Northern Africa (%)
Place of birth for the foreign-born population - South Africa (%)
Place of birth for the foreign-born population - Other Southern Africa (%)
Place of birth for the foreign-born population - Cabo Verde (%)
Place of birth for the foreign-born population - Ghana (%)
Place of birth for the foreign-born population - Liberia (%)
Place of birth for the foreign-born population - Nigeria (%)
Place of birth for the foreign-born population - Senegal (%)
Place of birth for the foreign-born population - Sierra Leone (%)
Place of birth for the foreign-born population - Other Western Africa (%)
Place of birth for the foreign-born population - Australia (%)
Place of birth for the foreign-born population - New Zealand (%)
Place of birth for the foreign-born population - Fiji (%)
Place of birth for the foreign-born population - Micronesia (%)
Place of birth for the foreign-born population - Bahamas (%)
Place of birth for the foreign-born population - Barbados (%)
Place of birth for the foreign-born population - Cuba (%)
Place of birth for the foreign-born population - Dominica (%)
Place of birth for the foreign-born population - Dominican Republic (%)
Place of birth for the foreign-born population - Grenada (%)
Place of birth for the foreign-born population - Haiti (%)
Place of birth for the foreign-born population - Jamaica (%)
Place of birth for the foreign-born population - St. Vincent and the Grenadines (%)
Place of birth for the foreign-born population - Trinidad and Tobago (%)
Place of birth for the foreign-born population - West Indies (%)
Place of birth for the foreign-born population - Other Caribbean (%)
Place of birth for the foreign-born population - Belize (%)
Place of birth for the foreign-born population - Costa Rica (%)
Place of birth for the foreign-born population - El Salvador (%)
Place of birth for the foreign-born population - Guatemala (%)
Place of birth for the foreign-born population - Honduras (%)
Place of birth for the foreign-born population - Mexico (%)
Place of birth for the foreign-born population - Nicaragua (%)
Place of birth for the foreign-born population - Panama (%)
Place of birth for the foreign-born population - Other Central America (%)
Place of birth for the foreign-born population - Argentina (%)
Place of birth for the foreign-born population - Bolivia (%)
Place of birth for the foreign-born population - Brazil (%)
Place of birth for the foreign-born population - Chile (%)
Place of birth for the foreign-born population - Colombia (%)
Place of birth for the foreign-born population - Ecuador (%)
Place of birth for the foreign-born population - Guyana (%)
Place of birth for the foreign-born population - Peru (%)
Place of birth for the foreign-born population - Uruguay (%)
Place of birth for the foreign-born population - Venezuela (%)
Place of birth for the foreign-born population - Other South America (%)
Place of birth for the foreign-born population - Canada (%)
Place of birth for the foreign-born population - Other Northern America (%)
Place of birth for the foreign-born population - Other (%)
Latest news about races in Galesburg, IL collected exclusively by city-data.com from local newspapers, TV, and radio stations
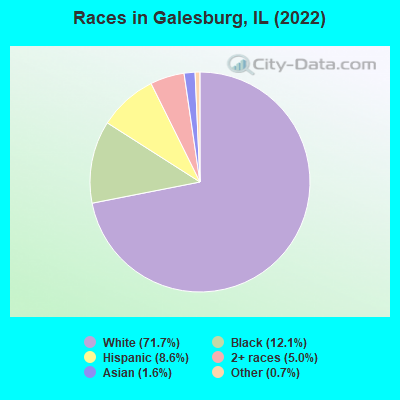
According to 2022 data, the most numerous races in Galesburg, IL are White alone (21,156 residents), Hispanic (2,530 residents), and Black alone (3,583 residents). 89.8% of Galesburg residents speak English at home. 5.3% of Galesburg, IL residents are foreign-born (2.0% born in Latin America, 1.4% born in Africa, 1.4% born in Asia), which is 165.7% less than the foreign-born rate of 14.0% across the entire state of Illinois.
Race distribution in Galesburg
2000 2022
8,424,140 67.8% White alone 1,856,152 14.9% Black alone 1,530,262 12.3% Hispanic 419,916 3.4% Asian alone 153,996 1.2% Two or more races 13,479 0.1% Other race alone 18,232 0.1% American Indian alone 3,116 0.03% Native Hawaiian and Other
7,356,301 58.5% White alone 2,299,726 18.3% Hispanic 1,660,423 13.2% Black alone 747,296 5.9% Asian alone 458,599 3.6% Two or more races 45,386 0.4% Other race alone 10,405 0.08% American Indian alone 3,896 0.03% Native Hawaiian and Other
Income and house value in Galesburg Median household income in 2022 $42,485 White non-Hispanic householders$22,174 Black householders$37,073 Some other race householders$44,709 Two or more races householders$43,446 Hispanic or Latino race householdersMedian 2022 house value $93,919 White Non-Hispanic householders$73,488 Black or African American householders$171,524 American Indian or Alaska Native householders $241,353 Asian householders$60,376 Some other race householders$58,089 Two or more races householders$74,403 Hispanic or Latino householders
Median age by race in Galesburg
49.2 Median age for White residents47.4 52.7 31.9 Median age for Black or African American residents32.3 29.7 48.1 Median age for American Indian / Alaska Native residents49.7 -688,956,432.9 22.7 Median age for Asian residents22.1 31.8 -593,236,714.4 Median age for Native Hawaiian / Pacific Islander residents-658,536,584.7 -576,015,108.0 33.8 Median age for Other race residents22.2 36.8 20.3 Median age for Two or more races residents19.7 20.5 49.4 Median age for White alone residents47.1 52.3 29.7 Median age for Hispanic or Latino residents28.7 30.1
Owner/renter occupied households by race in Galesburg
House owners and renters - White residents 6,639 64.4% Owner occupied3,672 35.6% Renter occupiedHouse owners and renters - Black or African American residents 184 24.1% Owner occupied579 75.9% Renter occupiedHouse owners and renters - American Indian / Alaska Native residents 4 100.0% Renter occupiedHouse owners and renters - Asian residents 17 28.4% Owner occupied43 71.6% Renter occupiedHouse owners and renters - Other race residents 348 55.7% Owner occupied277 44.3% Renter occupiedHouse owners and renters - Two or more races residents 355 48.0% Owner occupied384 52.0% Renter occupiedHouse owners and renters - White alone residents 6,714 63.5% Owner occupied3,863 36.5% Renter occupiedHouse owners and renters - Hispanic or Latino residents 450 68.4% Owner occupied208 31.6% Renter occupied
Language usage in Galesburg
English speakers - Total 89.8% of residents of Galesburg speak English at home.
5.8% of residents speak Spanish at home 1,064 65.5% Speak English very well561 34.5% Speak English less than very well4.1% of residents speak other language at home 621 53.9% Speak English very well531 46.1% Speak English less than very well
English speakers - Born in the United States 92.7% of residents of Galesburg speak English at home.
5.5% of residents speak Spanish at home 266 90.8% Speak English very well27 9.2% Speak English less than very well1.6% of residents speak other language at home 84 100.0% Speak English very well
English speakers - Native, born elsewhere 20.0% of residents of Galesburg speak English at home.
70.8% of residents speak Spanish at home 210 97.2% Speak English very well6 2.8% Speak English less than very well10.5% of residents speak other language at home 32 100.0% Speak English very well
English speakers - Foreign-born 11.7% of residents of Galesburg speak English at home.
32.3% of residents speak Spanish at home 75 14.9% Speak English very well428 85.1% Speak English less than very well55.9% of residents speak other language at home 338 38.9% Speak English very well532 61.1% Speak English less than very well
White (Caucasian) - Speak only English Native:
99.1% (20,121)Foreign-born:
16.8% (23)
White (Caucasian) - Speak another language Native:
2.2% (447)Foreign-born:
83.1% (112)
Black or African American - Speak only English Native:
96.0% (2,753)Foreign-born:
1.9% (7)
Black or African American - Speak another language Native:
4.0% (114)Foreign-born:
93.5% (355)
Asian - Speak only English Native:
55.2% (35)Foreign-born:
4.0% (16)
Asian - Speak another language Native:
44.7% (28)Foreign-born:
97.2% (390)
Other race - Speak only English Native:
34.3% (291)Foreign-born:
19.4% (101)
Other race - Speak another language Native:
66.3% (563)Foreign-born:
80.8% (423)
Two or more races - Speak only English Native:
91.3% (1,865)Foreign-born:
46.4% (79)
Two or more races - Speak another language Native:
6.9% (140)Foreign-born:
51.5% (88)
White alone - Speak only English Native:
97.5% (19,932)Foreign-born:
25.3% (25)
White alone - Speak another language Native:
2.4% (493)Foreign-born:
74.1% (73)
Hispanic or Latino - Speak only English Native:
57.8% (1,000)Foreign-born:
9.9% (55)
Hispanic or Latino - Speak another language Native:
43.2% (747)Foreign-born:
90.0% (501)
Foreign-born residents in Galesburg 1,555 residents are foreign born (2.0% Latin America , 1.4% Africa , 1.4% Asia ).
This city:
5.3%Illinois:
14.1%
Marital status for residents in Galesburg Marital status - White (Caucasian) population 15 years and over
Males 39.6% Never married38.9% Now married1.2% Separated4.1% Widowed16.2% DivorcedFemales 30.6% Never married39.1% Now married0.7% Separated14.2% Widowed15.5% DivorcedWomen who gave birth in the past 12 months Now married:
56.1% (90)Unmarried:
43.9% (71)
Women who did not give birth in the past 12 months Now married:
34.4% (1,304)Unmarried:
65.6% (2,489)
Marital status - Black or African American population 15 years and over
Males 76.9% Never married12.9% Now married1.4% Separated1.5% Widowed7.4% DivorcedFemales 48.7% Never married20.2% Now married0.0% Separated11.0% Widowed20.1% DivorcedWomen who gave birth in the past 12 months Now married:
48.6% (16)Unmarried:
51.4% (17)
Women who did not give birth in the past 12 months Now married:
16.8% (83)Unmarried:
83.2% (412)
Marital status - American Indian / Alaska Native population 15 years and over
Males 16.7% Never married83.3% Now married0.0% Separated0.0% Widowed0.0% DivorcedFemales 50.0% Never married50.0% Now married0.0% Separated0.0% Widowed0.0% DivorcedWomen who gave birth in the past 12 months Now married:
0.0% (0)Unmarried:
100.0% (7)
Marital status - Asian population 15 years and over
Males 76.9% Never married23.1% Now married0.0% Separated0.0% Widowed0.0% DivorcedFemales 49.0% Never married48.5% Now married0.0% Separated2.5% Widowed0.0% DivorcedWomen who gave birth in the past 12 months Now married:
56.7% (17)Unmarried:
43.3% (13)
Women who did not give birth in the past 12 months Now married:
18.4% (19)Unmarried:
81.6% (85)
Marital status - Other race population 15 years and over
Males 73.9% Never married20.8% Now married0.0% Separated5.1% Widowed0.2% DivorcedFemales 44.3% Never married37.6% Now married0.0% Separated10.2% Widowed7.9% DivorcedWomen who gave birth in the past 12 months Now married:
100.0% (24)Unmarried:
0.0% (0)
Women who did not give birth in the past 12 months Now married:
39.1% (127)Unmarried:
60.9% (198)
Marital status - Two or more races population 15 years and over
Males 51.7% Never married35.2% Now married0.0% Separated7.5% Widowed5.6% DivorcedFemales 49.9% Never married37.7% Now married0.0% Separated3.7% Widowed8.7% DivorcedWomen who gave birth in the past 12 months Now married:
84.3% (102)Unmarried:
15.7% (19)
Women who did not give birth in the past 12 months Now married:
11.2% (55)Unmarried:
88.8% (439)
Marital status - White alone, not Hispanic / Latino population 15 years and over
Males 38.5% Never married39.6% Now married1.2% Separated4.0% Widowed16.6% DivorcedFemales 29.8% Never married39.5% Now married0.7% Separated14.3% Widowed15.6% DivorcedWomen who gave birth in the past 12 months Now married:
58.7% (96)Unmarried:
41.3% (68)
Women who did not give birth in the past 12 months Now married:
34.9% (1,352)Unmarried:
65.1% (2,521)
Marital status - Hispanic or Latino population 15 years and over
Males 64.9% Never married25.8% Now married0.0% Separated7.2% Widowed2.1% DivorcedFemales 40.3% Never married38.8% Now married0.0% Separated8.8% Widowed12.1% DivorcedWomen who gave birth in the past 12 months Now married:
87.5% (92)Unmarried:
12.5% (13)
Women who did not give birth in the past 12 months Now married:
32.2% (150)Unmarried:
67.8% (316)
Ancestries in Galesburg
1,529 11.3% English1,529 11.3% German1,485 11.0% American1,354 10.0% Irish529 3.9% Swedish493 3.7% African232 1.7% European194 1.4% Scottish124 0.9% Norwegian117 0.9% Polish115 0.9% Italian69 0.5% Scotch-Irish49 0.4% Belgian41 0.3% French38 0.3% Scandinavian34 0.3% Eastern European32 0.2% Portuguese30 0.2% Greek28 0.2% British21 0.2% Northern European21 0.2% Czech19 0.1% French Canadian14 0.1% Dutch11 0.08% Armenian11 0.08% Ethiopian11 0.08% Ghanaian10 0.07% Pennsylvania German9 0.07% Yugoslavian8 0.06% Danish8 0.06% Croatian8 0.06% Austrian7 0.05% Lithuanian5 0.04% Israeli5 0.04% Celtic5 0.04% Hungarian3 0.02% Czechoslovakian3 0.02% Welsh2 0.01% Arab
Geographical mobility in Galesburg Same house 1 year ago 18,725 90.6% White (Caucasian)3,063 86.0% Black or African American25 79.8% American Indian / Alaska Native365 78.2% Asian1,155 84.2% Other race2,180 90.0% Two or more races19,164 90.8% White alone, not Hispanic / Latino2,108 88.3% Hispanic or LatinoMoved within same county 944 4.6% White / Caucasian29 0.8% Black or African American6 20.4% American Indian / Alaska Native37 2.7% Other race145 6.0% Two or more races987 4.7% White alone, not Hispanic / Latino79 3.3% Hispanic or LatinoMoved within same state 632 3.1% White / Caucasian522 14.6% Black or African American5 1.1% Asian18 1.3% Other race37 1.5% Two or more races574 2.7% White alone, not Hispanic / Latino116 4.9% Hispanic or LatinoMoved from different state 336 1.6% White / Caucasian16 0.5% Black or African American5 1.1% Asian70 5.1% Other race57 2.4% Two or more races334 1.6% White alone, not Hispanic / Latino98 4.1% Hispanic or LatinoMoved from abroad 43 0.2% White31 0.9% Black or African American92 19.6% Asian123 9.0% Other race47 0.2% White alone, not Hispanic / Latino
Children Nativity (place of birth) in Galesburg
Children under 6 years - Living with two parents Both parents native 645 100.0% NativeBoth parents foreign-born 173 100.0% NativeOne native, one foreign-born parent 20 100.0% NativeChildren under 6 years - Living with one parent Native parent 782 100.0% NativeForeign-born parent 62 100.0% NativeChildren 6 to 17 years - Living with two parents Both parents native 1,467 99.6% Native5 0.4% Foreign-bornBoth parents foreign-born 145 82.3% Native31 17.7% Foreign-bornOne native, one foreign-born parent 203 100.0% NativeChildren 6 to 17 years - Living with one parent Native parent 883 100.0% NativeForeign-born parent 165 67.3% Native80 32.7% Foreign-born
Grandparents responsible for own grandchildren in Galesburg
Grandparents (30 to 59 years) White / Caucasian 44 47.2% Responsible for grandchildren50 52.8% Not responsible for grandchildrenBlack or African American 7 100.0% Responsible for grandchildrenOther race 15 100.0% Responsible for grandchildrenWhite alone, not Hispanic / Latino 49 44.4% Responsible for grandchildren61 55.6% Not responsible for grandchildrenHispanic or Latino 10 100.0% Responsible for grandchildrenGrandparents (60 years and over) White / Caucasian 35 47.9% Responsible for grandchildren38 52.1% Not responsible for grandchildrenBlack or African American 4 100.0% Not responsible for grandchildrenOther race 5 100.0% Not responsible for grandchildrenWhite alone, not Hispanic / Latino 38 46.8% Responsible for grandchildren43 53.2% Not responsible for grandchildrenHispanic or Latino 6 100.0% Not responsible for grandchildren