Races in Galliano, Louisiana (LA) Detailed Stats
Data:
Races - White alone (%)
Races - White alone (% change since 2000)
Races - Black alone (%)
Races - Black alone (% change since 2000)
Races - American Indian alone (%)
Races - American Indian alone (% change since 2000)
Races - Asian alone (%)
Races - Asian alone (% change since 2000)
Races - Hispanic (%)
Races - Hispanic (% change since 2000)
Races - Native Hawaiian and Other Pacific Islander alone (%)
Races - Native Hawaiian and Other Pacific Islander alone (% change since 2000)
Races - Two or more races(%)
Races - Two or more races(% change since 2000)
Races - Other race alone (%)
Races - Other race alone (% change since 2000)
Racial diversity
Place of birth - Born in state of residence (%)
Place of birth - Born in state of residence (%) - White
Place of birth - Born in state of residence (%) - Black or African American
Place of birth - Born in state of residence (%) - Asian
Place of birth - Born in state of residence (%) - Hispanic or Latino
Place of birth - Born in state of residence (%) - American Indian and Alaska Native
Place of birth - Born in state of residence (%) - Multirace
Place of birth - Born in state of residence (%) - Other Race
Place of birth - Born in other state (%)
Place of birth - Born in other state (%) - White
Place of birth - Born in other state (%) - Black or African American
Place of birth - Born in other state (%) - Asian
Place of birth - Born in other state (%) - Hispanic or Latino
Place of birth - Born in other state (%) - American Indian and Alaska Native
Place of birth - Born in other state (%) - Multirace
Place of birth - Born in other state (%) - Other Race
Place of birth - Native, outside of US (%)
Place of birth - Native, outside of US (%) - White
Place of birth - Native, outside of US (%) - Black or African American
Place of birth - Native, outside of US (%) - Asian
Place of birth - Native, outside of US (%) - Hispanic or Latino
Place of birth - Native, outside of US (%) - American Indian and Alaska Native
Place of birth - Native, outside of US (%) - Multirace
Place of birth - Native, outside of US (%) - Other Race
Place of birth - Foreign born (%)
Place of birth - Foreign born (%) - White
Place of birth - Foreign born (%) - Black or African American
Place of birth - Foreign born (%) - Asian
Place of birth - Foreign born (%) - Hispanic or Latino
Place of birth - Foreign born (%) - American Indian and Alaska Native
Place of birth - Foreign born (%) - Multirace
Place of birth - Foreign born (%) - Other Race
Residents speaking English at home (%)
Residents speaking English at home - Born in the United States (%)
Residents speaking English at home - Native, born elsewhere (%)
Residents speaking English at home - Foreign born (%)
Residents speaking Spanish at home (%)
Residents speaking Spanish at home - Born in the United States (%)
Residents speaking Spanish at home - Native, born elsewhere (%)
Residents speaking Spanish at home - Foreign born (%)
Residents speaking other language at home (%)
Residents speaking other language at home - Born in the United States (%)
Residents speaking other language at home - Native, born elsewhere (%)
Residents speaking other language at home - Foreign born (%)
Marital status - Never married (%)
Marital status - Now married (%)
Marital status - Separated (%)
Marital status - Widowed (%)
Marital status - Divorced (%)
Ancestries Reported - Arab (%)
Ancestries Reported - Czech (%)
Ancestries Reported - Danish (%)
Ancestries Reported - Dutch (%)
Ancestries Reported - English (%)
Ancestries Reported - French (%)
Ancestries Reported - French Canadian (%)
Ancestries Reported - German (%)
Ancestries Reported - Greek (%)
Ancestries Reported - Hungarian (%)
Ancestries Reported - Irish (%)
Ancestries Reported - Italian (%)
Ancestries Reported - Lithuanian (%)
Ancestries Reported - Norwegian (%)
Ancestries Reported - Polish (%)
Ancestries Reported - Portuguese (%)
Ancestries Reported - Russian (%)
Ancestries Reported - Scotch-Irish (%)
Ancestries Reported - Scottish (%)
Ancestries Reported - Slovak (%)
Ancestries Reported - Subsaharan African (%)
Ancestries Reported - Swedish (%)
Ancestries Reported - Swiss (%)
Ancestries Reported - Ukrainian (%)
Ancestries Reported - United States (%)
Ancestries Reported - Welsh (%)
Ancestries Reported - West Indian (%)
Ancestries Reported - Other (%)
Geographical mobility - Same house 1 year ago (%)
Geographical mobility - Same house 1 year ago (%) - White
Geographical mobility - Same house 1 year ago (%) - Black or African American
Geographical mobility - Same house 1 year ago (%) - Asian
Geographical mobility - Same house 1 year ago (%) - Hispanic or Latino
Geographical mobility - Same house 1 year ago (%) - American Indian and Alaska Native
Geographical mobility - Same house 1 year ago (%) - Multirace
Geographical mobility - Same house 1 year ago (%) - Other Race
Geographical mobility - Moved within same county (%)
Geographical mobility - Moved within same county (%) - White
Geographical mobility - Moved within same county (%) - Black or African American
Geographical mobility - Moved within same county (%) - Asian
Geographical mobility - Moved within same county (%) - Hispanic or Latino
Geographical mobility - Moved within same county (%) - American Indian and Alaska Native
Geographical mobility - Moved within same county (%) - Multirace
Geographical mobility - Moved within same county (%) - Other Race
Geographical mobility - Moved from different county within same state (%)
Geographical mobility - Moved from different county within same state (%) - White
Geographical mobility - Moved from different county within same state (%) - Black or African American
Geographical mobility - Moved from different county within same state (%) - Asian
Geographical mobility - Moved from different county within same state (%) - Hispanic or Latino
Geographical mobility - Moved from different county within same state (%) - American Indian and Alaska Native
Geographical mobility - Moved from different county within same state (%) - Multirace
Geographical mobility - Moved from different county within same state (%) - Other Race
Geographical mobility - Moved from different state (%)
Geographical mobility - Moved from different state (%) - White
Geographical mobility - Moved from different state (%) - Black or African American
Geographical mobility - Moved from different state (%) - Asian
Geographical mobility - Moved from different state (%) - Hispanic or Latino
Geographical mobility - Moved from different state (%) - American Indian and Alaska Native
Geographical mobility - Moved from different state (%) - Multirace
Geographical mobility - Moved from different state (%) - Other Race
Geographical mobility - Moved from abroad (%)
Geographical mobility - Moved from abroad (%) - White
Geographical mobility - Moved from abroad (%) - Black or African American
Geographical mobility - Moved from abroad (%) - Asian
Geographical mobility - Moved from abroad (%) - Hispanic or Latino
Geographical mobility - Moved from abroad (%) - American Indian and Alaska Native
Geographical mobility - Moved from abroad (%) - Multirace
Geographical mobility - Moved from abroad (%) - Other Race
Place of birth for the foreign-born population - Ireland (%)
Place of birth for the foreign-born population - Denmark (%)
Place of birth for the foreign-born population - Norway (%)
Place of birth for the foreign-born population - Sweden (%)
Place of birth for the foreign-born population - United Kingdom (%)
Place of birth for the foreign-born population - England (%)
Place of birth for the foreign-born population - Scotland (%)
Place of birth for the foreign-born population - Other Northern Europe (%)
Place of birth for the foreign-born population - Austria (%)
Place of birth for the foreign-born population - Belgium (%)
Place of birth for the foreign-born population - France (%)
Place of birth for the foreign-born population - Germany (%)
Place of birth for the foreign-born population - Netherlands (%)
Place of birth for the foreign-born population - Switzerland (%)
Place of birth for the foreign-born population - Other Western Europe (%)
Place of birth for the foreign-born population - Greece (%)
Place of birth for the foreign-born population - Italy (%)
Place of birth for the foreign-born population - Portugal (%)
Place of birth for the foreign-born population - Spain (%)
Place of birth for the foreign-born population - Other Southern Europe (%)
Place of birth for the foreign-born population - Albania (%)
Place of birth for the foreign-born population - Belarus (%)
Place of birth for the foreign-born population - Bosnia and Herzegovina (%)
Place of birth for the foreign-born population - Bulgaria (%)
Place of birth for the foreign-born population - Croatia (%)
Place of birth for the foreign-born population - Czechoslovakia (%)
Place of birth for the foreign-born population - Hungary (%)
Place of birth for the foreign-born population - Latvia (%)
Place of birth for the foreign-born population - Lithuania (%)
Place of birth for the foreign-born population - North Macedonia (Macedonia) (%)
Place of birth for the foreign-born population - Moldova (%)
Place of birth for the foreign-born population - Poland (%)
Place of birth for the foreign-born population - Romania (%)
Place of birth for the foreign-born population - Russia (%)
Place of birth for the foreign-born population - Serbia (%)
Place of birth for the foreign-born population - Ukraine (%)
Place of birth for the foreign-born population - Other Eastern Europe (%)
Place of birth for the foreign-born population - China (%)
Place of birth for the foreign-born population - Hong Kong (%)
Place of birth for the foreign-born population - Taiwan (%)
Place of birth for the foreign-born population - Japan (%)
Place of birth for the foreign-born population - Korea (%)
Place of birth for the foreign-born population - Other Eastern Asia (%)
Place of birth for the foreign-born population - Afghanistan (%)
Place of birth for the foreign-born population - Bangladesh (%)
Place of birth for the foreign-born population - India (%)
Place of birth for the foreign-born population - Iran (%)
Place of birth for the foreign-born population - Kazakhstan (%)
Place of birth for the foreign-born population - Nepal (%)
Place of birth for the foreign-born population - Pakistan (%)
Place of birth for the foreign-born population - Sri Lanka (%)
Place of birth for the foreign-born population - Uzbekistan (%)
Place of birth for the foreign-born population - Other South Central Asia (%)
Place of birth for the foreign-born population - Burma (%)
Place of birth for the foreign-born population - Cambodia (%)
Place of birth for the foreign-born population - Indonesia (%)
Place of birth for the foreign-born population - Laos (%)
Place of birth for the foreign-born population - Malaysia (%)
Place of birth for the foreign-born population - Philippines (%)
Place of birth for the foreign-born population - Singapore (%)
Place of birth for the foreign-born population - Thailand (%)
Place of birth for the foreign-born population - Vietnam (%)
Place of birth for the foreign-born population - Other South Eastern Asia (%)
Place of birth for the foreign-born population - Armenia (%)
Place of birth for the foreign-born population - Iraq (%)
Place of birth for the foreign-born population - Israel (%)
Place of birth for the foreign-born population - Jordan (%)
Place of birth for the foreign-born population - Kuwait (%)
Place of birth for the foreign-born population - Lebanon (%)
Place of birth for the foreign-born population - Saudi Arabia (%)
Place of birth for the foreign-born population - Syria (%)
Place of birth for the foreign-born population - Turkey (%)
Place of birth for the foreign-born population - Yemen (%)
Place of birth for the foreign-born population - Other Western Asia (%)
Place of birth for the foreign-born population - Eritrea (%)
Place of birth for the foreign-born population - Ethiopia (%)
Place of birth for the foreign-born population - Kenya (%)
Place of birth for the foreign-born population - Somalia (%)
Place of birth for the foreign-born population - Uganda (%)
Place of birth for the foreign-born population - Zimbabwe (%)
Place of birth for the foreign-born population - Other Eastern Africa (%)
Place of birth for the foreign-born population - Cameroon (%)
Place of birth for the foreign-born population - Congo (%)
Place of birth for the foreign-born population - Democratic Republic of Congo (Zaire) (%)
Place of birth for the foreign-born population - Other Middle Africa (%)
Place of birth for the foreign-born population - Egypt (%)
Place of birth for the foreign-born population - Morocco (%)
Place of birth for the foreign-born population - Sudan (%)
Place of birth for the foreign-born population - Other Northern Africa (%)
Place of birth for the foreign-born population - South Africa (%)
Place of birth for the foreign-born population - Other Southern Africa (%)
Place of birth for the foreign-born population - Cabo Verde (%)
Place of birth for the foreign-born population - Ghana (%)
Place of birth for the foreign-born population - Liberia (%)
Place of birth for the foreign-born population - Nigeria (%)
Place of birth for the foreign-born population - Senegal (%)
Place of birth for the foreign-born population - Sierra Leone (%)
Place of birth for the foreign-born population - Other Western Africa (%)
Place of birth for the foreign-born population - Australia (%)
Place of birth for the foreign-born population - New Zealand (%)
Place of birth for the foreign-born population - Fiji (%)
Place of birth for the foreign-born population - Micronesia (%)
Place of birth for the foreign-born population - Bahamas (%)
Place of birth for the foreign-born population - Barbados (%)
Place of birth for the foreign-born population - Cuba (%)
Place of birth for the foreign-born population - Dominica (%)
Place of birth for the foreign-born population - Dominican Republic (%)
Place of birth for the foreign-born population - Grenada (%)
Place of birth for the foreign-born population - Haiti (%)
Place of birth for the foreign-born population - Jamaica (%)
Place of birth for the foreign-born population - St. Vincent and the Grenadines (%)
Place of birth for the foreign-born population - Trinidad and Tobago (%)
Place of birth for the foreign-born population - West Indies (%)
Place of birth for the foreign-born population - Other Caribbean (%)
Place of birth for the foreign-born population - Belize (%)
Place of birth for the foreign-born population - Costa Rica (%)
Place of birth for the foreign-born population - El Salvador (%)
Place of birth for the foreign-born population - Guatemala (%)
Place of birth for the foreign-born population - Honduras (%)
Place of birth for the foreign-born population - Mexico (%)
Place of birth for the foreign-born population - Nicaragua (%)
Place of birth for the foreign-born population - Panama (%)
Place of birth for the foreign-born population - Other Central America (%)
Place of birth for the foreign-born population - Argentina (%)
Place of birth for the foreign-born population - Bolivia (%)
Place of birth for the foreign-born population - Brazil (%)
Place of birth for the foreign-born population - Chile (%)
Place of birth for the foreign-born population - Colombia (%)
Place of birth for the foreign-born population - Ecuador (%)
Place of birth for the foreign-born population - Guyana (%)
Place of birth for the foreign-born population - Peru (%)
Place of birth for the foreign-born population - Uruguay (%)
Place of birth for the foreign-born population - Venezuela (%)
Place of birth for the foreign-born population - Other South America (%)
Place of birth for the foreign-born population - Canada (%)
Place of birth for the foreign-born population - Other Northern America (%)
Place of birth for the foreign-born population - Other (%)
Latest news about races in Galliano, LA collected exclusively by city-data.com from local newspapers, TV, and radio stations
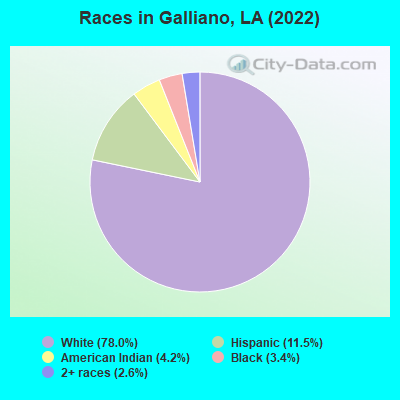
According to 2022 data, the most numerous races in Galliano, LA are White alone (5,140 residents), Black alone (227 residents), and Hispanic (758 residents). 71.9% of Galliano residents speak English at home. 4.4% of Galliano, LA residents are foreign-born (4.3% born in Latin America), which is 10.1% greater than the foreign-born rate of 4.0% across the entire state of Louisiana.
Race distribution in Galliano
2000 2022
2,794,391 62.5% White alone 1,443,390 32.3% Black alone 107,738 2.4% Hispanic 54,256 1.2% Asian alone 39,260 0.9% Two or more races 24,129 0.5% American Indian alone 4,736 0.1% Other race alone 1,076 0.02% Native Hawaiian and Other
2,603,221 56.7% White alone 1,420,055 30.9% Black alone 262,213 5.7% Hispanic 183,270 4.0% Two or more races 81,169 1.8% Asian alone 19,991 0.4% American Indian alone 18,043 0.4% Other race alone 2,279 0.05% Native Hawaiian and Other
Income and house value in Galliano Median household income in 2022 $47,249 White non-Hispanic householders$48,980 American Indian and Alaska Native householders$13,911 Some other race householders$21,325 Hispanic or Latino race householdersMedian 2022 house value $150,767 White Non-Hispanic householders$105,028 American Indian or Alaska Native householders$582,316 Native Hawaiian and other Pacific Islander householders$37,056 Some other race householders$139,332 Two or more races householders$201,164 Hispanic or Latino householders
Median age by race in Galliano
47.9 Median age for White residents42.1 49.7 16.8 Median age for Black or African American residents16.7 17.6 29.4 Median age for American Indian / Alaska Native residents21.8 26.9 -1,092,896,173.8 Median age for Asian residents-1,194,931,772.7 -854,814,814.0 -666,666,666.0 Median age for Native Hawaiian / Pacific Islander residents-666,666,666.0 -666,666,666.0 39.3 Median age for Other race residents-354,481,369.2 31.7 14.8 Median age for Two or more races residents14.2 19.5 47.4 Median age for White alone residents41.9 48.7 16.6 Median age for Hispanic or Latino residents9.5 37.5
Owner/renter occupied households by race in Galliano
House owners and renters - White residents 2,215 87.1% Owner occupied329 12.9% Renter occupiedHouse owners and renters - Black or African American residents 32 100.0% Owner occupiedHouse owners and renters - American Indian / Alaska Native residents 108 100.0% Owner occupiedHouse owners and renters - Other race residents 127 100.0% Renter occupiedHouse owners and renters - Two or more races residents 67 40.7% Owner occupied98 59.3% Renter occupiedHouse owners and renters - White alone residents 2,216 86.7% Owner occupied340 13.3% Renter occupiedHouse owners and renters - Hispanic or Latino residents 45 39.1% Owner occupied70 60.9% Renter occupied
Language usage in Galliano
English speakers - Total 71.9% of residents of Galliano speak English at home.
8.4% of residents speak Spanish at home 451 84.1% Speak English very well85 15.9% Speak English less than very well15.7% of residents speak other language at home 899 90.3% Speak English very well97 9.7% Speak English less than very well
English speakers - Born in the United States 81.2% of residents of Galliano speak English at home.
27.7% of residents speak Spanish at home 205 100.0% Speak English very well1.8% of residents speak other language at home 13 100.0% Speak English very well
All residents speak only English at home
English speakers - Foreign-born 2.7% of residents of Galliano speak English at home.
95.3% of residents speak Spanish at home 233 72.4% Speak English very well89 27.6% Speak English less than very well0.9% of residents speak other language at home 3 100.0% Speak English very well
White (Caucasian) - Speak another language Native:
19.2% (955)Foreign-born:
100.0% (4)
Other race - Speak only English Native:
23.7% (31)Foreign-born:
9.9% (8)
Other race - Speak another language Native:
70.5% (91)Foreign-born:
89.8% (72)
Two or more races - Speak another language Native:
13.1% (49)Foreign-born:
98.6% (391)
White alone - Speak another language Native:
19.5% (961)Foreign-born:
100.0% (4)
Hispanic or Latino - Speak only English Native:
54.9% (252)Foreign-born:
4.3% (13)
Hispanic or Latino - Speak another language Native:
47.1% (216)Foreign-born:
93.1% (283)
Foreign-born residents in Galliano 293 residents are foreign born (4.3% Latin America ).
This city:
4.4%Louisiana:
4.2%
Marital status for residents in Galliano Marital status - White (Caucasian) population 15 years and over
Males 27.6% Never married52.7% Now married0.0% Separated3.9% Widowed15.9% DivorcedFemales 17.2% Never married49.3% Now married4.7% Separated16.6% Widowed12.1% DivorcedWomen who gave birth in the past 12 months Now married:
68.3% (105)Unmarried:
31.7% (49)
Women who did not give birth in the past 12 months Now married:
50.9% (380)Unmarried:
49.1% (367)
Marital status - Black or African American population 15 years and over
Males 24.5% Never married39.6% Now married0.0% Separated32.1% Widowed3.8% DivorcedFemales 35.0% Never married65.0% Now married0.0% Separated0.0% Widowed0.0% DivorcedWomen who did not give birth in the past 12 months Now married:
65.0% (25)Unmarried:
35.0% (14)
Marital status - American Indian / Alaska Native population 15 years and over
Males 24.7% Never married70.4% Now married4.9% Separated0.0% Widowed0.0% DivorcedFemales 52.7% Never married40.3% Now married6.2% Separated0.0% Widowed0.8% DivorcedWomen who did not give birth in the past 12 months Now married:
8.2% (5)Unmarried:
91.8% (56)
Marital status - Two or more races population 15 years and over
Males 21.5% Never married78.5% Now married0.0% Separated0.0% Widowed0.0% DivorcedFemales 25.3% Never married56.3% Now married0.0% Separated0.6% Widowed17.7% DivorcedWomen who did not give birth in the past 12 months Now married:
59.6% (82)Unmarried:
40.4% (56)
Marital status - White alone, not Hispanic / Latino population 15 years and over
Males 26.5% Never married53.3% Now married0.0% Separated4.0% Widowed16.2% DivorcedFemales 16.6% Never married49.9% Now married4.8% Separated16.6% Widowed12.1% DivorcedWomen who gave birth in the past 12 months Now married:
68.3% (107)Unmarried:
31.7% (50)
Women who did not give birth in the past 12 months Now married:
52.0% (385)Unmarried:
48.0% (355)
Marital status - Hispanic or Latino population 15 years and over
Males 46.3% Never married53.7% Now married0.0% Separated0.0% Widowed0.0% DivorcedFemales 27.6% Never married24.1% Now married39.5% Separated7.3% Widowed1.5% DivorcedWomen who did not give birth in the past 12 months Now married:
46.2% (61)Unmarried:
53.8% (71)
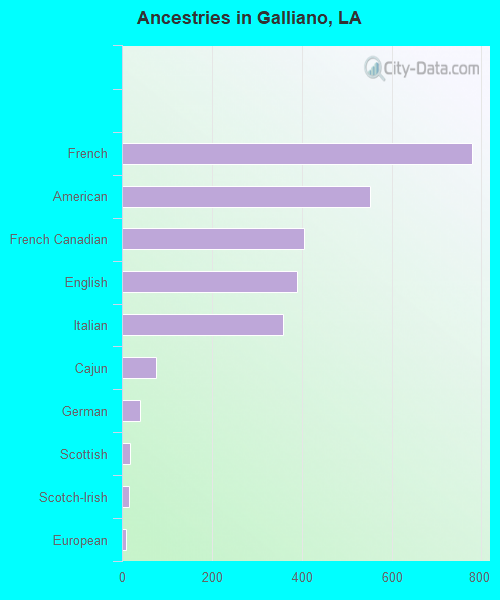
Ancestries in Galliano
778 19.6% French553 13.9% American405 10.2% French Canadian390 9.8% English359 9.0% Italian75 1.9% Cajun41 1.0% German18 0.5% Scottish16 0.4% Scotch-Irish9 0.2% European5 0.1% Brazilian
Children Nativity (place of birth) in Galliano
Children under 6 years - Living with two parents Both parents native 237 100.0% NativeOne native, one foreign-born parent 71 100.0% NativeChildren under 6 years - Living with one parent Native parent 153 100.0% NativeChildren 6 to 17 years - Living with two parents Both parents native 255 100.0% NativeOne native, one foreign-born parent 132 100.0% NativeChildren 6 to 17 years - Living with one parent Native parent 334 98.4% Native5 1.6% Foreign-bornForeign-born parent 92 67.7% Native44 32.3% Foreign-born
Grandparents responsible for own grandchildren in Galliano
Grandparents (30 to 59 years) White / Caucasian 14 43.2% Responsible for grandchildren19 56.8% Not responsible for grandchildrenAmerican Indian / Alaska Native 1 30.2% Responsible for grandchildren2 69.8% Not responsible for grandchildrenTwo or more races 7 100.0% Responsible for grandchildrenWhite alone, not Hispanic / Latino 15 43.9% Responsible for grandchildren19 56.1% Not responsible for grandchildrenGrandparents (60 years and over) White / Caucasian 10 70.3% Responsible for grandchildren4 29.7% Not responsible for grandchildrenAmerican Indian / Alaska Native 7 100.0% Not responsible for grandchildrenTwo or more races 2 100.0% Not responsible for grandchildrenWhite alone, not Hispanic / Latino 6 60.4% Responsible for grandchildren4 39.6% Not responsible for grandchildren