Races in Garden City, Kansas (KS) Detailed Stats
Data:
Races - White alone (%)
Races - White alone (% change since 2000)
Races - Black alone (%)
Races - Black alone (% change since 2000)
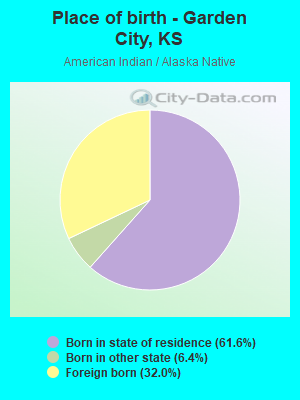
Races - American Indian alone (%)
Races - American Indian alone (% change since 2000)
Races - Asian alone (%)
Races - Asian alone (% change since 2000)
Races - Hispanic (%)
Races - Hispanic (% change since 2000)
Races - Native Hawaiian and Other Pacific Islander alone (%)
Races - Native Hawaiian and Other Pacific Islander alone (% change since 2000)
Races - Two or more races(%)
Races - Two or more races(% change since 2000)
Races - Other race alone (%)
Races - Other race alone (% change since 2000)
Racial diversity
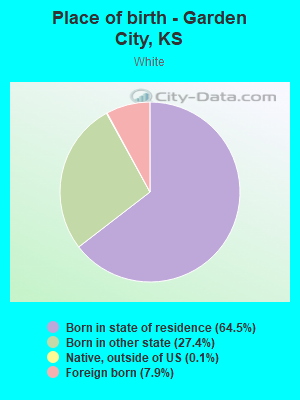
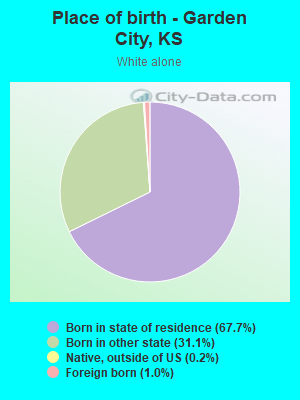
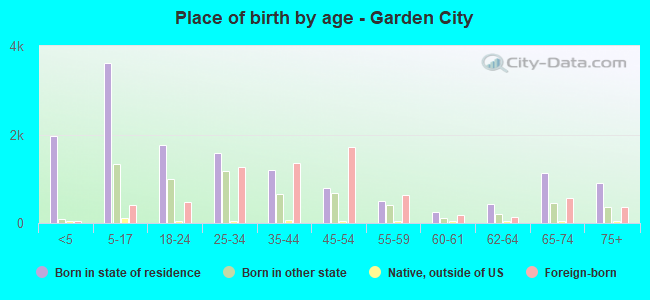
Place of birth - Born in state of residence (%)
Place of birth - Born in state of residence (%) - White
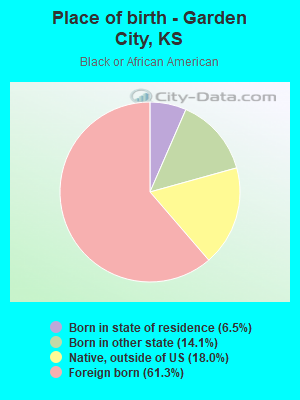
Place of birth - Born in state of residence (%) - Black or African American
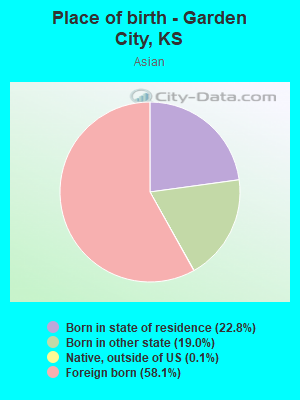
Place of birth - Born in state of residence (%) - Asian
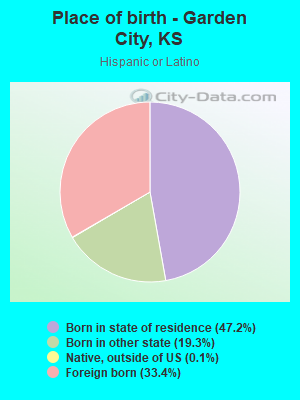
Place of birth - Born in state of residence (%) - Hispanic or Latino
Place of birth - Born in state of residence (%) - American Indian and Alaska Native
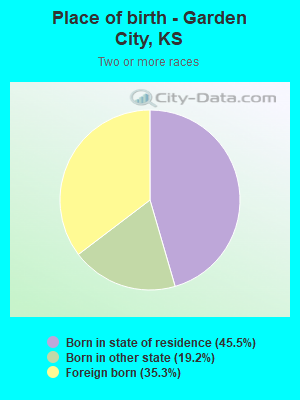
Place of birth - Born in state of residence (%) - Multirace
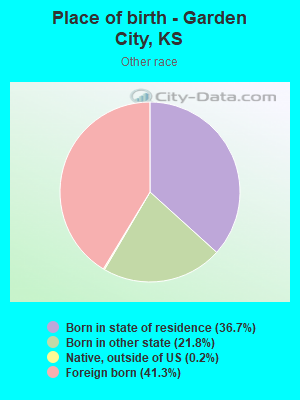
Place of birth - Born in state of residence (%) - Other Race
Place of birth - Born in other state (%)
Place of birth - Born in other state (%) - White
Place of birth - Born in other state (%) - Black or African American
Place of birth - Born in other state (%) - Asian
Place of birth - Born in other state (%) - Hispanic or Latino
Place of birth - Born in other state (%) - American Indian and Alaska Native
Place of birth - Born in other state (%) - Multirace
Place of birth - Born in other state (%) - Other Race
Place of birth - Native, outside of US (%)
Place of birth - Native, outside of US (%) - White
Place of birth - Native, outside of US (%) - Black or African American
Place of birth - Native, outside of US (%) - Asian
Place of birth - Native, outside of US (%) - Hispanic or Latino
Place of birth - Native, outside of US (%) - American Indian and Alaska Native
Place of birth - Native, outside of US (%) - Multirace
Place of birth - Native, outside of US (%) - Other Race
Place of birth - Foreign born (%)
Place of birth - Foreign born (%) - White
Place of birth - Foreign born (%) - Black or African American
Place of birth - Foreign born (%) - Asian
Place of birth - Foreign born (%) - Hispanic or Latino
Place of birth - Foreign born (%) - American Indian and Alaska Native
Place of birth - Foreign born (%) - Multirace
Place of birth - Foreign born (%) - Other Race
Residents speaking English at home (%)
Residents speaking English at home - Born in the United States (%)
Residents speaking English at home - Native, born elsewhere (%)
Residents speaking English at home - Foreign born (%)
Residents speaking Spanish at home (%)
Residents speaking Spanish at home - Born in the United States (%)
Residents speaking Spanish at home - Native, born elsewhere (%)
Residents speaking Spanish at home - Foreign born (%)
Residents speaking other language at home (%)
Residents speaking other language at home - Born in the United States (%)
Residents speaking other language at home - Native, born elsewhere (%)
Residents speaking other language at home - Foreign born (%)
Marital status - Never married (%)
Marital status - Now married (%)
Marital status - Separated (%)
Marital status - Widowed (%)
Marital status - Divorced (%)
Ancestries Reported - Arab (%)
Ancestries Reported - Czech (%)
Ancestries Reported - Danish (%)
Ancestries Reported - Dutch (%)
Ancestries Reported - English (%)
Ancestries Reported - French (%)
Ancestries Reported - French Canadian (%)
Ancestries Reported - German (%)
Ancestries Reported - Greek (%)
Ancestries Reported - Hungarian (%)
Ancestries Reported - Irish (%)
Ancestries Reported - Italian (%)
Ancestries Reported - Lithuanian (%)
Ancestries Reported - Norwegian (%)
Ancestries Reported - Polish (%)
Ancestries Reported - Portuguese (%)
Ancestries Reported - Russian (%)
Ancestries Reported - Scotch-Irish (%)
Ancestries Reported - Scottish (%)
Ancestries Reported - Slovak (%)
Ancestries Reported - Subsaharan African (%)
Ancestries Reported - Swedish (%)
Ancestries Reported - Swiss (%)
Ancestries Reported - Ukrainian (%)
Ancestries Reported - United States (%)
Ancestries Reported - Welsh (%)
Ancestries Reported - West Indian (%)
Ancestries Reported - Other (%)
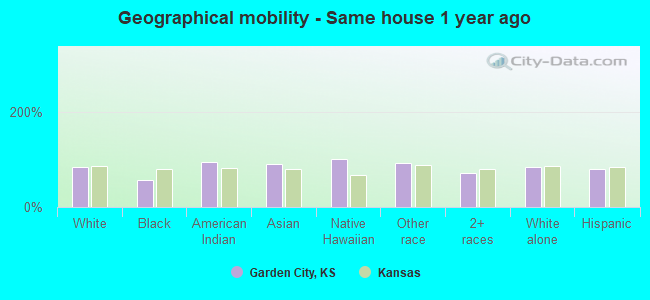
Geographical mobility - Same house 1 year ago (%)
Geographical mobility - Same house 1 year ago (%) - White
Geographical mobility - Same house 1 year ago (%) - Black or African American
Geographical mobility - Same house 1 year ago (%) - Asian
Geographical mobility - Same house 1 year ago (%) - Hispanic or Latino
Geographical mobility - Same house 1 year ago (%) - American Indian and Alaska Native
Geographical mobility - Same house 1 year ago (%) - Multirace
Geographical mobility - Same house 1 year ago (%) - Other Race
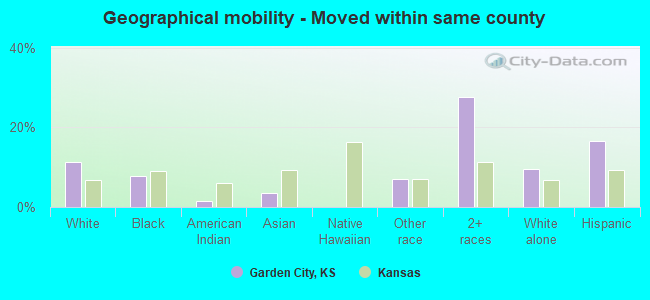
Geographical mobility - Moved within same county (%)
Geographical mobility - Moved within same county (%) - White
Geographical mobility - Moved within same county (%) - Black or African American
Geographical mobility - Moved within same county (%) - Asian
Geographical mobility - Moved within same county (%) - Hispanic or Latino
Geographical mobility - Moved within same county (%) - American Indian and Alaska Native
Geographical mobility - Moved within same county (%) - Multirace
Geographical mobility - Moved within same county (%) - Other Race
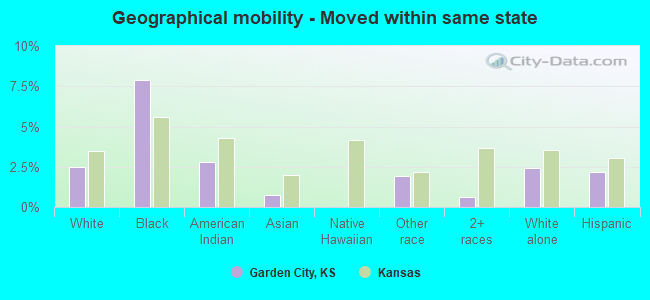
Geographical mobility - Moved from different county within same state (%)
Geographical mobility - Moved from different county within same state (%) - White
Geographical mobility - Moved from different county within same state (%) - Black or African American
Geographical mobility - Moved from different county within same state (%) - Asian
Geographical mobility - Moved from different county within same state (%) - Hispanic or Latino
Geographical mobility - Moved from different county within same state (%) - American Indian and Alaska Native
Geographical mobility - Moved from different county within same state (%) - Multirace
Geographical mobility - Moved from different county within same state (%) - Other Race
Geographical mobility - Moved from different state (%)
Geographical mobility - Moved from different state (%) - White
Geographical mobility - Moved from different state (%) - Black or African American
Geographical mobility - Moved from different state (%) - Asian
Geographical mobility - Moved from different state (%) - Hispanic or Latino
Geographical mobility - Moved from different state (%) - American Indian and Alaska Native
Geographical mobility - Moved from different state (%) - Multirace
Geographical mobility - Moved from different state (%) - Other Race
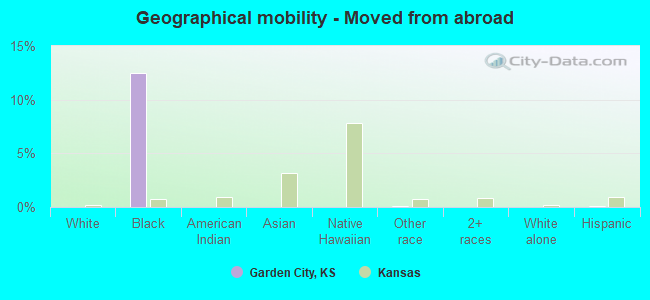
Geographical mobility - Moved from abroad (%)
Geographical mobility - Moved from abroad (%) - White
Geographical mobility - Moved from abroad (%) - Black or African American
Geographical mobility - Moved from abroad (%) - Asian
Geographical mobility - Moved from abroad (%) - Hispanic or Latino
Geographical mobility - Moved from abroad (%) - American Indian and Alaska Native
Geographical mobility - Moved from abroad (%) - Multirace
Geographical mobility - Moved from abroad (%) - Other Race
Place of birth for the foreign-born population - Ireland (%)
Place of birth for the foreign-born population - Denmark (%)
Place of birth for the foreign-born population - Norway (%)
Place of birth for the foreign-born population - Sweden (%)
Place of birth for the foreign-born population - United Kingdom (%)
Place of birth for the foreign-born population - England (%)
Place of birth for the foreign-born population - Scotland (%)
Place of birth for the foreign-born population - Other Northern Europe (%)
Place of birth for the foreign-born population - Austria (%)
Place of birth for the foreign-born population - Belgium (%)
Place of birth for the foreign-born population - France (%)
Place of birth for the foreign-born population - Germany (%)
Place of birth for the foreign-born population - Netherlands (%)
Place of birth for the foreign-born population - Switzerland (%)
Place of birth for the foreign-born population - Other Western Europe (%)
Place of birth for the foreign-born population - Greece (%)
Place of birth for the foreign-born population - Italy (%)
Place of birth for the foreign-born population - Portugal (%)
Place of birth for the foreign-born population - Spain (%)
Place of birth for the foreign-born population - Other Southern Europe (%)
Place of birth for the foreign-born population - Albania (%)
Place of birth for the foreign-born population - Belarus (%)
Place of birth for the foreign-born population - Bosnia and Herzegovina (%)
Place of birth for the foreign-born population - Bulgaria (%)
Place of birth for the foreign-born population - Croatia (%)
Place of birth for the foreign-born population - Czechoslovakia (%)
Place of birth for the foreign-born population - Hungary (%)
Place of birth for the foreign-born population - Latvia (%)
Place of birth for the foreign-born population - Lithuania (%)
Place of birth for the foreign-born population - North Macedonia (Macedonia) (%)
Place of birth for the foreign-born population - Moldova (%)
Place of birth for the foreign-born population - Poland (%)
Place of birth for the foreign-born population - Romania (%)
Place of birth for the foreign-born population - Russia (%)
Place of birth for the foreign-born population - Serbia (%)
Place of birth for the foreign-born population - Ukraine (%)
Place of birth for the foreign-born population - Other Eastern Europe (%)
Place of birth for the foreign-born population - China (%)
Place of birth for the foreign-born population - Hong Kong (%)
Place of birth for the foreign-born population - Taiwan (%)
Place of birth for the foreign-born population - Japan (%)
Place of birth for the foreign-born population - Korea (%)
Place of birth for the foreign-born population - Other Eastern Asia (%)
Place of birth for the foreign-born population - Afghanistan (%)
Place of birth for the foreign-born population - Bangladesh (%)
Place of birth for the foreign-born population - India (%)
Place of birth for the foreign-born population - Iran (%)
Place of birth for the foreign-born population - Kazakhstan (%)
Place of birth for the foreign-born population - Nepal (%)
Place of birth for the foreign-born population - Pakistan (%)
Place of birth for the foreign-born population - Sri Lanka (%)
Place of birth for the foreign-born population - Uzbekistan (%)
Place of birth for the foreign-born population - Other South Central Asia (%)
Place of birth for the foreign-born population - Burma (%)
Place of birth for the foreign-born population - Cambodia (%)
Place of birth for the foreign-born population - Indonesia (%)
Place of birth for the foreign-born population - Laos (%)
Place of birth for the foreign-born population - Malaysia (%)
Place of birth for the foreign-born population - Philippines (%)
Place of birth for the foreign-born population - Singapore (%)
Place of birth for the foreign-born population - Thailand (%)
Place of birth for the foreign-born population - Vietnam (%)
Place of birth for the foreign-born population - Other South Eastern Asia (%)
Place of birth for the foreign-born population - Armenia (%)
Place of birth for the foreign-born population - Iraq (%)
Place of birth for the foreign-born population - Israel (%)
Place of birth for the foreign-born population - Jordan (%)
Place of birth for the foreign-born population - Kuwait (%)
Place of birth for the foreign-born population - Lebanon (%)
Place of birth for the foreign-born population - Saudi Arabia (%)
Place of birth for the foreign-born population - Syria (%)
Place of birth for the foreign-born population - Turkey (%)
Place of birth for the foreign-born population - Yemen (%)
Place of birth for the foreign-born population - Other Western Asia (%)
Place of birth for the foreign-born population - Eritrea (%)
Place of birth for the foreign-born population - Ethiopia (%)
Place of birth for the foreign-born population - Kenya (%)
Place of birth for the foreign-born population - Somalia (%)
Place of birth for the foreign-born population - Uganda (%)
Place of birth for the foreign-born population - Zimbabwe (%)
Place of birth for the foreign-born population - Other Eastern Africa (%)
Place of birth for the foreign-born population - Cameroon (%)
Place of birth for the foreign-born population - Congo (%)
Place of birth for the foreign-born population - Democratic Republic of Congo (Zaire) (%)
Place of birth for the foreign-born population - Other Middle Africa (%)
Place of birth for the foreign-born population - Egypt (%)
Place of birth for the foreign-born population - Morocco (%)
Place of birth for the foreign-born population - Sudan (%)
Place of birth for the foreign-born population - Other Northern Africa (%)
Place of birth for the foreign-born population - South Africa (%)
Place of birth for the foreign-born population - Other Southern Africa (%)
Place of birth for the foreign-born population - Cabo Verde (%)
Place of birth for the foreign-born population - Ghana (%)
Place of birth for the foreign-born population - Liberia (%)
Place of birth for the foreign-born population - Nigeria (%)
Place of birth for the foreign-born population - Senegal (%)
Place of birth for the foreign-born population - Sierra Leone (%)
Place of birth for the foreign-born population - Other Western Africa (%)
Place of birth for the foreign-born population - Australia (%)
Place of birth for the foreign-born population - New Zealand (%)
Place of birth for the foreign-born population - Fiji (%)
Place of birth for the foreign-born population - Micronesia (%)
Place of birth for the foreign-born population - Bahamas (%)
Place of birth for the foreign-born population - Barbados (%)
Place of birth for the foreign-born population - Cuba (%)
Place of birth for the foreign-born population - Dominica (%)
Place of birth for the foreign-born population - Dominican Republic (%)
Place of birth for the foreign-born population - Grenada (%)
Place of birth for the foreign-born population - Haiti (%)
Place of birth for the foreign-born population - Jamaica (%)
Place of birth for the foreign-born population - St. Vincent and the Grenadines (%)
Place of birth for the foreign-born population - Trinidad and Tobago (%)
Place of birth for the foreign-born population - West Indies (%)
Place of birth for the foreign-born population - Other Caribbean (%)
Place of birth for the foreign-born population - Belize (%)
Place of birth for the foreign-born population - Costa Rica (%)
Place of birth for the foreign-born population - El Salvador (%)
Place of birth for the foreign-born population - Guatemala (%)
Place of birth for the foreign-born population - Honduras (%)
Place of birth for the foreign-born population - Mexico (%)
Place of birth for the foreign-born population - Nicaragua (%)
Place of birth for the foreign-born population - Panama (%)
Place of birth for the foreign-born population - Other Central America (%)
Place of birth for the foreign-born population - Argentina (%)
Place of birth for the foreign-born population - Bolivia (%)
Place of birth for the foreign-born population - Brazil (%)
Place of birth for the foreign-born population - Chile (%)
Place of birth for the foreign-born population - Colombia (%)
Place of birth for the foreign-born population - Ecuador (%)
Place of birth for the foreign-born population - Guyana (%)
Place of birth for the foreign-born population - Peru (%)
Place of birth for the foreign-born population - Uruguay (%)
Place of birth for the foreign-born population - Venezuela (%)
Place of birth for the foreign-born population - Other South America (%)
Place of birth for the foreign-born population - Canada (%)
Place of birth for the foreign-born population - Other Northern America (%)
Place of birth for the foreign-born population - Other (%)
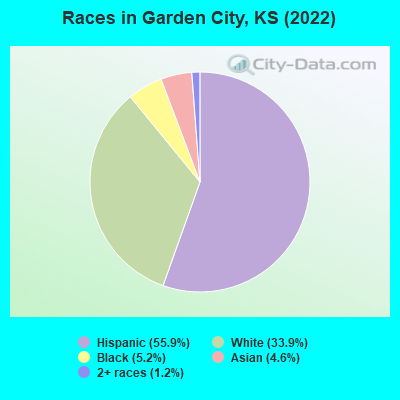
According to 2022 data, the most numerous races in Garden City, KS are White alone (9,486 residents), Hispanic (15,631 residents), and Black alone (1,454 residents). 51.5% of Garden City residents speak English at home. 25.7% of Garden City, KS residents are foreign-born (19.7% born in Latin America, 2.9% born in Asia), which is 72.7% greater than the foreign-born rate of 7.0% across the entire state of Kansas.
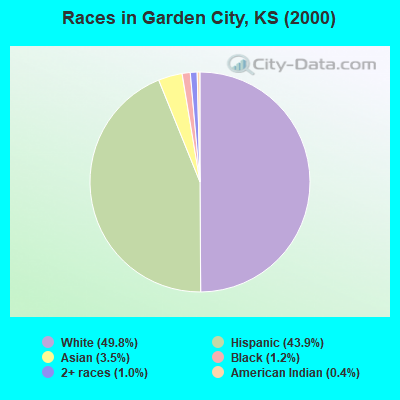
Race distribution in Garden City
2000 2022
2,233,997 83.1% White alone 188,252 7.0% Hispanic 151,407 5.6% Black alone 46,301 1.7% Asian alone 42,508 1.6% Two or more races 22,322 0.8% American Indian alone 2,477 0.09% Other race alone 1,154 0.04% Native Hawaiian and Other
2,147,943 73.1% White alone 381,746 13.0% Hispanic 147,666 5.0% Black alone 145,362 4.9% Two or more races 85,085 2.9% Asian alone 13,263 0.5% Other race alone 12,065 0.4% American Indian alone 4,020 0.1% Native Hawaiian and Other
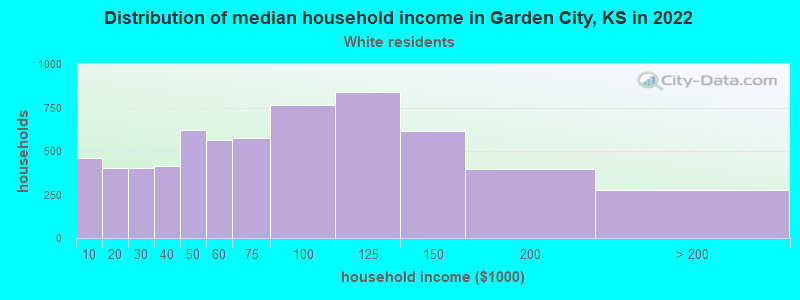
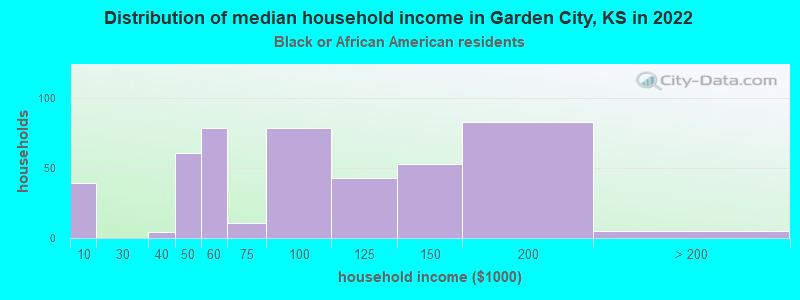
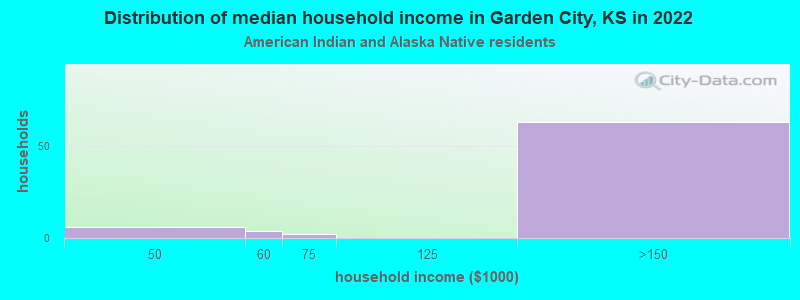
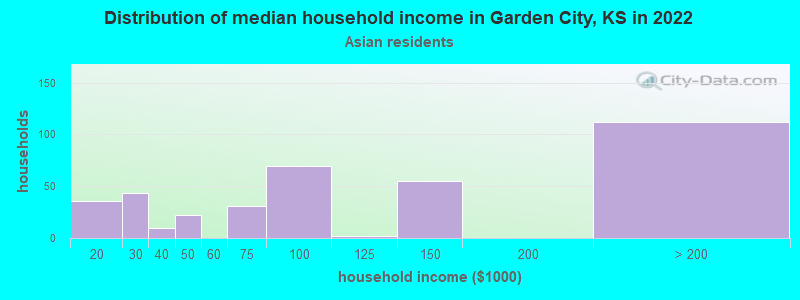
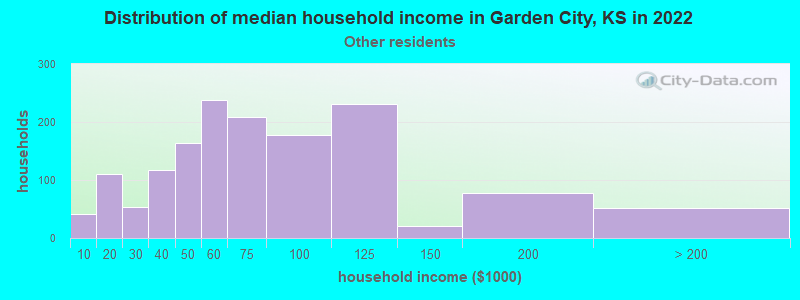
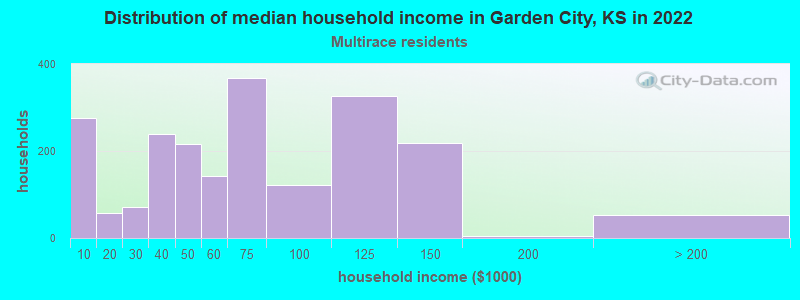
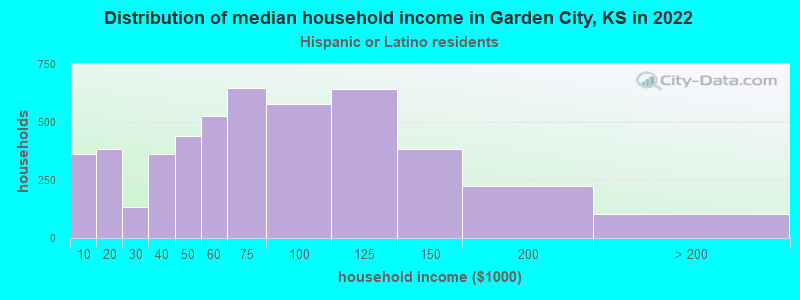
Income and house value in Garden City Median household income in 2022 $66,662 White non-Hispanic householders$95,127 Black householders$152,776 American Indian and Alaska Native householders$60,594 Some other race householders$64,642 Two or more races householders$67,134 Hispanic or Latino race householdersMedian 2022 house value $220,880 White Non-Hispanic householders$198,013 Black or African American householders$140,720 American Indian or Alaska Native householders $233,445 Asian householders$155,546 Some other race householders$185,700 Two or more races householders$159,818 Hispanic or Latino householders
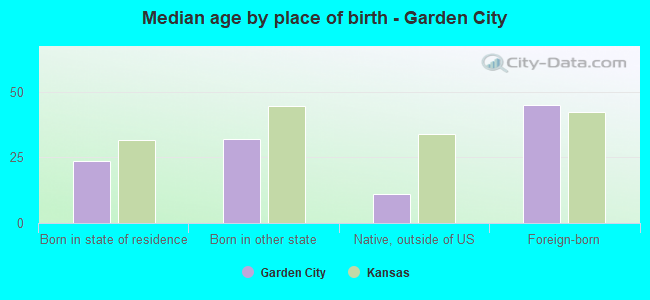
Median age by race in Garden City
37.5 Median age for White residents35.4 40.6 31.5 Median age for Black or African American residents31.5 30.9 32.8 Median age for American Indian / Alaska Native residents34.4 34.2 39.1 Median age for Asian residents40.0 38.6 -627,039,626.4 Median age for Native Hawaiian / Pacific Islander residents-669,240,668.6 -641,269,840.6 30.2 Median age for Other race residents31.3 28.2 27.2 Median age for Two or more races residents26.9 30.1 47.8 Median age for White alone residents42.4 50.3 26.6 Median age for Hispanic or Latino residents26.6 26.6
Owner/renter occupied households by race in Garden City
House owners and renters - White residents 4,040 64.5% Owner occupied2,226 35.5% Renter occupiedHouse owners and renters - Black or African American residents 41 8.7% Owner occupied425 91.3% Renter occupiedHouse owners and renters - American Indian / Alaska Native residents 82 94.5% Owner occupied5 5.5% Renter occupiedHouse owners and renters - Asian residents 259 62.3% Owner occupied157 37.7% Renter occupiedHouse owners and renters - Native Hawaiian / Pacific Islander residents 29 100.0% Renter occupiedHouse owners and renters - Other race residents 867 58.9% Owner occupied604 41.1% Renter occupiedHouse owners and renters - Two or more races residents 1,398 67.1% Owner occupied685 32.9% Renter occupiedHouse owners and renters - White alone residents 3,004 66.7% Owner occupied1,501 33.3% Renter occupiedHouse owners and renters - Hispanic or Latino residents 2,941 61.5% Owner occupied1,841 38.5% Renter occupied
Language usage in Garden City
English speakers - Total 51.5% of residents of Garden City speak English at home.
40.0% of residents speak Spanish at home 5,887 56.9% Speak English very well4,452 43.1% Speak English less than very well8.3% of residents speak other language at home 581 26.9% Speak English very well1,575 73.1% Speak English less than very well
English speakers - Born in the United States 71.8% of residents of Garden City speak English at home.
26.7% of residents speak Spanish at home 1,260 73.6% Speak English very well451 26.4% Speak English less than very well2.1% of residents speak other language at home 44 32.8% Speak English very well90 67.2% Speak English less than very well
English speakers - Native, born elsewhere 11.4% of residents of Garden City speak English at home.
6.7% of residents speak Spanish at home 3 21.4% Speak English very well11 78.6% Speak English less than very well87.6% of residents speak other language at home 184 100.0% Speak English less than very well
English speakers - Foreign-born 5.5% of residents of Garden City speak English at home.
69.7% of residents speak Spanish at home 1,346 27.4% Speak English very well3,568 72.6% Speak English less than very well24.5% of residents speak other language at home 462 26.8% Speak English very well1,264 73.2% Speak English less than very well
White (Caucasian) - Speak only English Native:
81.4% (10,212)Foreign-born:
9.9% (115)
White (Caucasian) - Speak another language Native:
12.7% (1,598)Foreign-born:
81.5% (948)
Black or African American - Speak only English Native:
52.3% (212)Foreign-born:
2.6% (28)
Black or African American - Speak another language Native:
53.3% (216)Foreign-born:
95.8% (1,009)
American Indian / Alaska Native - Speak another language Native:
100.0% (88)Foreign-born:
100.0% (46)
Asian - Speak only English Native:
60.0% (322)Foreign-born:
7.5% (57)
Asian - Speak another language Native:
39.5% (212)Foreign-born:
92.9% (711)
Other race - Speak only English Native:
34.4% (921)Foreign-born:
7.1% (143)
Other race - Speak another language Native:
63.0% (1,687)Foreign-born:
92.1% (1,865)
Two or more races - Speak only English Native:
45.6% (1,686)Foreign-born:
4.6% (115)
Two or more races - Speak another language Native:
64.8% (2,399)Foreign-born:
95.9% (2,418)
White alone - Speak only English Native:
98.9% (8,791)Foreign-born:
60.4% (56)
White alone - Speak another language Native:
1.1% (102)Foreign-born:
36.8% (34)
Hispanic or Latino - Speak only English Native:
38.6% (3,423)Foreign-born:
5.6% (295)
Hispanic or Latino - Speak another language Native:
61.1% (5,412)Foreign-born:
94.0% (4,934)
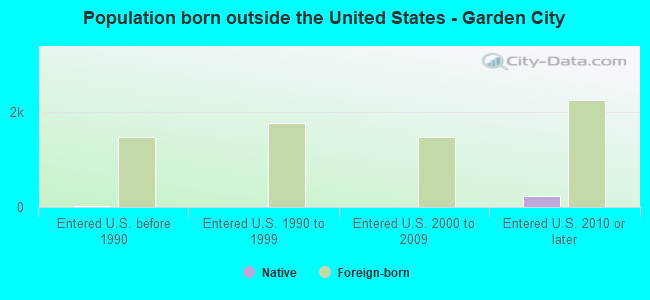
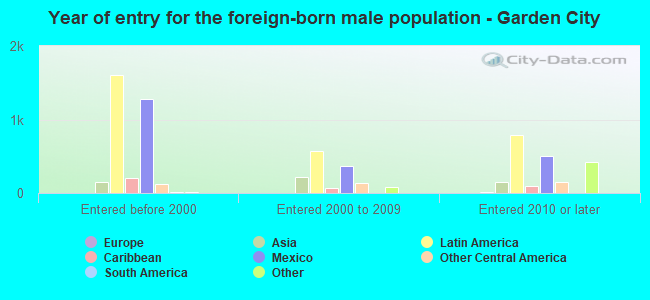
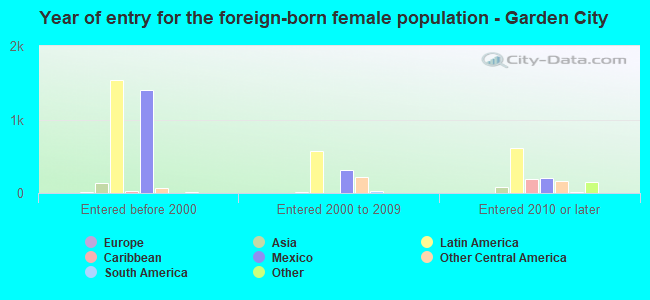
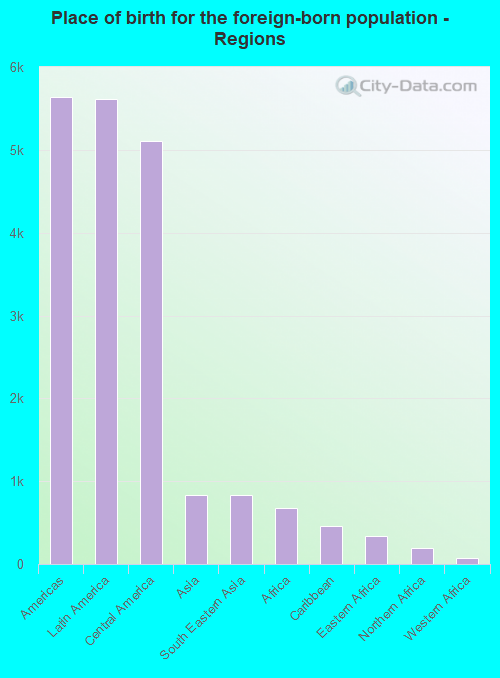
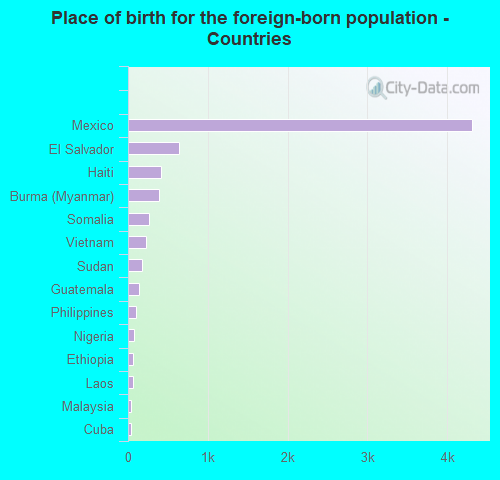
Foreign-born residents in Garden City 7,178 residents are foreign born (19.7% Latin America , 2.9% Asia ).
This city:
25.7%Kansas:
7.1%
Marital status for residents in Garden City Marital status - White (Caucasian) population 15 years and over
Males 39.3% Never married47.5% Now married0.7% Separated2.5% Widowed10.0% DivorcedFemales 26.7% Never married50.4% Now married4.1% Separated8.1% Widowed10.7% DivorcedWomen who gave birth in the past 12 months Now married:
65.6% (118)Unmarried:
34.4% (62)
Women who did not give birth in the past 12 months Now married:
45.4% (1,417)Unmarried:
54.6% (1,701)
Marital status - Black or African American population 15 years and over
Males 46.9% Never married38.1% Now married5.1% Separated1.1% Widowed8.9% DivorcedFemales 33.0% Never married42.8% Now married7.8% Separated8.5% Widowed8.0% DivorcedWomen who did not give birth in the past 12 months Now married:
64.2% (183)Unmarried:
35.8% (102)
Marital status - American Indian / Alaska Native population 15 years and over
Males 26.3% Never married62.1% Now married6.3% Separated5.3% Widowed0.0% DivorcedFemales 55.6% Never married22.2% Now married0.0% Separated0.0% Widowed22.2% DivorcedWomen who did not give birth in the past 12 months Now married:
0.0% (0)Unmarried:
100.0% (6)
Marital status - Asian population 15 years and over
Males 55.8% Never married42.1% Now married0.0% Separated0.0% Widowed2.2% DivorcedFemales 30.5% Never married61.8% Now married5.5% Separated2.2% Widowed0.0% DivorcedWomen who gave birth in the past 12 months Now married:
100.0% (19)Unmarried:
0.0% (0)
Women who did not give birth in the past 12 months Now married:
53.4% (142)Unmarried:
46.6% (124)
Marital status - Other race population 15 years and over
Males 43.5% Never married51.1% Now married0.7% Separated1.8% Widowed2.9% DivorcedFemales 45.7% Never married45.4% Now married0.6% Separated3.8% Widowed4.4% DivorcedWomen who gave birth in the past 12 months Now married:
62.0% (39)Unmarried:
38.0% (24)
Women who did not give birth in the past 12 months Now married:
35.0% (380)Unmarried:
65.0% (705)
Marital status - Two or more races population 15 years and over
Males 46.7% Never married41.1% Now married0.9% Separated0.0% Widowed11.3% DivorcedFemales 35.5% Never married37.8% Now married5.8% Separated13.0% Widowed8.0% DivorcedWomen who gave birth in the past 12 months Now married:
63.6% (139)Unmarried:
36.4% (79)
Women who did not give birth in the past 12 months Now married:
39.8% (468)Unmarried:
60.2% (708)
Marital status - White alone, not Hispanic / Latino population 15 years and over
Males 35.3% Never married49.4% Now married0.3% Separated3.2% Widowed11.9% DivorcedFemales 22.0% Never married51.8% Now married1.3% Separated10.2% Widowed14.7% DivorcedWomen who gave birth in the past 12 months Now married:
56.1% (68)Unmarried:
43.9% (53)
Women who did not give birth in the past 12 months Now married:
46.0% (792)Unmarried:
54.0% (930)
Marital status - Hispanic or Latino population 15 years and over
Males 45.0% Never married46.0% Now married1.0% Separated1.1% Widowed7.0% DivorcedFemales 38.3% Never married44.3% Now married6.6% Separated6.3% Widowed4.6% DivorcedWomen who gave birth in the past 12 months Now married:
68.0% (201)Unmarried:
32.0% (95)
Women who did not give birth in the past 12 months Now married:
41.3% (1,429)Unmarried:
58.7% (2,029)
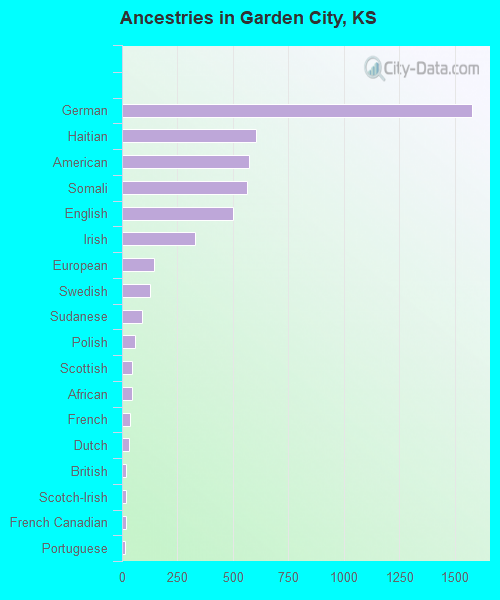
Ancestries in Garden City
1,575 9.3% German604 3.6% Haitian574 3.4% American562 3.3% Somali500 2.9% English330 1.9% Irish145 0.9% European125 0.7% Swedish88 0.5% Sudanese59 0.3% Polish47 0.3% Scottish44 0.3% African34 0.2% French33 0.2% Dutch20 0.1% British19 0.1% Scotch-Irish17 0.1% French Canadian15 0.09% Portuguese14 0.08% Italian11 0.06% Norwegian10 0.06% Latvian9 0.05% Canadian9 0.05% Greek9 0.05% Hungarian9 0.05% Pennsylvania German8 0.05% Czech7 0.04% Swiss6 0.04% Eastern European4 0.02% Belgian3 0.02% Australian3 0.02% Ethiopian
Geographical mobility in Garden City Same house 1 year ago 12,506 82.7% White (Caucasian)870 56.2% Black or African American118 94.9% American Indian / Alaska Native1,177 90.3% Asian28 100.0% Native Hawaiian / Pacific Islander4,498 92.5% Other race4,767 72.4% Two or more races7,844 83.3% White alone, not Hispanic / Latino12,328 80.4% Hispanic or LatinoMoved within same county 1,721 11.4% White / Caucasian122 7.9% Black or African American2 1.4% American Indian / Alaska Native46 3.5% Asian342 7.0% Other race1,824 27.7% Two or more races901 9.6% White alone, not Hispanic / Latino2,546 16.6% Hispanic or LatinoMoved within same state 373 2.5% White / Caucasian122 7.9% Black or African American3 2.8% American Indian / Alaska Native9 0.7% Asian93 1.9% Other race43 0.7% Two or more races225 2.4% White alone, not Hispanic / Latino333 2.2% Hispanic or LatinoMoved from different state 418 2.8% White / Caucasian200 12.9% Black or African American60 4.6% Asian25 0.5% Other race29 0.4% Two or more races413 4.4% White alone, not Hispanic / Latino63 0.4% Hispanic or LatinoMoved from abroad 194 12.5% Black or African American6 0.1% Other race11 0.1% Hispanic or Latino
Children Nativity (place of birth) in Garden City
Children under 6 years - Living with two parents Both parents native 686 100.0% NativeBoth parents foreign-born 320 100.0% NativeOne native, one foreign-born parent 211 100.0% NativeChildren under 6 years - Living with one parent Native parent 915 100.0% NativeForeign-born parent 197 99.5% Native1 0.5% Foreign-bornChildren 6 to 17 years - Living with two parents Both parents native 1,083 100.0% NativeBoth parents foreign-born 1,195 85.6% Native200 14.4% Foreign-bornOne native, one foreign-born parent 291 100.0% NativeChildren 6 to 17 years - Living with one parent Native parent 1,097 100.0% NativeForeign-born parent 881 56.6% Native676 43.4% Foreign-born
Grandparents responsible for own grandchildren in Garden City
Grandparents (30 to 59 years) White / Caucasian 215 71.9% Responsible for grandchildren84 28.1% Not responsible for grandchildrenAmerican Indian / Alaska Native 2 100.0% Not responsible for grandchildrenOther race 28 100.0% Responsible for grandchildrenTwo or more races 37 100.0% Responsible for grandchildrenWhite alone, not Hispanic / Latino 42 67.4% Responsible for grandchildren20 32.6% Not responsible for grandchildrenHispanic or Latino 181 66.2% Responsible for grandchildren92 33.8% Not responsible for grandchildrenGrandparents (60 years and over) White / Caucasian 28 28.7% Responsible for grandchildren70 71.3% Not responsible for grandchildrenOther race 1 40.5% Responsible for grandchildren1 59.5% Not responsible for grandchildrenTwo or more races 21 92.6% Responsible for grandchildren2 7.4% Not responsible for grandchildrenWhite alone, not Hispanic / Latino 25 34.7% Responsible for grandchildren48 65.3% Not responsible for grandchildrenHispanic or Latino 23 46.2% Responsible for grandchildren27 53.8% Not responsible for grandchildren