Races in Garden City, Michigan (MI) Detailed Stats
Data:
Races - White alone (%)
Races - White alone (% change since 2000)
Races - Black alone (%)
Races - Black alone (% change since 2000)
Races - American Indian alone (%)
Races - American Indian alone (% change since 2000)
Races - Asian alone (%)
Races - Asian alone (% change since 2000)
Races - Hispanic (%)
Races - Hispanic (% change since 2000)
Races - Native Hawaiian and Other Pacific Islander alone (%)
Races - Native Hawaiian and Other Pacific Islander alone (% change since 2000)
Races - Two or more races(%)
Races - Two or more races(% change since 2000)
Races - Other race alone (%)
Races - Other race alone (% change since 2000)
Racial diversity
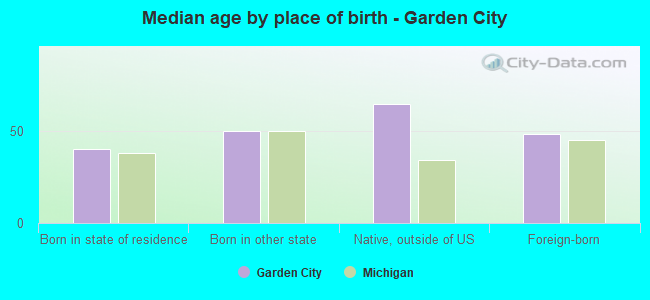
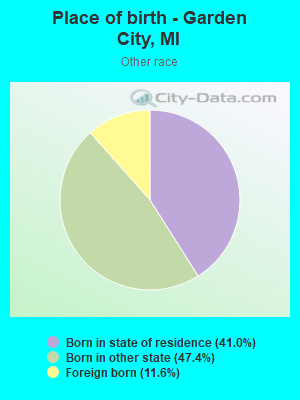
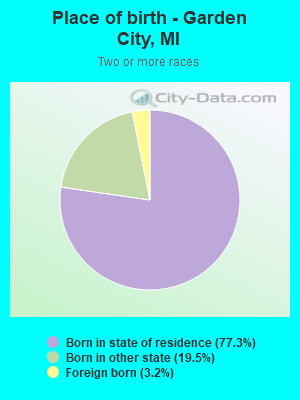
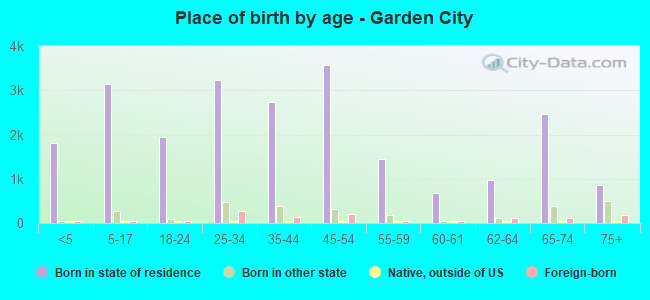
Place of birth - Born in state of residence (%)
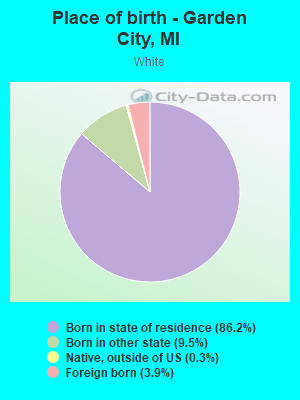
Place of birth - Born in state of residence (%) - White
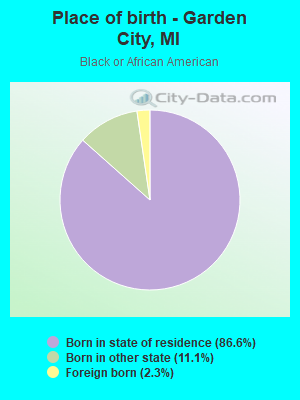
Place of birth - Born in state of residence (%) - Black or African American
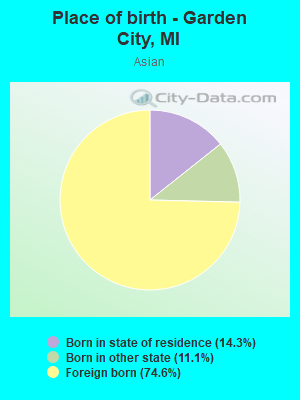
Place of birth - Born in state of residence (%) - Asian
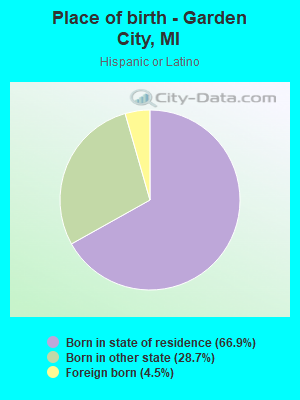
Place of birth - Born in state of residence (%) - Hispanic or Latino
Place of birth - Born in state of residence (%) - American Indian and Alaska Native
Place of birth - Born in state of residence (%) - Multirace
Place of birth - Born in state of residence (%) - Other Race
Place of birth - Born in other state (%)
Place of birth - Born in other state (%) - White
Place of birth - Born in other state (%) - Black or African American
Place of birth - Born in other state (%) - Asian
Place of birth - Born in other state (%) - Hispanic or Latino
Place of birth - Born in other state (%) - American Indian and Alaska Native
Place of birth - Born in other state (%) - Multirace
Place of birth - Born in other state (%) - Other Race
Place of birth - Native, outside of US (%)
Place of birth - Native, outside of US (%) - White
Place of birth - Native, outside of US (%) - Black or African American
Place of birth - Native, outside of US (%) - Asian
Place of birth - Native, outside of US (%) - Hispanic or Latino
Place of birth - Native, outside of US (%) - American Indian and Alaska Native
Place of birth - Native, outside of US (%) - Multirace
Place of birth - Native, outside of US (%) - Other Race
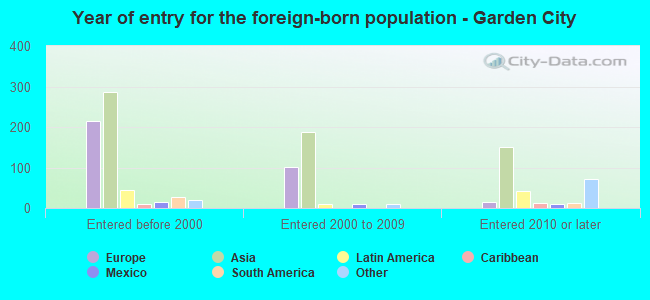
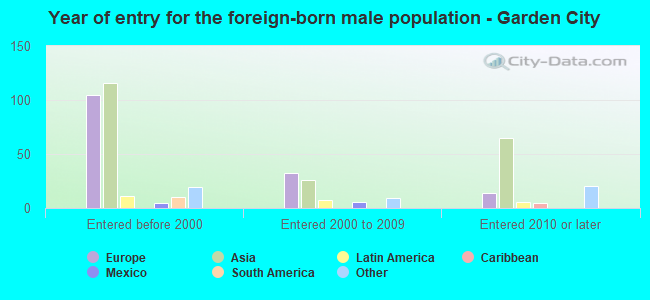
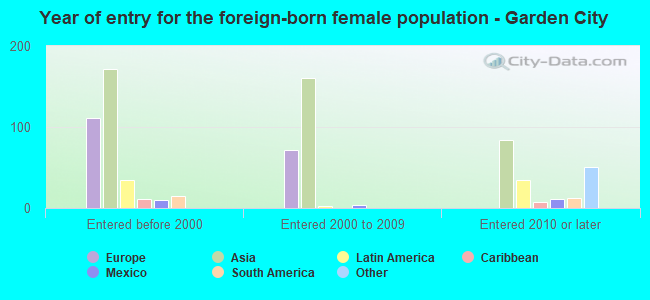
Place of birth - Foreign born (%)
Place of birth - Foreign born (%) - White
Place of birth - Foreign born (%) - Black or African American
Place of birth - Foreign born (%) - Asian
Place of birth - Foreign born (%) - Hispanic or Latino
Place of birth - Foreign born (%) - American Indian and Alaska Native
Place of birth - Foreign born (%) - Multirace
Place of birth - Foreign born (%) - Other Race
Residents speaking English at home (%)
Residents speaking English at home - Born in the United States (%)
Residents speaking English at home - Native, born elsewhere (%)
Residents speaking English at home - Foreign born (%)
Residents speaking Spanish at home (%)
Residents speaking Spanish at home - Born in the United States (%)
Residents speaking Spanish at home - Native, born elsewhere (%)
Residents speaking Spanish at home - Foreign born (%)
Residents speaking other language at home (%)
Residents speaking other language at home - Born in the United States (%)
Residents speaking other language at home - Native, born elsewhere (%)
Residents speaking other language at home - Foreign born (%)
Marital status - Never married (%)
Marital status - Now married (%)
Marital status - Separated (%)
Marital status - Widowed (%)
Marital status - Divorced (%)
Ancestries Reported - Arab (%)
Ancestries Reported - Czech (%)
Ancestries Reported - Danish (%)
Ancestries Reported - Dutch (%)
Ancestries Reported - English (%)
Ancestries Reported - French (%)
Ancestries Reported - French Canadian (%)
Ancestries Reported - German (%)
Ancestries Reported - Greek (%)
Ancestries Reported - Hungarian (%)
Ancestries Reported - Irish (%)
Ancestries Reported - Italian (%)
Ancestries Reported - Lithuanian (%)
Ancestries Reported - Norwegian (%)
Ancestries Reported - Polish (%)
Ancestries Reported - Portuguese (%)
Ancestries Reported - Russian (%)
Ancestries Reported - Scotch-Irish (%)
Ancestries Reported - Scottish (%)
Ancestries Reported - Slovak (%)
Ancestries Reported - Subsaharan African (%)
Ancestries Reported - Swedish (%)
Ancestries Reported - Swiss (%)
Ancestries Reported - Ukrainian (%)
Ancestries Reported - United States (%)
Ancestries Reported - Welsh (%)
Ancestries Reported - West Indian (%)
Ancestries Reported - Other (%)
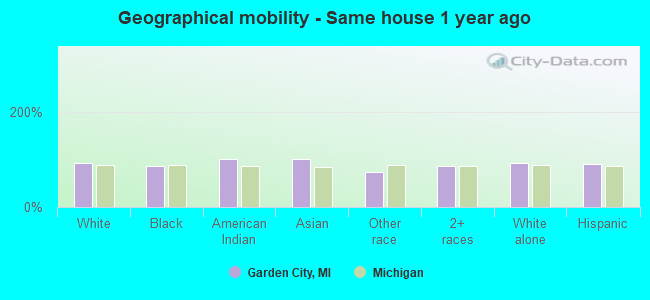
Geographical mobility - Same house 1 year ago (%)
Geographical mobility - Same house 1 year ago (%) - White
Geographical mobility - Same house 1 year ago (%) - Black or African American
Geographical mobility - Same house 1 year ago (%) - Asian
Geographical mobility - Same house 1 year ago (%) - Hispanic or Latino
Geographical mobility - Same house 1 year ago (%) - American Indian and Alaska Native
Geographical mobility - Same house 1 year ago (%) - Multirace
Geographical mobility - Same house 1 year ago (%) - Other Race
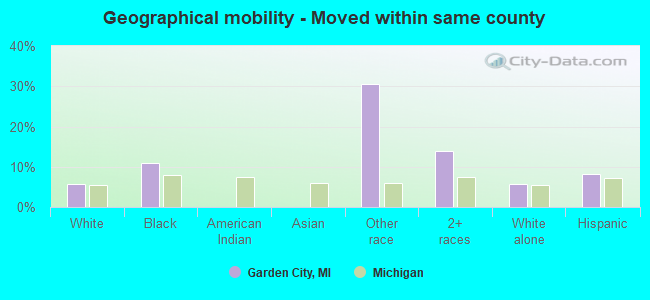
Geographical mobility - Moved within same county (%)
Geographical mobility - Moved within same county (%) - White
Geographical mobility - Moved within same county (%) - Black or African American
Geographical mobility - Moved within same county (%) - Asian
Geographical mobility - Moved within same county (%) - Hispanic or Latino
Geographical mobility - Moved within same county (%) - American Indian and Alaska Native
Geographical mobility - Moved within same county (%) - Multirace
Geographical mobility - Moved within same county (%) - Other Race
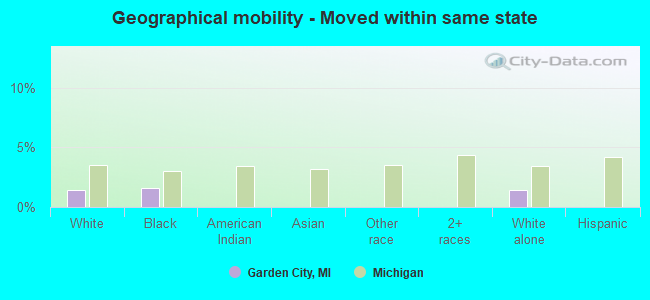
Geographical mobility - Moved from different county within same state (%)
Geographical mobility - Moved from different county within same state (%) - White
Geographical mobility - Moved from different county within same state (%) - Black or African American
Geographical mobility - Moved from different county within same state (%) - Asian
Geographical mobility - Moved from different county within same state (%) - Hispanic or Latino
Geographical mobility - Moved from different county within same state (%) - American Indian and Alaska Native
Geographical mobility - Moved from different county within same state (%) - Multirace
Geographical mobility - Moved from different county within same state (%) - Other Race
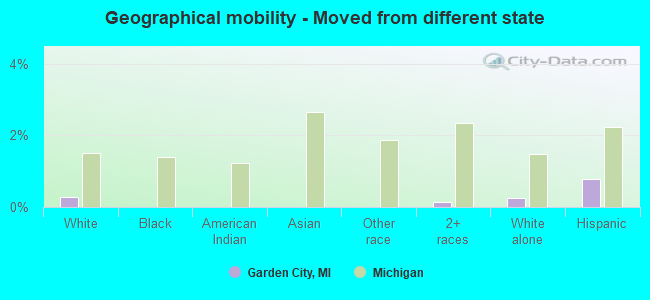
Geographical mobility - Moved from different state (%)
Geographical mobility - Moved from different state (%) - White
Geographical mobility - Moved from different state (%) - Black or African American
Geographical mobility - Moved from different state (%) - Asian
Geographical mobility - Moved from different state (%) - Hispanic or Latino
Geographical mobility - Moved from different state (%) - American Indian and Alaska Native
Geographical mobility - Moved from different state (%) - Multirace
Geographical mobility - Moved from different state (%) - Other Race
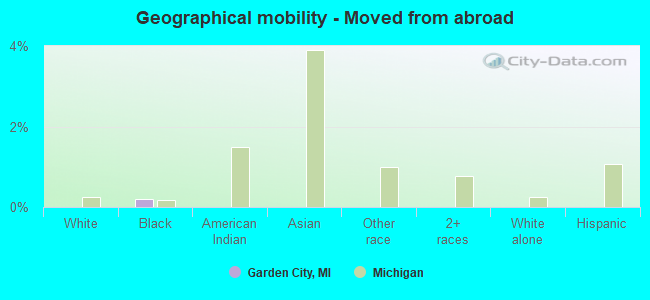
Geographical mobility - Moved from abroad (%)
Geographical mobility - Moved from abroad (%) - White
Geographical mobility - Moved from abroad (%) - Black or African American
Geographical mobility - Moved from abroad (%) - Asian
Geographical mobility - Moved from abroad (%) - Hispanic or Latino
Geographical mobility - Moved from abroad (%) - American Indian and Alaska Native
Geographical mobility - Moved from abroad (%) - Multirace
Geographical mobility - Moved from abroad (%) - Other Race
Place of birth for the foreign-born population - Ireland (%)
Place of birth for the foreign-born population - Denmark (%)
Place of birth for the foreign-born population - Norway (%)
Place of birth for the foreign-born population - Sweden (%)
Place of birth for the foreign-born population - United Kingdom (%)
Place of birth for the foreign-born population - England (%)
Place of birth for the foreign-born population - Scotland (%)
Place of birth for the foreign-born population - Other Northern Europe (%)
Place of birth for the foreign-born population - Austria (%)
Place of birth for the foreign-born population - Belgium (%)
Place of birth for the foreign-born population - France (%)
Place of birth for the foreign-born population - Germany (%)
Place of birth for the foreign-born population - Netherlands (%)
Place of birth for the foreign-born population - Switzerland (%)
Place of birth for the foreign-born population - Other Western Europe (%)
Place of birth for the foreign-born population - Greece (%)
Place of birth for the foreign-born population - Italy (%)
Place of birth for the foreign-born population - Portugal (%)
Place of birth for the foreign-born population - Spain (%)
Place of birth for the foreign-born population - Other Southern Europe (%)
Place of birth for the foreign-born population - Albania (%)
Place of birth for the foreign-born population - Belarus (%)
Place of birth for the foreign-born population - Bosnia and Herzegovina (%)
Place of birth for the foreign-born population - Bulgaria (%)
Place of birth for the foreign-born population - Croatia (%)
Place of birth for the foreign-born population - Czechoslovakia (%)
Place of birth for the foreign-born population - Hungary (%)
Place of birth for the foreign-born population - Latvia (%)
Place of birth for the foreign-born population - Lithuania (%)
Place of birth for the foreign-born population - North Macedonia (Macedonia) (%)
Place of birth for the foreign-born population - Moldova (%)
Place of birth for the foreign-born population - Poland (%)
Place of birth for the foreign-born population - Romania (%)
Place of birth for the foreign-born population - Russia (%)
Place of birth for the foreign-born population - Serbia (%)
Place of birth for the foreign-born population - Ukraine (%)
Place of birth for the foreign-born population - Other Eastern Europe (%)
Place of birth for the foreign-born population - China (%)
Place of birth for the foreign-born population - Hong Kong (%)
Place of birth for the foreign-born population - Taiwan (%)
Place of birth for the foreign-born population - Japan (%)
Place of birth for the foreign-born population - Korea (%)
Place of birth for the foreign-born population - Other Eastern Asia (%)
Place of birth for the foreign-born population - Afghanistan (%)
Place of birth for the foreign-born population - Bangladesh (%)
Place of birth for the foreign-born population - India (%)
Place of birth for the foreign-born population - Iran (%)
Place of birth for the foreign-born population - Kazakhstan (%)
Place of birth for the foreign-born population - Nepal (%)
Place of birth for the foreign-born population - Pakistan (%)
Place of birth for the foreign-born population - Sri Lanka (%)
Place of birth for the foreign-born population - Uzbekistan (%)
Place of birth for the foreign-born population - Other South Central Asia (%)
Place of birth for the foreign-born population - Burma (%)
Place of birth for the foreign-born population - Cambodia (%)
Place of birth for the foreign-born population - Indonesia (%)
Place of birth for the foreign-born population - Laos (%)
Place of birth for the foreign-born population - Malaysia (%)
Place of birth for the foreign-born population - Philippines (%)
Place of birth for the foreign-born population - Singapore (%)
Place of birth for the foreign-born population - Thailand (%)
Place of birth for the foreign-born population - Vietnam (%)
Place of birth for the foreign-born population - Other South Eastern Asia (%)
Place of birth for the foreign-born population - Armenia (%)
Place of birth for the foreign-born population - Iraq (%)
Place of birth for the foreign-born population - Israel (%)
Place of birth for the foreign-born population - Jordan (%)
Place of birth for the foreign-born population - Kuwait (%)
Place of birth for the foreign-born population - Lebanon (%)
Place of birth for the foreign-born population - Saudi Arabia (%)
Place of birth for the foreign-born population - Syria (%)
Place of birth for the foreign-born population - Turkey (%)
Place of birth for the foreign-born population - Yemen (%)
Place of birth for the foreign-born population - Other Western Asia (%)
Place of birth for the foreign-born population - Eritrea (%)
Place of birth for the foreign-born population - Ethiopia (%)
Place of birth for the foreign-born population - Kenya (%)
Place of birth for the foreign-born population - Somalia (%)
Place of birth for the foreign-born population - Uganda (%)
Place of birth for the foreign-born population - Zimbabwe (%)
Place of birth for the foreign-born population - Other Eastern Africa (%)
Place of birth for the foreign-born population - Cameroon (%)
Place of birth for the foreign-born population - Congo (%)
Place of birth for the foreign-born population - Democratic Republic of Congo (Zaire) (%)
Place of birth for the foreign-born population - Other Middle Africa (%)
Place of birth for the foreign-born population - Egypt (%)
Place of birth for the foreign-born population - Morocco (%)
Place of birth for the foreign-born population - Sudan (%)
Place of birth for the foreign-born population - Other Northern Africa (%)
Place of birth for the foreign-born population - South Africa (%)
Place of birth for the foreign-born population - Other Southern Africa (%)
Place of birth for the foreign-born population - Cabo Verde (%)
Place of birth for the foreign-born population - Ghana (%)
Place of birth for the foreign-born population - Liberia (%)
Place of birth for the foreign-born population - Nigeria (%)
Place of birth for the foreign-born population - Senegal (%)
Place of birth for the foreign-born population - Sierra Leone (%)
Place of birth for the foreign-born population - Other Western Africa (%)
Place of birth for the foreign-born population - Australia (%)
Place of birth for the foreign-born population - New Zealand (%)
Place of birth for the foreign-born population - Fiji (%)
Place of birth for the foreign-born population - Micronesia (%)
Place of birth for the foreign-born population - Bahamas (%)
Place of birth for the foreign-born population - Barbados (%)
Place of birth for the foreign-born population - Cuba (%)
Place of birth for the foreign-born population - Dominica (%)
Place of birth for the foreign-born population - Dominican Republic (%)
Place of birth for the foreign-born population - Grenada (%)
Place of birth for the foreign-born population - Haiti (%)
Place of birth for the foreign-born population - Jamaica (%)
Place of birth for the foreign-born population - St. Vincent and the Grenadines (%)
Place of birth for the foreign-born population - Trinidad and Tobago (%)
Place of birth for the foreign-born population - West Indies (%)
Place of birth for the foreign-born population - Other Caribbean (%)
Place of birth for the foreign-born population - Belize (%)
Place of birth for the foreign-born population - Costa Rica (%)
Place of birth for the foreign-born population - El Salvador (%)
Place of birth for the foreign-born population - Guatemala (%)
Place of birth for the foreign-born population - Honduras (%)
Place of birth for the foreign-born population - Mexico (%)
Place of birth for the foreign-born population - Nicaragua (%)
Place of birth for the foreign-born population - Panama (%)
Place of birth for the foreign-born population - Other Central America (%)
Place of birth for the foreign-born population - Argentina (%)
Place of birth for the foreign-born population - Bolivia (%)
Place of birth for the foreign-born population - Brazil (%)
Place of birth for the foreign-born population - Chile (%)
Place of birth for the foreign-born population - Colombia (%)
Place of birth for the foreign-born population - Ecuador (%)
Place of birth for the foreign-born population - Guyana (%)
Place of birth for the foreign-born population - Peru (%)
Place of birth for the foreign-born population - Uruguay (%)
Place of birth for the foreign-born population - Venezuela (%)
Place of birth for the foreign-born population - Other South America (%)
Place of birth for the foreign-born population - Canada (%)
Place of birth for the foreign-born population - Other Northern America (%)
Place of birth for the foreign-born population - Other (%)
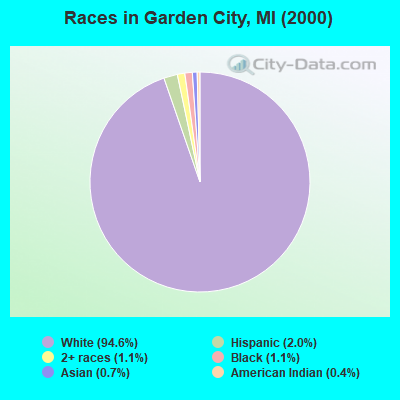
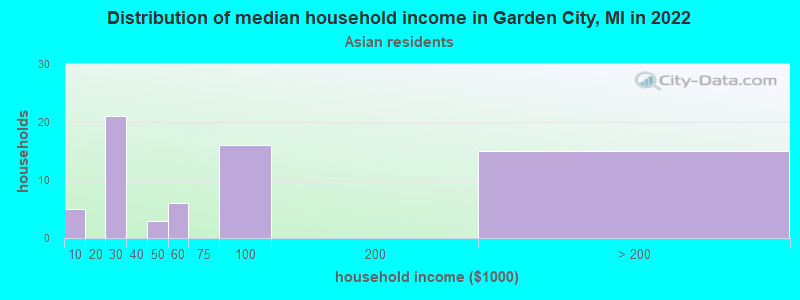
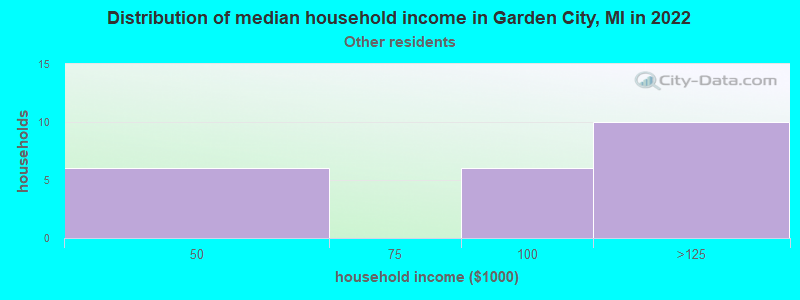
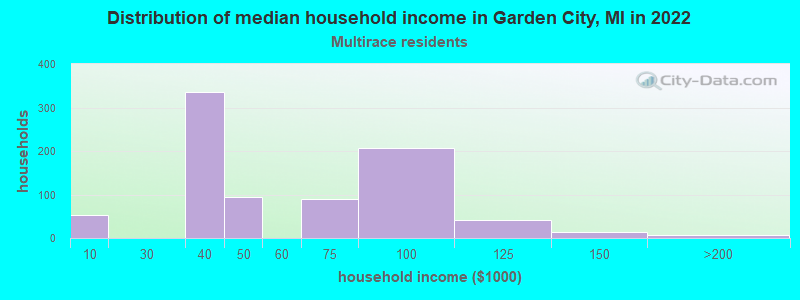
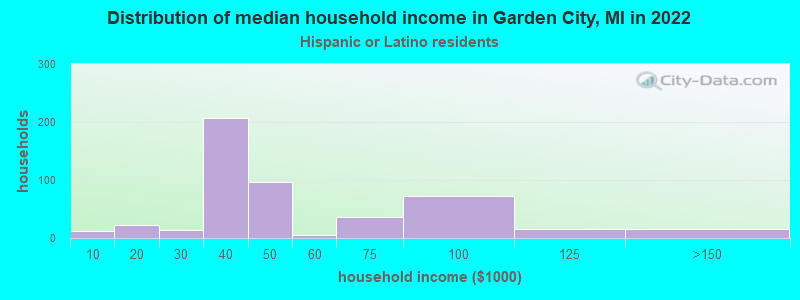
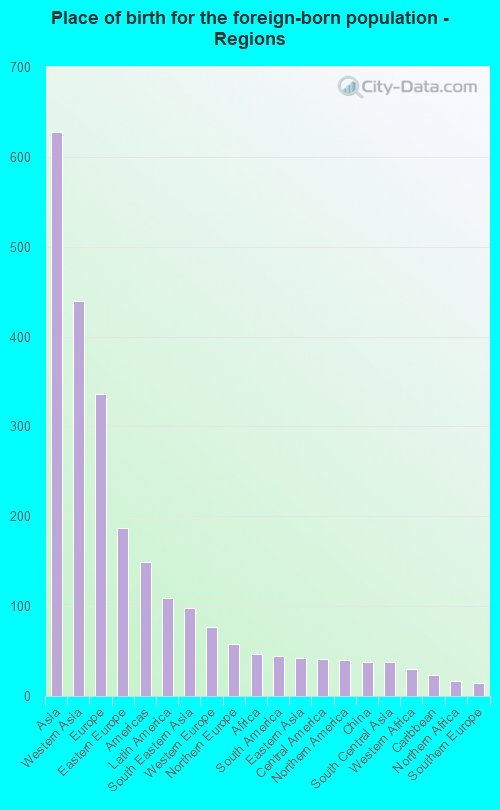
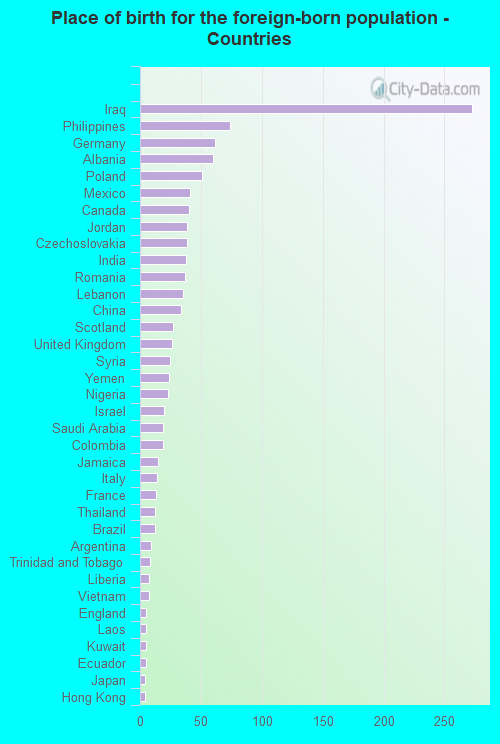
According to 2022 data, the most numerous races in Garden City, MI are White alone (22,403 residents), Black alone (1,596 residents), and Hispanic (1,335 residents). 93.4% of Garden City residents speak English at home. 4.3% of Garden City, MI residents are foreign-born (2.3% born in Asia, 1.2% born in Europe), which is 38.8% less than the foreign-born rate of 6.0% across the entire state of Michigan.
Race distribution in Garden City
2000 2022
7,806,691 78.6% White alone 1,402,047 14.1% Black alone 323,877 3.3% Hispanic 175,311 1.8% Asian alone 163,487 1.6% Two or more races 53,421 0.5% American Indian alone 11,465 0.1% Other race alone 2,145 0.02% Native Hawaiian and Other
7,289,051 72.6% White alone 1,310,464 13.1% Black alone 572,405 5.7% Hispanic 450,031 4.5% Two or more races 335,732 3.3% Asian alone 45,217 0.5% Other race alone 29,011 0.3% American Indian alone 2,207 0.02% Native Hawaiian and Other
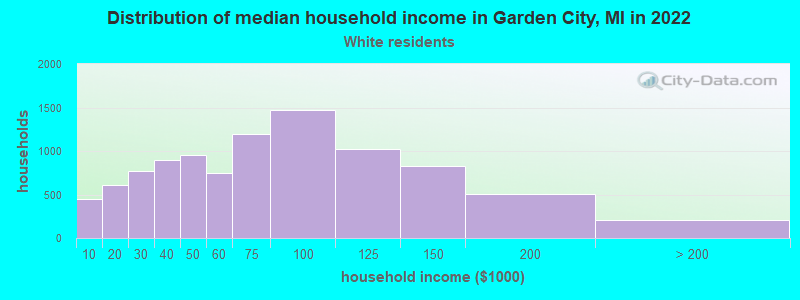
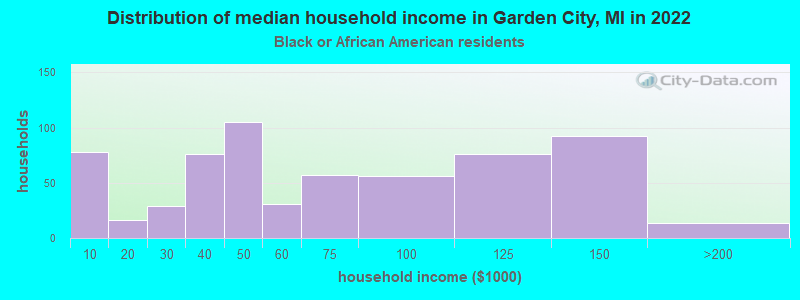
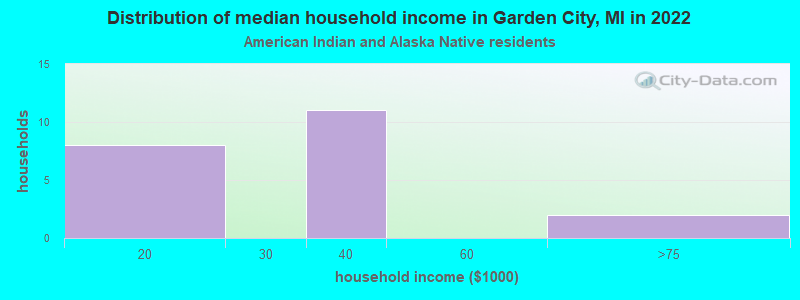
Income and house value in Garden City Median household income in 2022 $62,804 White non-Hispanic householders$50,358 Black householders$36,691 American Indian and Alaska Native householders$69,225 Asian householders$107,709 Some other race householders$44,182 Two or more races householders$46,787 Hispanic or Latino race householdersMedian 2022 house value $166,853 White Non-Hispanic householders$220,155 Black or African American householders$184,066 American Indian or Alaska Native householders $139,975 Asian householders$128,348 Native Hawaiian and other Pacific Islander householders$226,497 Some other race householders$205,055 Two or more races householders$183,160 Hispanic or Latino householders
Median age by race in Garden City
43.7 Median age for White residents42.5 45.4 31.8 Median age for Black or African American residents32.1 31.9 17.4 Median age for American Indian / Alaska Native residents16.5 16.3 50.6 Median age for Asian residents47.6 54.9 -934,108,526.2 Median age for Native Hawaiian / Pacific Islander residents-674,772,035.8 -699,588,476.7 30.8 Median age for Other race residents31.5 40.7 33.3 Median age for Two or more races residents26.3 43.4 43.6 Median age for White alone residents42.4 45.4 29.9 Median age for Hispanic or Latino residents27.7 35.1
Owner/renter occupied households by race in Garden City
House owners and renters - White residents 8,124 83.8% Owner occupied1,568 16.2% Renter occupiedHouse owners and renters - Black or African American residents 332 54.5% Owner occupied278 45.5% Renter occupiedHouse owners and renters - American Indian / Alaska Native residents 13 63.2% Owner occupied7 36.8% Renter occupiedHouse owners and renters - Asian residents 48 82.9% Owner occupied10 17.1% Renter occupiedHouse owners and renters - Other race residents 23 100.0% Owner occupiedHouse owners and renters - Two or more races residents 567 70.3% Owner occupied239 29.7% Renter occupiedHouse owners and renters - White alone residents 8,081 83.8% Owner occupied1,559 16.2% Renter occupiedHouse owners and renters - Hispanic or Latino residents 458 92.0% Owner occupied40 8.0% Renter occupied
Language usage in Garden City
English speakers - Total 93.4% of residents of Garden City speak English at home.
1.0% of residents speak Spanish at home 227 91.5% Speak English very well21 8.5% Speak English less than very well5.2% of residents speak other language at home 961 74.3% Speak English very well333 25.7% Speak English less than very well
English speakers - Born in the United States 96.0% of residents of Garden City speak English at home.
3.1% of residents speak Spanish at home 72 84.7% Speak English very well13 15.3% Speak English less than very well0.4% of residents speak other language at home 11 100.0% Speak English very well
All residents speak only English at home
English speakers - Foreign-born 23.1% of residents of Garden City speak English at home.
4.4% of residents speak Spanish at home 41 78.8% Speak English very well11 21.2% Speak English less than very well69.3% of residents speak other language at home 511 62.1% Speak English very well312 37.9% Speak English less than very well
White (Caucasian) - Speak only English Native:
98.5% (19,708)Foreign-born:
24.1% (213)
White (Caucasian) - Speak another language Native:
2.4% (481)Foreign-born:
76.1% (675)
Black or African American - Speak only English Native:
98.4% (1,421)Foreign-born:
34.9% (13)
Black or African American - Speak another language Native:
1.4% (20)Foreign-born:
64.6% (24)
Asian - Speak only English Native:
79.0% (48)Foreign-born:
20.8% (37)
Asian - Speak another language Native:
16.9% (10)Foreign-born:
80.3% (141)
Other race - Speak another language Native:
76.0% (62)Foreign-born:
100.0% (11)
Two or more races - Speak only English Native:
94.0% (1,770)Foreign-born:
26.0% (18)
Two or more races - Speak another language Native:
4.3% (81)Foreign-born:
70.4% (48)
White alone - Speak only English Native:
98.1% (19,535)Foreign-born:
22.3% (197)
White alone - Speak another language Native:
2.3% (465)Foreign-born:
77.5% (685)
Hispanic or Latino - Speak only English Native:
85.7% (979)Foreign-born:
22.9% (14)
Hispanic or Latino - Speak another language Native:
13.1% (149)Foreign-born:
72.7% (45)
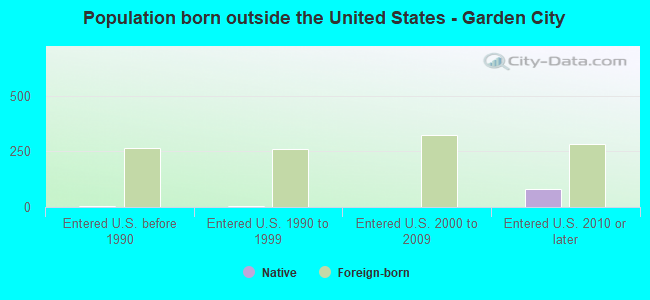
Foreign-born residents in Garden City 1,160 residents are foreign born (2.3% Asia , 1.2% Europe ).
This city:
4.3%Michigan:
6.9%
Marital status for residents in Garden City Marital status - White (Caucasian) population 15 years and over
Males 35.6% Never married47.9% Now married0.7% Separated3.8% Widowed12.0% DivorcedFemales 27.9% Never married45.5% Now married1.6% Separated10.4% Widowed14.5% DivorcedWomen who gave birth in the past 12 months Now married:
61.9% (167)Unmarried:
38.1% (103)
Women who did not give birth in the past 12 months Now married:
42.9% (2,053)Unmarried:
57.1% (2,735)
Marital status - Black or African American population 15 years and over
Males 62.7% Never married25.2% Now married0.0% Separated0.0% Widowed12.1% DivorcedFemales 54.0% Never married26.4% Now married0.0% Separated13.8% Widowed5.8% DivorcedWomen who gave birth in the past 12 months Now married:
6.7% (2)Unmarried:
93.3% (27)
Women who did not give birth in the past 12 months Now married:
37.5% (147)Unmarried:
62.5% (245)
Marital status - American Indian / Alaska Native population 15 years and over
Males 0.0% Never married88.2% Now married0.0% Separated0.0% Widowed11.8% DivorcedFemales 36.4% Never married42.4% Now married0.0% Separated0.0% Widowed21.2% DivorcedWomen who did not give birth in the past 12 months Now married:
53.8% (14)Unmarried:
46.2% (12)
Marital status - Asian population 15 years and over
Males 38.9% Never married61.1% Now married0.0% Separated0.0% Widowed0.0% DivorcedFemales 24.4% Never married45.0% Now married0.0% Separated21.3% Widowed9.4% DivorcedWomen who did not give birth in the past 12 months Now married:
35.0% (20)Unmarried:
65.0% (38)
Marital status - Other race population 15 years and over
Males 74.0% Never married10.0% Now married0.0% Separated0.0% Widowed16.0% DivorcedFemales 0.0% Never married58.8% Now married0.0% Separated0.0% Widowed41.2% DivorcedWomen who did not give birth in the past 12 months Now married:
100.0% (11)Unmarried:
0.0% (0)
Marital status - Two or more races population 15 years and over
Males 42.3% Never married42.3% Now married0.0% Separated0.8% Widowed14.5% DivorcedFemales 41.1% Never married44.4% Now married1.8% Separated7.8% Widowed4.8% DivorcedWomen who gave birth in the past 12 months Now married:
26.9% (10)Unmarried:
73.1% (27)
Women who did not give birth in the past 12 months Now married:
62.8% (305)Unmarried:
37.2% (180)
Marital status - White alone, not Hispanic / Latino population 15 years and over
Males 35.6% Never married48.2% Now married0.6% Separated3.8% Widowed11.8% DivorcedFemales 27.0% Never married46.2% Now married1.7% Separated10.7% Widowed14.5% DivorcedWomen who gave birth in the past 12 months Now married:
61.9% (170)Unmarried:
38.1% (105)
Women who did not give birth in the past 12 months Now married:
44.0% (2,086)Unmarried:
56.0% (2,652)
Marital status - Hispanic or Latino population 15 years and over
Males 43.0% Never married35.4% Now married2.3% Separated2.3% Widowed17.0% DivorcedFemales 40.7% Never married44.3% Now married0.0% Separated4.4% Widowed10.6% DivorcedWomen who did not give birth in the past 12 months Now married:
48.2% (196)Unmarried:
51.8% (211)
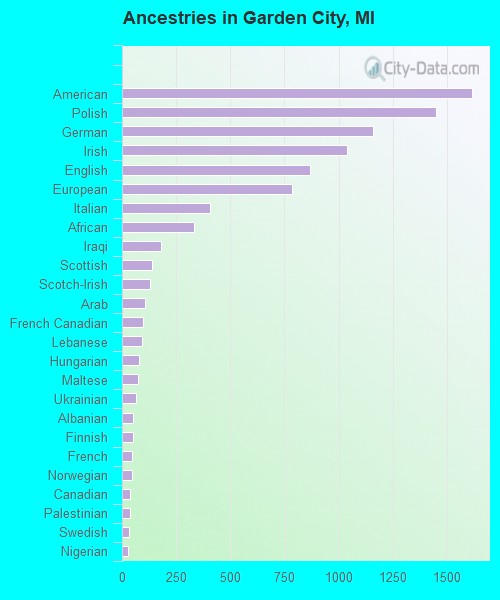
Ancestries in Garden City
1,614 13.8% American1,449 12.4% Polish1,158 9.9% German1,040 8.9% Irish870 7.4% English785 6.7% European408 3.5% Italian332 2.8% African180 1.5% Iraqi139 1.2% Scottish127 1.1% Scotch-Irish107 0.9% Arab96 0.8% French Canadian91 0.8% Lebanese77 0.7% Hungarian74 0.6% Maltese64 0.5% Ukrainian50 0.4% Albanian49 0.4% Finnish47 0.4% French45 0.4% Norwegian36 0.3% Canadian35 0.3% Palestinian32 0.3% Swedish30 0.3% Nigerian26 0.2% Danish25 0.2% Romanian24 0.2% Armenian24 0.2% Dutch24 0.2% Yugoslavian19 0.2% Austrian17 0.1% Welsh17 0.1% Greek16 0.1% Slovene16 0.1% British14 0.1% Jordanian12 0.1% Czechoslovakian12 0.1% Northern European11 0.09% Syrian11 0.09% Lithuanian10 0.09% Israeli10 0.09% Brazilian8 0.07% Belgian8 0.07% Celtic7 0.06% Macedonian6 0.05% Scandinavian5 0.04% Russian2 0.02% Jamaican
Geographical mobility in Garden City Same house 1 year ago 20,452 92.2% White (Caucasian)1,361 86.3% Black or African American86 100.0% American Indian / Alaska Native245 100.0% Asian67 73.3% Other race1,889 84.7% Two or more races20,395 92.1% White alone, not Hispanic / Latino1,198 90.0% Hispanic or LatinoMoved within same county 1,261 5.7% White / Caucasian172 10.9% Black or African American28 30.6% Other race308 13.8% Two or more races1,284 5.8% White alone, not Hispanic / Latino108 8.1% Hispanic or LatinoMoved within same state 315 1.4% White / Caucasian26 1.6% Black or African American321 1.4% White alone, not Hispanic / LatinoMoved from different state 65 0.3% White / Caucasian3 0.1% Two or more races55 0.2% White alone, not Hispanic / Latino11 0.8% Hispanic or LatinoMoved from abroad 3 0.2% Black or African American
Children Nativity (place of birth) in Garden City
Children under 6 years - Living with two parents Both parents native 989 100.0% NativeBoth parents foreign-born 190 100.0% NativeOne native, one foreign-born parent 73 100.0% NativeChildren under 6 years - Living with one parent Native parent 782 100.0% NativeForeign-born parent 11 100.0% NativeChildren 6 to 17 years - Living with two parents Both parents native 1,734 100.0% NativeBoth parents foreign-born 68 74.1% Native24 25.9% Foreign-bornOne native, one foreign-born parent 136 87.3% Native20 12.7% Foreign-bornChildren 6 to 17 years - Living with one parent Native parent 949 99.0% Native10 1.0% Foreign-born
Grandparents responsible for own grandchildren in Garden City
Grandparents (30 to 59 years) White / Caucasian 230 77.5% Responsible for grandchildren67 22.5% Not responsible for grandchildrenBlack or African American 11 100.0% Not responsible for grandchildrenTwo or more races 141 100.0% Responsible for grandchildrenWhite alone, not Hispanic / Latino 230 79.4% Responsible for grandchildren60 20.6% Not responsible for grandchildrenHispanic or Latino 115 77.8% Responsible for grandchildren33 22.2% Not responsible for grandchildrenGrandparents (60 years and over) White / Caucasian 68 20.2% Responsible for grandchildren267 79.8% Not responsible for grandchildrenBlack or African American 27 100.0% Not responsible for grandchildrenWhite alone, not Hispanic / Latino 63 20.3% Responsible for grandchildren248 79.7% Not responsible for grandchildrenHispanic or Latino 45 100.0% Not responsible for grandchildren