Races in Garden City Park, New York (NY) Detailed Stats
Data:
Races - White alone (%)
Races - White alone (% change since 2000)
Races - Black alone (%)
Races - Black alone (% change since 2000)
Races - American Indian alone (%)
Races - American Indian alone (% change since 2000)
Races - Asian alone (%)
Races - Asian alone (% change since 2000)
Races - Hispanic (%)
Races - Hispanic (% change since 2000)
Races - Native Hawaiian and Other Pacific Islander alone (%)
Races - Native Hawaiian and Other Pacific Islander alone (% change since 2000)
Races - Two or more races(%)
Races - Two or more races(% change since 2000)
Races - Other race alone (%)
Races - Other race alone (% change since 2000)
Racial diversity
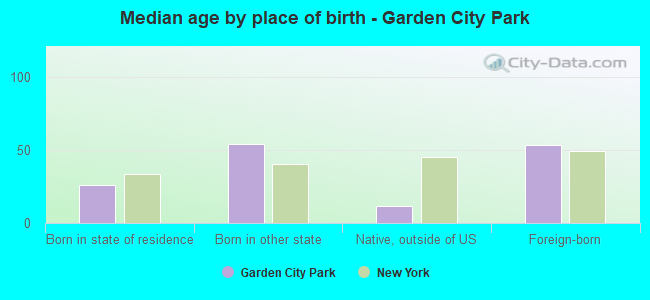
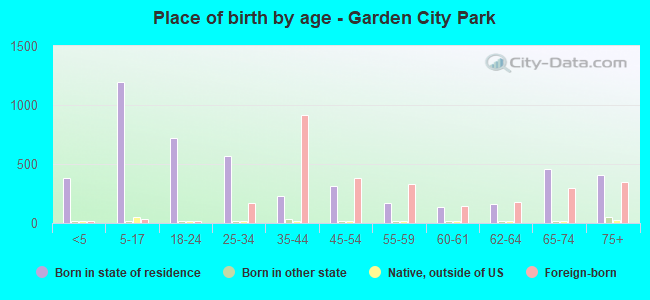
Place of birth - Born in state of residence (%)
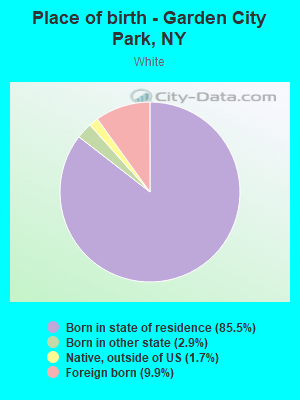
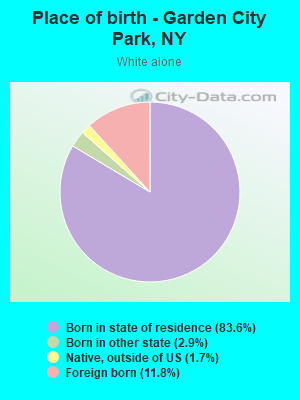
Place of birth - Born in state of residence (%) - White
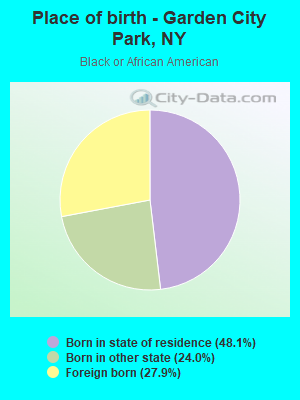
Place of birth - Born in state of residence (%) - Black or African American
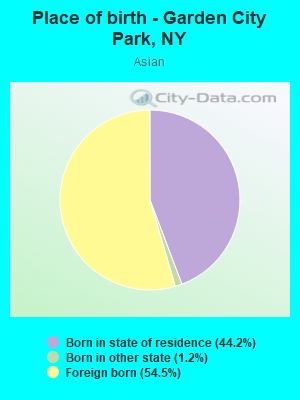
Place of birth - Born in state of residence (%) - Asian
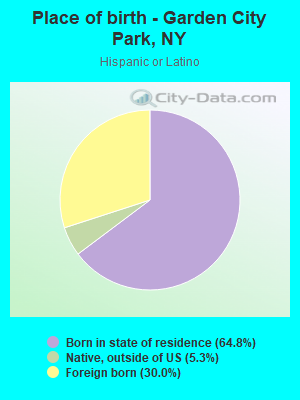
Place of birth - Born in state of residence (%) - Hispanic or Latino
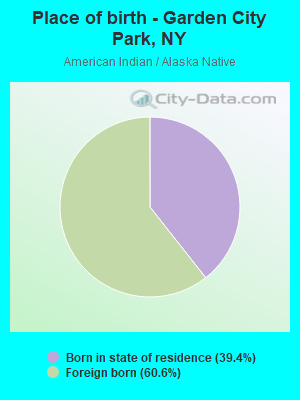
Place of birth - Born in state of residence (%) - American Indian and Alaska Native
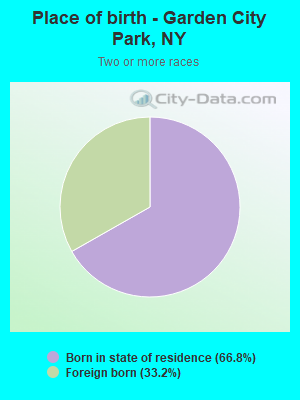
Place of birth - Born in state of residence (%) - Multirace
Place of birth - Born in state of residence (%) - Other Race
Place of birth - Born in other state (%)
Place of birth - Born in other state (%) - White
Place of birth - Born in other state (%) - Black or African American
Place of birth - Born in other state (%) - Asian
Place of birth - Born in other state (%) - Hispanic or Latino
Place of birth - Born in other state (%) - American Indian and Alaska Native
Place of birth - Born in other state (%) - Multirace
Place of birth - Born in other state (%) - Other Race
Place of birth - Native, outside of US (%)
Place of birth - Native, outside of US (%) - White
Place of birth - Native, outside of US (%) - Black or African American
Place of birth - Native, outside of US (%) - Asian
Place of birth - Native, outside of US (%) - Hispanic or Latino
Place of birth - Native, outside of US (%) - American Indian and Alaska Native
Place of birth - Native, outside of US (%) - Multirace
Place of birth - Native, outside of US (%) - Other Race
Place of birth - Foreign born (%)
Place of birth - Foreign born (%) - White
Place of birth - Foreign born (%) - Black or African American
Place of birth - Foreign born (%) - Asian
Place of birth - Foreign born (%) - Hispanic or Latino
Place of birth - Foreign born (%) - American Indian and Alaska Native
Place of birth - Foreign born (%) - Multirace
Place of birth - Foreign born (%) - Other Race
Residents speaking English at home (%)
Residents speaking English at home - Born in the United States (%)
Residents speaking English at home - Native, born elsewhere (%)
Residents speaking English at home - Foreign born (%)
Residents speaking Spanish at home (%)
Residents speaking Spanish at home - Born in the United States (%)
Residents speaking Spanish at home - Native, born elsewhere (%)
Residents speaking Spanish at home - Foreign born (%)
Residents speaking other language at home (%)
Residents speaking other language at home - Born in the United States (%)
Residents speaking other language at home - Native, born elsewhere (%)
Residents speaking other language at home - Foreign born (%)
Marital status - Never married (%)
Marital status - Now married (%)
Marital status - Separated (%)
Marital status - Widowed (%)
Marital status - Divorced (%)
Ancestries Reported - Arab (%)
Ancestries Reported - Czech (%)
Ancestries Reported - Danish (%)
Ancestries Reported - Dutch (%)
Ancestries Reported - English (%)
Ancestries Reported - French (%)
Ancestries Reported - French Canadian (%)
Ancestries Reported - German (%)
Ancestries Reported - Greek (%)
Ancestries Reported - Hungarian (%)
Ancestries Reported - Irish (%)
Ancestries Reported - Italian (%)
Ancestries Reported - Lithuanian (%)
Ancestries Reported - Norwegian (%)
Ancestries Reported - Polish (%)
Ancestries Reported - Portuguese (%)
Ancestries Reported - Russian (%)
Ancestries Reported - Scotch-Irish (%)
Ancestries Reported - Scottish (%)
Ancestries Reported - Slovak (%)
Ancestries Reported - Subsaharan African (%)
Ancestries Reported - Swedish (%)
Ancestries Reported - Swiss (%)
Ancestries Reported - Ukrainian (%)
Ancestries Reported - United States (%)
Ancestries Reported - Welsh (%)
Ancestries Reported - West Indian (%)
Ancestries Reported - Other (%)
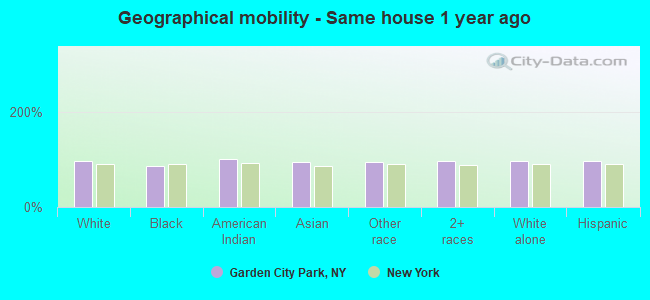
Geographical mobility - Same house 1 year ago (%)
Geographical mobility - Same house 1 year ago (%) - White
Geographical mobility - Same house 1 year ago (%) - Black or African American
Geographical mobility - Same house 1 year ago (%) - Asian
Geographical mobility - Same house 1 year ago (%) - Hispanic or Latino
Geographical mobility - Same house 1 year ago (%) - American Indian and Alaska Native
Geographical mobility - Same house 1 year ago (%) - Multirace
Geographical mobility - Same house 1 year ago (%) - Other Race
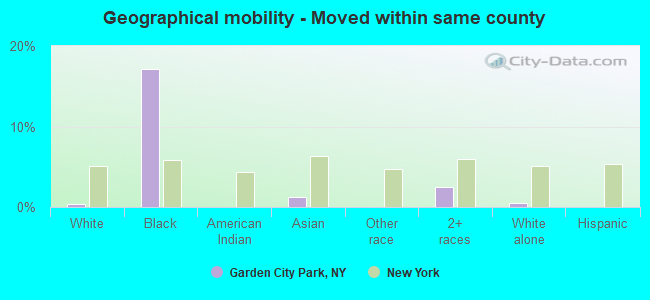
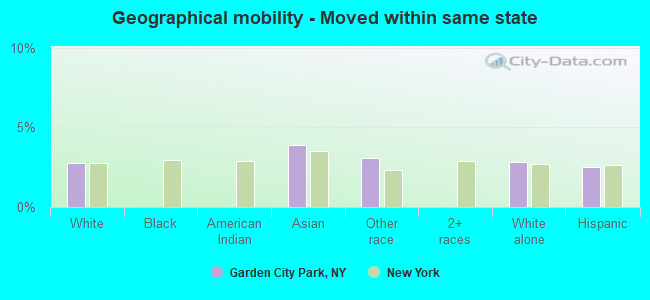
Geographical mobility - Moved within same county (%)
Geographical mobility - Moved within same county (%) - White
Geographical mobility - Moved within same county (%) - Black or African American
Geographical mobility - Moved within same county (%) - Asian
Geographical mobility - Moved within same county (%) - Hispanic or Latino
Geographical mobility - Moved within same county (%) - American Indian and Alaska Native
Geographical mobility - Moved within same county (%) - Multirace
Geographical mobility - Moved within same county (%) - Other Race
Geographical mobility - Moved from different county within same state (%)
Geographical mobility - Moved from different county within same state (%) - White
Geographical mobility - Moved from different county within same state (%) - Black or African American
Geographical mobility - Moved from different county within same state (%) - Asian
Geographical mobility - Moved from different county within same state (%) - Hispanic or Latino
Geographical mobility - Moved from different county within same state (%) - American Indian and Alaska Native
Geographical mobility - Moved from different county within same state (%) - Multirace
Geographical mobility - Moved from different county within same state (%) - Other Race
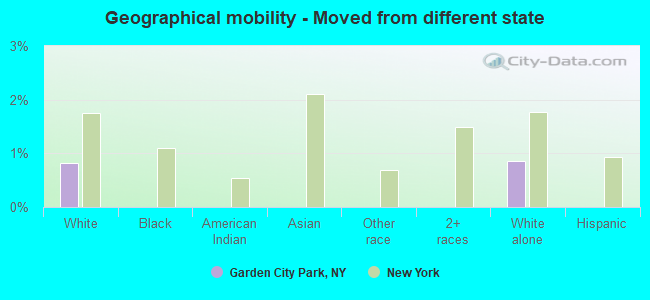
Geographical mobility - Moved from different state (%)
Geographical mobility - Moved from different state (%) - White
Geographical mobility - Moved from different state (%) - Black or African American
Geographical mobility - Moved from different state (%) - Asian
Geographical mobility - Moved from different state (%) - Hispanic or Latino
Geographical mobility - Moved from different state (%) - American Indian and Alaska Native
Geographical mobility - Moved from different state (%) - Multirace
Geographical mobility - Moved from different state (%) - Other Race
Geographical mobility - Moved from abroad (%)
Geographical mobility - Moved from abroad (%) - White
Geographical mobility - Moved from abroad (%) - Black or African American
Geographical mobility - Moved from abroad (%) - Asian
Geographical mobility - Moved from abroad (%) - Hispanic or Latino
Geographical mobility - Moved from abroad (%) - American Indian and Alaska Native
Geographical mobility - Moved from abroad (%) - Multirace
Geographical mobility - Moved from abroad (%) - Other Race
Place of birth for the foreign-born population - Ireland (%)
Place of birth for the foreign-born population - Denmark (%)
Place of birth for the foreign-born population - Norway (%)
Place of birth for the foreign-born population - Sweden (%)
Place of birth for the foreign-born population - United Kingdom (%)
Place of birth for the foreign-born population - England (%)
Place of birth for the foreign-born population - Scotland (%)
Place of birth for the foreign-born population - Other Northern Europe (%)
Place of birth for the foreign-born population - Austria (%)
Place of birth for the foreign-born population - Belgium (%)
Place of birth for the foreign-born population - France (%)
Place of birth for the foreign-born population - Germany (%)
Place of birth for the foreign-born population - Netherlands (%)
Place of birth for the foreign-born population - Switzerland (%)
Place of birth for the foreign-born population - Other Western Europe (%)
Place of birth for the foreign-born population - Greece (%)
Place of birth for the foreign-born population - Italy (%)
Place of birth for the foreign-born population - Portugal (%)
Place of birth for the foreign-born population - Spain (%)
Place of birth for the foreign-born population - Other Southern Europe (%)
Place of birth for the foreign-born population - Albania (%)
Place of birth for the foreign-born population - Belarus (%)
Place of birth for the foreign-born population - Bosnia and Herzegovina (%)
Place of birth for the foreign-born population - Bulgaria (%)
Place of birth for the foreign-born population - Croatia (%)
Place of birth for the foreign-born population - Czechoslovakia (%)
Place of birth for the foreign-born population - Hungary (%)
Place of birth for the foreign-born population - Latvia (%)
Place of birth for the foreign-born population - Lithuania (%)
Place of birth for the foreign-born population - North Macedonia (Macedonia) (%)
Place of birth for the foreign-born population - Moldova (%)
Place of birth for the foreign-born population - Poland (%)
Place of birth for the foreign-born population - Romania (%)
Place of birth for the foreign-born population - Russia (%)
Place of birth for the foreign-born population - Serbia (%)
Place of birth for the foreign-born population - Ukraine (%)
Place of birth for the foreign-born population - Other Eastern Europe (%)
Place of birth for the foreign-born population - China (%)
Place of birth for the foreign-born population - Hong Kong (%)
Place of birth for the foreign-born population - Taiwan (%)
Place of birth for the foreign-born population - Japan (%)
Place of birth for the foreign-born population - Korea (%)
Place of birth for the foreign-born population - Other Eastern Asia (%)
Place of birth for the foreign-born population - Afghanistan (%)
Place of birth for the foreign-born population - Bangladesh (%)
Place of birth for the foreign-born population - India (%)
Place of birth for the foreign-born population - Iran (%)
Place of birth for the foreign-born population - Kazakhstan (%)
Place of birth for the foreign-born population - Nepal (%)
Place of birth for the foreign-born population - Pakistan (%)
Place of birth for the foreign-born population - Sri Lanka (%)
Place of birth for the foreign-born population - Uzbekistan (%)
Place of birth for the foreign-born population - Other South Central Asia (%)
Place of birth for the foreign-born population - Burma (%)
Place of birth for the foreign-born population - Cambodia (%)
Place of birth for the foreign-born population - Indonesia (%)
Place of birth for the foreign-born population - Laos (%)
Place of birth for the foreign-born population - Malaysia (%)
Place of birth for the foreign-born population - Philippines (%)
Place of birth for the foreign-born population - Singapore (%)
Place of birth for the foreign-born population - Thailand (%)
Place of birth for the foreign-born population - Vietnam (%)
Place of birth for the foreign-born population - Other South Eastern Asia (%)
Place of birth for the foreign-born population - Armenia (%)
Place of birth for the foreign-born population - Iraq (%)
Place of birth for the foreign-born population - Israel (%)
Place of birth for the foreign-born population - Jordan (%)
Place of birth for the foreign-born population - Kuwait (%)
Place of birth for the foreign-born population - Lebanon (%)
Place of birth for the foreign-born population - Saudi Arabia (%)
Place of birth for the foreign-born population - Syria (%)
Place of birth for the foreign-born population - Turkey (%)
Place of birth for the foreign-born population - Yemen (%)
Place of birth for the foreign-born population - Other Western Asia (%)
Place of birth for the foreign-born population - Eritrea (%)
Place of birth for the foreign-born population - Ethiopia (%)
Place of birth for the foreign-born population - Kenya (%)
Place of birth for the foreign-born population - Somalia (%)
Place of birth for the foreign-born population - Uganda (%)
Place of birth for the foreign-born population - Zimbabwe (%)
Place of birth for the foreign-born population - Other Eastern Africa (%)
Place of birth for the foreign-born population - Cameroon (%)
Place of birth for the foreign-born population - Congo (%)
Place of birth for the foreign-born population - Democratic Republic of Congo (Zaire) (%)
Place of birth for the foreign-born population - Other Middle Africa (%)
Place of birth for the foreign-born population - Egypt (%)
Place of birth for the foreign-born population - Morocco (%)
Place of birth for the foreign-born population - Sudan (%)
Place of birth for the foreign-born population - Other Northern Africa (%)
Place of birth for the foreign-born population - South Africa (%)
Place of birth for the foreign-born population - Other Southern Africa (%)
Place of birth for the foreign-born population - Cabo Verde (%)
Place of birth for the foreign-born population - Ghana (%)
Place of birth for the foreign-born population - Liberia (%)
Place of birth for the foreign-born population - Nigeria (%)
Place of birth for the foreign-born population - Senegal (%)
Place of birth for the foreign-born population - Sierra Leone (%)
Place of birth for the foreign-born population - Other Western Africa (%)
Place of birth for the foreign-born population - Australia (%)
Place of birth for the foreign-born population - New Zealand (%)
Place of birth for the foreign-born population - Fiji (%)
Place of birth for the foreign-born population - Micronesia (%)
Place of birth for the foreign-born population - Bahamas (%)
Place of birth for the foreign-born population - Barbados (%)
Place of birth for the foreign-born population - Cuba (%)
Place of birth for the foreign-born population - Dominica (%)
Place of birth for the foreign-born population - Dominican Republic (%)
Place of birth for the foreign-born population - Grenada (%)
Place of birth for the foreign-born population - Haiti (%)
Place of birth for the foreign-born population - Jamaica (%)
Place of birth for the foreign-born population - St. Vincent and the Grenadines (%)
Place of birth for the foreign-born population - Trinidad and Tobago (%)
Place of birth for the foreign-born population - West Indies (%)
Place of birth for the foreign-born population - Other Caribbean (%)
Place of birth for the foreign-born population - Belize (%)
Place of birth for the foreign-born population - Costa Rica (%)
Place of birth for the foreign-born population - El Salvador (%)
Place of birth for the foreign-born population - Guatemala (%)
Place of birth for the foreign-born population - Honduras (%)
Place of birth for the foreign-born population - Mexico (%)
Place of birth for the foreign-born population - Nicaragua (%)
Place of birth for the foreign-born population - Panama (%)
Place of birth for the foreign-born population - Other Central America (%)
Place of birth for the foreign-born population - Argentina (%)
Place of birth for the foreign-born population - Bolivia (%)
Place of birth for the foreign-born population - Brazil (%)
Place of birth for the foreign-born population - Chile (%)
Place of birth for the foreign-born population - Colombia (%)
Place of birth for the foreign-born population - Ecuador (%)
Place of birth for the foreign-born population - Guyana (%)
Place of birth for the foreign-born population - Peru (%)
Place of birth for the foreign-born population - Uruguay (%)
Place of birth for the foreign-born population - Venezuela (%)
Place of birth for the foreign-born population - Other South America (%)
Place of birth for the foreign-born population - Canada (%)
Place of birth for the foreign-born population - Other Northern America (%)
Place of birth for the foreign-born population - Other (%)
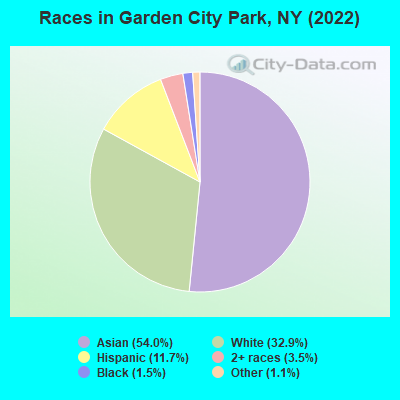
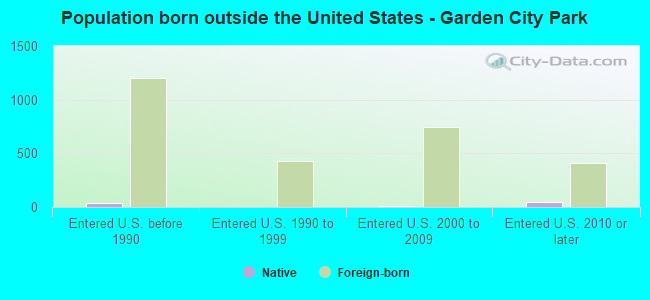
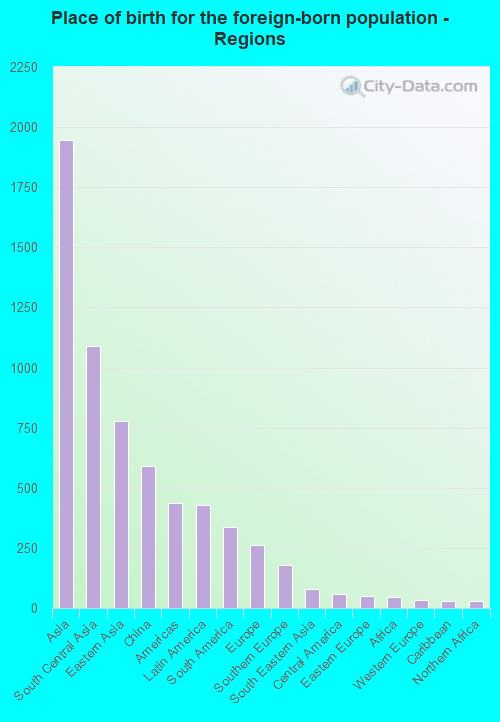
According to 2022 data, the most numerous races in Garden City Park, NY are White alone (2,544 residents), Hispanic (904 residents), and Black alone (114 residents). 52.3% of Garden City Park residents speak English at home. 34.7% of Garden City Park, NY residents are foreign-born (25.3% born in Asia, 5.6% born in Latin America), which is 36.7% greater than the foreign-born rate of 22.0% across the entire state of New York.
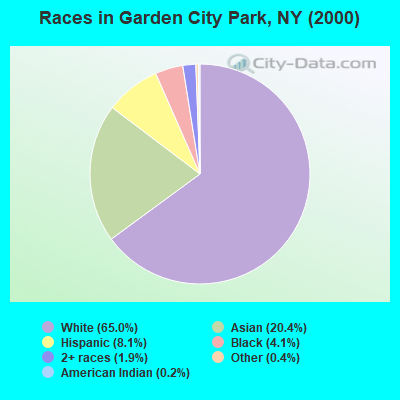
Race distribution in Garden City Park
2000 2022
11,760,981 62.0% White alone 2,867,583 15.1% Hispanic 2,812,623 14.8% Black alone 1,035,926 5.5% Asian alone 366,116 1.9% Two or more races 75,499 0.4% Other race alone 52,499 0.3% American Indian alone 5,230 0.03% Native Hawaiian and Other
10,408,933 52.9% White alone 3,867,299 19.7% Hispanic 2,633,840 13.4% Black alone 1,776,286 9.0% Asian alone 732,670 3.7% Two or more races 216,110 1.1% Other race alone 35,082 0.2% American Indian alone 6,931 0.04% Native Hawaiian and Other
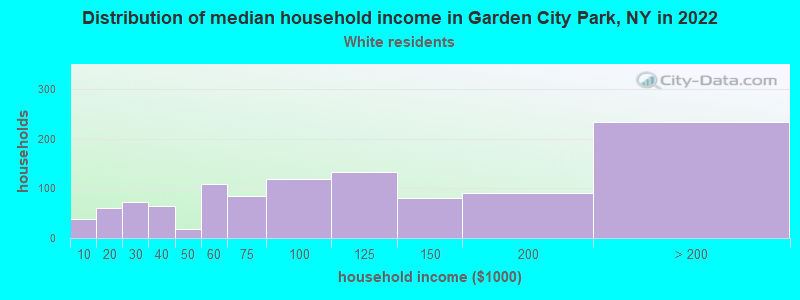
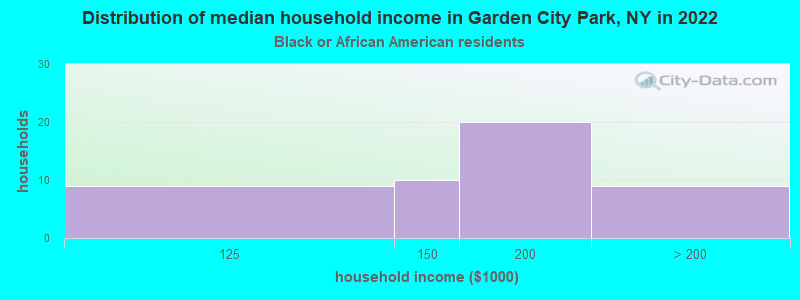
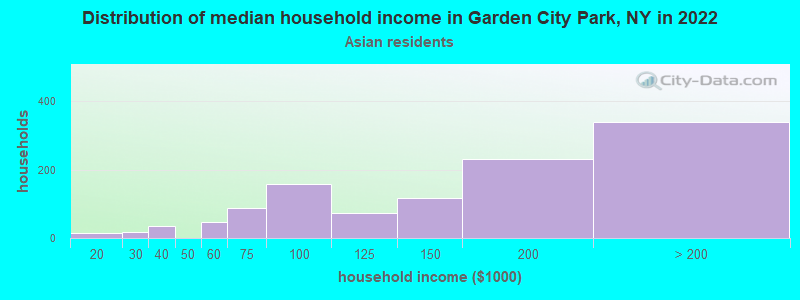
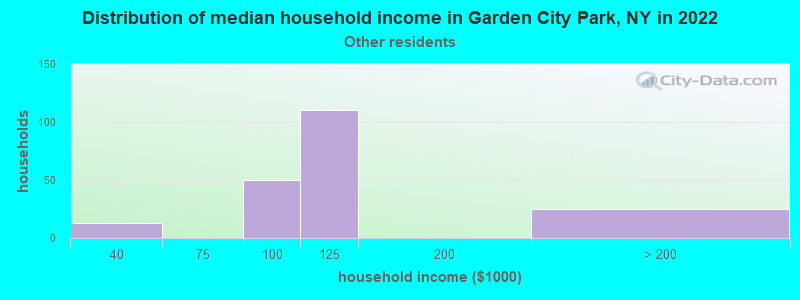
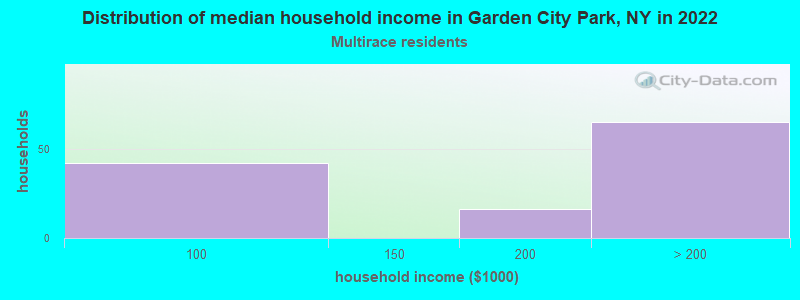
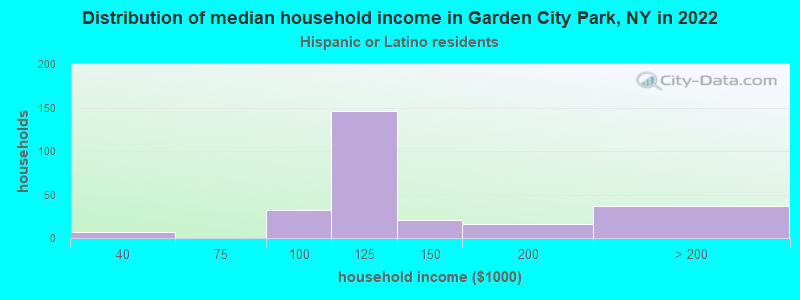
Income and house value in Garden City Park Median household income in 2022 $93,635 White non-Hispanic householders$163,474 Black householders$148,819 Asian householders$114,640 Some other race householdersover $200,000 Two or more races householders$113,367 Hispanic or Latino race householdersMedian 2022 house value $747,898 White Non-Hispanic householders$388,436 Black or African American householders $854,905 Asian householdersover $1,000,000 Some other race householders$692,243 Two or more races householders$653,514 Hispanic or Latino householders
Median age by race in Garden City Park
59.2 Median age for White residents54.3 62.1 66.3 Median age for Black or African American residents66.2 51.8 44.4 Median age for American Indian / Alaska Native residents-607,543,322.5 43.3 37.1 Median age for Asian residents28.4 40.2 -487,992,314.6 Median age for Native Hawaiian / Pacific Islander residents-477,502,295.2 -497,387,669.3 35.2 Median age for Other race residents35.4 34.9 29.9 Median age for Two or more races residents21.9 43.9 59.6 Median age for White alone residents53.7 62.3 33.8 Median age for Hispanic or Latino residents33.6 35.0
Owner/renter occupied households by race in Garden City Park
House owners and renters - White residents 921 83.4% Owner occupied183 16.6% Renter occupiedHouse owners and renters - Black or African American residents 35 80.8% Owner occupied8 19.2% Renter occupiedHouse owners and renters - American Indian / Alaska Native residents 43 100.0% Renter occupiedHouse owners and renters - Asian residents 1,057 93.7% Owner occupied72 6.3% Renter occupiedHouse owners and renters - Other race residents 100 49.5% Owner occupied102 50.5% Renter occupiedHouse owners and renters - Two or more races residents 91 70.2% Owner occupied38 29.8% Renter occupiedHouse owners and renters - White alone residents 901 82.1% Owner occupied197 17.9% Renter occupiedHouse owners and renters - Hispanic or Latino residents 126 49.9% Owner occupied126 50.1% Renter occupied
Language usage in Garden City Park
English speakers - Total 52.3% of residents of Garden City Park speak English at home.
6.7% of residents speak Spanish at home 334 67.6% Speak English very well160 32.4% Speak English less than very well42.6% of residents speak other language at home 1,700 54.2% Speak English very well1,439 45.8% Speak English less than very well
English speakers - Born in the United States 88.5% of residents of Garden City Park speak English at home.
8.5% of residents speak other language at home 14 100.0% Speak English less than very well
English speakers - Native, born elsewhere 75.0% of residents of Garden City Park speak English at home.
3.4% of residents speak Spanish at home 3 100.0% Speak English very well19.3% of residents speak other language at home 17 100.0% Speak English very well
English speakers - Foreign-born 19.8% of residents of Garden City Park speak English at home.
9.5% of residents speak Spanish at home 131 49.4% Speak English very well134 50.6% Speak English less than very well73.4% of residents speak other language at home 1,188 58.2% Speak English very well852 41.8% Speak English less than very well
White (Caucasian) - Speak only English Native:
95.4% (2,213)Foreign-born:
11.8% (30)
White (Caucasian) - Speak another language Native:
5.0% (116)Foreign-born:
84.4% (217)
Black or African American - Speak only English Native:
99.1% (82)Foreign-born:
99.0% (31)
American Indian / Alaska Native - Speak another language Native:
80.5% (39)Foreign-born:
100.0% (113)
Asian - Speak only English Native:
39.5% (633)Foreign-born:
20.2% (462)
Asian - Speak another language Native:
59.8% (960)Foreign-born:
77.7% (1,777)
Other race - Speak only English Native:
65.9% (236)Foreign-born:
11.8% (19)
Other race - Speak another language Native:
38.1% (136)Foreign-born:
86.9% (143)
Two or more races - Speak another language Native:
27.2% (72)Foreign-born:
100.0% (164)
White alone - Speak only English Native:
94.8% (2,122)Foreign-born:
10.7% (32)
White alone - Speak another language Native:
5.2% (116)Foreign-born:
89.8% (269)
Hispanic or Latino - Speak another language Native:
36.6% (200)Foreign-born:
100.0% (272)
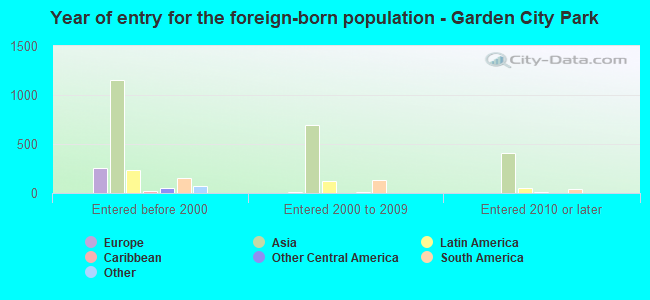
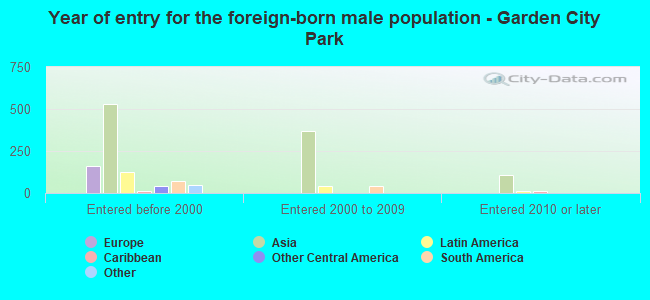
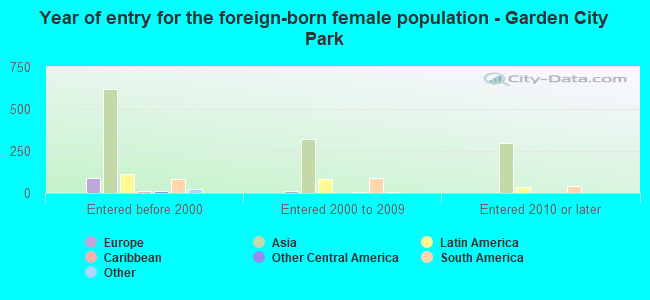
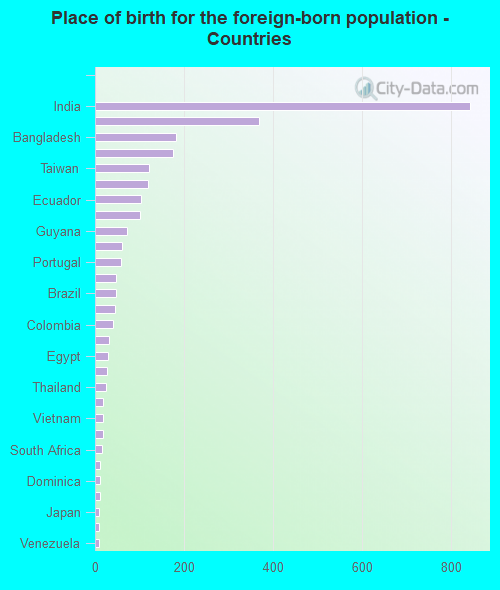
Foreign-born residents in Garden City Park 2,690 residents are foreign born (25.3% Asia , 5.6% Latin America ).
This city:
34.7%New York:
22.6%
Marital status for residents in Garden City Park Marital status - White (Caucasian) population 15 years and over
Males 36.2% Never married58.3% Now married0.9% Separated1.4% Widowed3.3% DivorcedFemales 19.7% Never married56.4% Now married0.0% Separated15.4% Widowed8.5% DivorcedWomen who did not give birth in the past 12 months Now married:
49.2% (147)Unmarried:
50.8% (151)
Marital status - Black or African American population 15 years and over
Males 28.6% Never married38.6% Now married18.6% Separated14.3% Widowed0.0% DivorcedFemales 34.1% Never married65.9% Now married0.0% Separated0.0% Widowed0.0% DivorcedWomen who did not give birth in the past 12 months Now married:
50.0% (14)Unmarried:
50.0% (14)
Marital status - American Indian / Alaska Native population 15 years and over
Males 0.0% Never married100.0% Now married0.0% Separated0.0% Widowed0.0% DivorcedFemales 42.3% Never married57.7% Now married0.0% Separated0.0% Widowed0.0% DivorcedWomen who did not give birth in the past 12 months Now married:
51.6% (46)Unmarried:
48.4% (43)
Marital status - Asian population 15 years and over
Males 30.0% Never married65.8% Now married0.8% Separated0.8% Widowed2.6% DivorcedFemales 23.9% Never married61.5% Now married0.8% Separated11.5% Widowed2.4% DivorcedWomen who gave birth in the past 12 months Now married:
100.0% (57)Unmarried:
0.0% (0)
Women who did not give birth in the past 12 months Now married:
56.9% (490)Unmarried:
43.1% (371)
Marital status - Other race population 15 years and over
Males 12.7% Never married74.6% Now married0.0% Separated0.0% Widowed12.7% DivorcedFemales 3.2% Never married87.9% Now married8.9% Separated0.0% Widowed0.0% DivorcedWomen who gave birth in the past 12 months Now married:
100.0% (15)Unmarried:
0.0% (0)
Women who did not give birth in the past 12 months Now married:
94.5% (98)Unmarried:
5.5% (6)
Marital status - Two or more races population 15 years and over
Males 54.4% Never married45.6% Now married0.0% Separated0.0% Widowed0.0% DivorcedFemales 19.4% Never married62.1% Now married0.0% Separated6.5% Widowed12.1% DivorcedWomen who did not give birth in the past 12 months Now married:
50.0% (50)Unmarried:
50.0% (50)
Marital status - White alone, not Hispanic / Latino population 15 years and over
Males 36.3% Never married58.8% Now married0.0% Separated1.5% Widowed3.4% DivorcedFemales 17.9% Never married56.9% Now married0.0% Separated16.7% Widowed8.5% DivorcedWomen who did not give birth in the past 12 months Now married:
55.4% (151)Unmarried:
44.6% (121)
Marital status - Hispanic or Latino population 15 years and over
Males 28.9% Never married64.6% Now married2.9% Separated0.0% Widowed3.6% DivorcedFemales 23.6% Never married69.3% Now married0.0% Separated2.5% Widowed4.6% DivorcedWomen who gave birth in the past 12 months Now married:
100.0% (13)Unmarried:
0.0% (0)
Women who did not give birth in the past 12 months Now married:
58.8% (109)Unmarried:
41.2% (76)
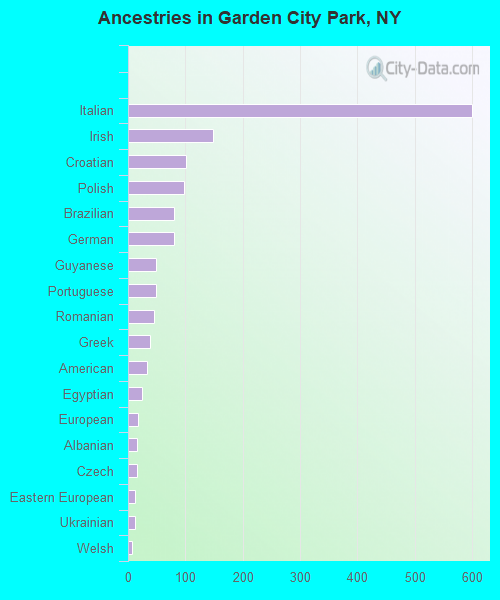
Ancestries in Garden City Park
600 11.9% Italian148 2.9% Irish101 2.0% Croatian98 1.9% Polish80 1.6% Brazilian80 1.6% German49 1.0% Guyanese49 1.0% Portuguese45 0.9% Romanian38 0.8% Greek33 0.7% American25 0.5% Egyptian18 0.4% European15 0.3% Albanian15 0.3% Czech13 0.3% Eastern European12 0.2% Ukrainian7 0.1% Welsh5 0.10% Armenian5 0.10% Russian4 0.08% Slavic3 0.06% Austrian
Children Nativity (place of birth) in Garden City Park
Children under 6 years - Living with two parents Both parents native 6 100.0% NativeBoth parents foreign-born 315 100.0% NativeOne native, one foreign-born parent 56 100.0% NativeChildren under 6 years - Living with one parent Native parent 19 100.0% NativeForeign-born parent 63 100.0% NativeChildren 6 to 17 years - Living with two parents Both parents native 377 100.0% NativeBoth parents foreign-born 457 94.5% Native26 5.5% Foreign-bornOne native, one foreign-born parent 202 100.0% NativeChildren 6 to 17 years - Living with one parent Native parent 37 100.0% NativeForeign-born parent 77 50.3% Native76 49.7% Foreign-born
Grandparents responsible for own grandchildren in Garden City Park
Grandparents (30 to 59 years) White / Caucasian 5 100.0% Responsible for grandchildrenAsian 60 100.0% Not responsible for grandchildrenHispanic or Latino 6 100.0% Responsible for grandchildrenGrandparents (60 years and over) White / Caucasian 17 23.7% Responsible for grandchildren53 76.3% Not responsible for grandchildrenAsian 155 100.0% Not responsible for grandchildren