Races in Gardnerville Ranchos, Nevada (NV) Detailed Stats
Data:
Races - White alone (%)
Races - White alone (% change since 2000)
Races - Black alone (%)
Races - Black alone (% change since 2000)
Races - American Indian alone (%)
Races - American Indian alone (% change since 2000)
Races - Asian alone (%)
Races - Asian alone (% change since 2000)
Races - Hispanic (%)
Races - Hispanic (% change since 2000)
Races - Native Hawaiian and Other Pacific Islander alone (%)
Races - Native Hawaiian and Other Pacific Islander alone (% change since 2000)
Races - Two or more races(%)
Races - Two or more races(% change since 2000)
Races - Other race alone (%)
Races - Other race alone (% change since 2000)
Racial diversity
Place of birth - Born in state of residence (%)
Place of birth - Born in state of residence (%) - White
Place of birth - Born in state of residence (%) - Black or African American
Place of birth - Born in state of residence (%) - Asian
Place of birth - Born in state of residence (%) - Hispanic or Latino
Place of birth - Born in state of residence (%) - American Indian and Alaska Native
Place of birth - Born in state of residence (%) - Multirace
Place of birth - Born in state of residence (%) - Other Race
Place of birth - Born in other state (%)
Place of birth - Born in other state (%) - White
Place of birth - Born in other state (%) - Black or African American
Place of birth - Born in other state (%) - Asian
Place of birth - Born in other state (%) - Hispanic or Latino
Place of birth - Born in other state (%) - American Indian and Alaska Native
Place of birth - Born in other state (%) - Multirace
Place of birth - Born in other state (%) - Other Race
Place of birth - Native, outside of US (%)
Place of birth - Native, outside of US (%) - White
Place of birth - Native, outside of US (%) - Black or African American
Place of birth - Native, outside of US (%) - Asian
Place of birth - Native, outside of US (%) - Hispanic or Latino
Place of birth - Native, outside of US (%) - American Indian and Alaska Native
Place of birth - Native, outside of US (%) - Multirace
Place of birth - Native, outside of US (%) - Other Race
Place of birth - Foreign born (%)
Place of birth - Foreign born (%) - White
Place of birth - Foreign born (%) - Black or African American
Place of birth - Foreign born (%) - Asian
Place of birth - Foreign born (%) - Hispanic or Latino
Place of birth - Foreign born (%) - American Indian and Alaska Native
Place of birth - Foreign born (%) - Multirace
Place of birth - Foreign born (%) - Other Race
Residents speaking English at home (%)
Residents speaking English at home - Born in the United States (%)
Residents speaking English at home - Native, born elsewhere (%)
Residents speaking English at home - Foreign born (%)
Residents speaking Spanish at home (%)
Residents speaking Spanish at home - Born in the United States (%)
Residents speaking Spanish at home - Native, born elsewhere (%)
Residents speaking Spanish at home - Foreign born (%)
Residents speaking other language at home (%)
Residents speaking other language at home - Born in the United States (%)
Residents speaking other language at home - Native, born elsewhere (%)
Residents speaking other language at home - Foreign born (%)
Marital status - Never married (%)
Marital status - Now married (%)
Marital status - Separated (%)
Marital status - Widowed (%)
Marital status - Divorced (%)
Ancestries Reported - Arab (%)
Ancestries Reported - Czech (%)
Ancestries Reported - Danish (%)
Ancestries Reported - Dutch (%)
Ancestries Reported - English (%)
Ancestries Reported - French (%)
Ancestries Reported - French Canadian (%)
Ancestries Reported - German (%)
Ancestries Reported - Greek (%)
Ancestries Reported - Hungarian (%)
Ancestries Reported - Irish (%)
Ancestries Reported - Italian (%)
Ancestries Reported - Lithuanian (%)
Ancestries Reported - Norwegian (%)
Ancestries Reported - Polish (%)
Ancestries Reported - Portuguese (%)
Ancestries Reported - Russian (%)
Ancestries Reported - Scotch-Irish (%)
Ancestries Reported - Scottish (%)
Ancestries Reported - Slovak (%)
Ancestries Reported - Subsaharan African (%)
Ancestries Reported - Swedish (%)
Ancestries Reported - Swiss (%)
Ancestries Reported - Ukrainian (%)
Ancestries Reported - United States (%)
Ancestries Reported - Welsh (%)
Ancestries Reported - West Indian (%)
Ancestries Reported - Other (%)
Geographical mobility - Same house 1 year ago (%)
Geographical mobility - Same house 1 year ago (%) - White
Geographical mobility - Same house 1 year ago (%) - Black or African American
Geographical mobility - Same house 1 year ago (%) - Asian
Geographical mobility - Same house 1 year ago (%) - Hispanic or Latino
Geographical mobility - Same house 1 year ago (%) - American Indian and Alaska Native
Geographical mobility - Same house 1 year ago (%) - Multirace
Geographical mobility - Same house 1 year ago (%) - Other Race
Geographical mobility - Moved within same county (%)
Geographical mobility - Moved within same county (%) - White
Geographical mobility - Moved within same county (%) - Black or African American
Geographical mobility - Moved within same county (%) - Asian
Geographical mobility - Moved within same county (%) - Hispanic or Latino
Geographical mobility - Moved within same county (%) - American Indian and Alaska Native
Geographical mobility - Moved within same county (%) - Multirace
Geographical mobility - Moved within same county (%) - Other Race
Geographical mobility - Moved from different county within same state (%)
Geographical mobility - Moved from different county within same state (%) - White
Geographical mobility - Moved from different county within same state (%) - Black or African American
Geographical mobility - Moved from different county within same state (%) - Asian
Geographical mobility - Moved from different county within same state (%) - Hispanic or Latino
Geographical mobility - Moved from different county within same state (%) - American Indian and Alaska Native
Geographical mobility - Moved from different county within same state (%) - Multirace
Geographical mobility - Moved from different county within same state (%) - Other Race
Geographical mobility - Moved from different state (%)
Geographical mobility - Moved from different state (%) - White
Geographical mobility - Moved from different state (%) - Black or African American
Geographical mobility - Moved from different state (%) - Asian
Geographical mobility - Moved from different state (%) - Hispanic or Latino
Geographical mobility - Moved from different state (%) - American Indian and Alaska Native
Geographical mobility - Moved from different state (%) - Multirace
Geographical mobility - Moved from different state (%) - Other Race
Geographical mobility - Moved from abroad (%)
Geographical mobility - Moved from abroad (%) - White
Geographical mobility - Moved from abroad (%) - Black or African American
Geographical mobility - Moved from abroad (%) - Asian
Geographical mobility - Moved from abroad (%) - Hispanic or Latino
Geographical mobility - Moved from abroad (%) - American Indian and Alaska Native
Geographical mobility - Moved from abroad (%) - Multirace
Geographical mobility - Moved from abroad (%) - Other Race
Place of birth for the foreign-born population - Ireland (%)
Place of birth for the foreign-born population - Denmark (%)
Place of birth for the foreign-born population - Norway (%)
Place of birth for the foreign-born population - Sweden (%)
Place of birth for the foreign-born population - United Kingdom (%)
Place of birth for the foreign-born population - England (%)
Place of birth for the foreign-born population - Scotland (%)
Place of birth for the foreign-born population - Other Northern Europe (%)
Place of birth for the foreign-born population - Austria (%)
Place of birth for the foreign-born population - Belgium (%)
Place of birth for the foreign-born population - France (%)
Place of birth for the foreign-born population - Germany (%)
Place of birth for the foreign-born population - Netherlands (%)
Place of birth for the foreign-born population - Switzerland (%)
Place of birth for the foreign-born population - Other Western Europe (%)
Place of birth for the foreign-born population - Greece (%)
Place of birth for the foreign-born population - Italy (%)
Place of birth for the foreign-born population - Portugal (%)
Place of birth for the foreign-born population - Spain (%)
Place of birth for the foreign-born population - Other Southern Europe (%)
Place of birth for the foreign-born population - Albania (%)
Place of birth for the foreign-born population - Belarus (%)
Place of birth for the foreign-born population - Bosnia and Herzegovina (%)
Place of birth for the foreign-born population - Bulgaria (%)
Place of birth for the foreign-born population - Croatia (%)
Place of birth for the foreign-born population - Czechoslovakia (%)
Place of birth for the foreign-born population - Hungary (%)
Place of birth for the foreign-born population - Latvia (%)
Place of birth for the foreign-born population - Lithuania (%)
Place of birth for the foreign-born population - North Macedonia (Macedonia) (%)
Place of birth for the foreign-born population - Moldova (%)
Place of birth for the foreign-born population - Poland (%)
Place of birth for the foreign-born population - Romania (%)
Place of birth for the foreign-born population - Russia (%)
Place of birth for the foreign-born population - Serbia (%)
Place of birth for the foreign-born population - Ukraine (%)
Place of birth for the foreign-born population - Other Eastern Europe (%)
Place of birth for the foreign-born population - China (%)
Place of birth for the foreign-born population - Hong Kong (%)
Place of birth for the foreign-born population - Taiwan (%)
Place of birth for the foreign-born population - Japan (%)
Place of birth for the foreign-born population - Korea (%)
Place of birth for the foreign-born population - Other Eastern Asia (%)
Place of birth for the foreign-born population - Afghanistan (%)
Place of birth for the foreign-born population - Bangladesh (%)
Place of birth for the foreign-born population - India (%)
Place of birth for the foreign-born population - Iran (%)
Place of birth for the foreign-born population - Kazakhstan (%)
Place of birth for the foreign-born population - Nepal (%)
Place of birth for the foreign-born population - Pakistan (%)
Place of birth for the foreign-born population - Sri Lanka (%)
Place of birth for the foreign-born population - Uzbekistan (%)
Place of birth for the foreign-born population - Other South Central Asia (%)
Place of birth for the foreign-born population - Burma (%)
Place of birth for the foreign-born population - Cambodia (%)
Place of birth for the foreign-born population - Indonesia (%)
Place of birth for the foreign-born population - Laos (%)
Place of birth for the foreign-born population - Malaysia (%)
Place of birth for the foreign-born population - Philippines (%)
Place of birth for the foreign-born population - Singapore (%)
Place of birth for the foreign-born population - Thailand (%)
Place of birth for the foreign-born population - Vietnam (%)
Place of birth for the foreign-born population - Other South Eastern Asia (%)
Place of birth for the foreign-born population - Armenia (%)
Place of birth for the foreign-born population - Iraq (%)
Place of birth for the foreign-born population - Israel (%)
Place of birth for the foreign-born population - Jordan (%)
Place of birth for the foreign-born population - Kuwait (%)
Place of birth for the foreign-born population - Lebanon (%)
Place of birth for the foreign-born population - Saudi Arabia (%)
Place of birth for the foreign-born population - Syria (%)
Place of birth for the foreign-born population - Turkey (%)
Place of birth for the foreign-born population - Yemen (%)
Place of birth for the foreign-born population - Other Western Asia (%)
Place of birth for the foreign-born population - Eritrea (%)
Place of birth for the foreign-born population - Ethiopia (%)
Place of birth for the foreign-born population - Kenya (%)
Place of birth for the foreign-born population - Somalia (%)
Place of birth for the foreign-born population - Uganda (%)
Place of birth for the foreign-born population - Zimbabwe (%)
Place of birth for the foreign-born population - Other Eastern Africa (%)
Place of birth for the foreign-born population - Cameroon (%)
Place of birth for the foreign-born population - Congo (%)
Place of birth for the foreign-born population - Democratic Republic of Congo (Zaire) (%)
Place of birth for the foreign-born population - Other Middle Africa (%)
Place of birth for the foreign-born population - Egypt (%)
Place of birth for the foreign-born population - Morocco (%)
Place of birth for the foreign-born population - Sudan (%)
Place of birth for the foreign-born population - Other Northern Africa (%)
Place of birth for the foreign-born population - South Africa (%)
Place of birth for the foreign-born population - Other Southern Africa (%)
Place of birth for the foreign-born population - Cabo Verde (%)
Place of birth for the foreign-born population - Ghana (%)
Place of birth for the foreign-born population - Liberia (%)
Place of birth for the foreign-born population - Nigeria (%)
Place of birth for the foreign-born population - Senegal (%)
Place of birth for the foreign-born population - Sierra Leone (%)
Place of birth for the foreign-born population - Other Western Africa (%)
Place of birth for the foreign-born population - Australia (%)
Place of birth for the foreign-born population - New Zealand (%)
Place of birth for the foreign-born population - Fiji (%)
Place of birth for the foreign-born population - Micronesia (%)
Place of birth for the foreign-born population - Bahamas (%)
Place of birth for the foreign-born population - Barbados (%)
Place of birth for the foreign-born population - Cuba (%)
Place of birth for the foreign-born population - Dominica (%)
Place of birth for the foreign-born population - Dominican Republic (%)
Place of birth for the foreign-born population - Grenada (%)
Place of birth for the foreign-born population - Haiti (%)
Place of birth for the foreign-born population - Jamaica (%)
Place of birth for the foreign-born population - St. Vincent and the Grenadines (%)
Place of birth for the foreign-born population - Trinidad and Tobago (%)
Place of birth for the foreign-born population - West Indies (%)
Place of birth for the foreign-born population - Other Caribbean (%)
Place of birth for the foreign-born population - Belize (%)
Place of birth for the foreign-born population - Costa Rica (%)
Place of birth for the foreign-born population - El Salvador (%)
Place of birth for the foreign-born population - Guatemala (%)
Place of birth for the foreign-born population - Honduras (%)
Place of birth for the foreign-born population - Mexico (%)
Place of birth for the foreign-born population - Nicaragua (%)
Place of birth for the foreign-born population - Panama (%)
Place of birth for the foreign-born population - Other Central America (%)
Place of birth for the foreign-born population - Argentina (%)
Place of birth for the foreign-born population - Bolivia (%)
Place of birth for the foreign-born population - Brazil (%)
Place of birth for the foreign-born population - Chile (%)
Place of birth for the foreign-born population - Colombia (%)
Place of birth for the foreign-born population - Ecuador (%)
Place of birth for the foreign-born population - Guyana (%)
Place of birth for the foreign-born population - Peru (%)
Place of birth for the foreign-born population - Uruguay (%)
Place of birth for the foreign-born population - Venezuela (%)
Place of birth for the foreign-born population - Other South America (%)
Place of birth for the foreign-born population - Canada (%)
Place of birth for the foreign-born population - Other Northern America (%)
Place of birth for the foreign-born population - Other (%)
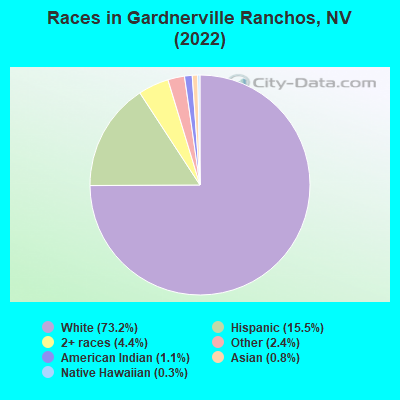
According to 2022 data, the most numerous races in Gardnerville Ranchos, NV are White alone (9,030 residents), Hispanic (1,918 residents), and Black alone (0 residents). 89.4% of Gardnerville Ranchos residents speak English at home. 3.5% of Gardnerville Ranchos, NV residents are foreign-born (1.6% born in Europe, 1.3% born in Latin America), which is 409.4% less than the foreign-born rate of 18.0% across the entire state of Nevada.
Race distribution in Gardnerville Ranchos
2000 2022
1,303,001 65.2% White alone 393,970 19.7% Hispanic 131,509 6.6% Black alone 88,593 4.4% Asian alone 49,231 2.5% Two or more races 21,397 1.1% American Indian alone 7,769 0.4% Native Hawaiian and Other 2,787 0.1% Other race alone
1,410,145 44.4% White alone 961,357 30.3% Hispanic 286,471 9.0% Black alone 281,149 8.8% Asian alone 182,151 5.7% Two or more races 20,102 0.6% Native Hawaiian and Other 18,781 0.6% Other race alone 17,616 0.6% American Indian alone
Income and house value in Gardnerville Ranchos Median household income in 2022 $82,810 White non-Hispanic householders$125,819 Two or more races householders$64,580 Hispanic or Latino race householdersMedian 2022 house value $515,319 White Non-Hispanic householders$450,771 American Indian or Alaska Native householders $447,934 Asian householders$719,248 Native Hawaiian and other Pacific Islander householders$398,991 Some other race householders$378,421 Two or more races householders$487,655 Hispanic or Latino householders
Median age by race in Gardnerville Ranchos
51.2 Median age for White residents51.4 51.0 -676,557,862.8 Median age for Black or African American residents-676,798,378.2 -676,356,588.5 58.8 Median age for American Indian / Alaska Native residents58.8 58.7 17.6 Median age for Asian residents-656,814,449.3 17.2 65.9 Median age for Native Hawaiian / Pacific Islander residents-648,090,814.6 69.2 33.1 Median age for Other race residents23.4 33.8 32.8 Median age for Two or more races residents43.0 22.7 52.0 Median age for White alone residents50.9 53.2 31.5 Median age for Hispanic or Latino residents43.6 22.9
Owner/renter occupied households by race in Gardnerville Ranchos
House owners and renters - White residents 2,986 77.6% Owner occupied862 22.4% Renter occupiedHouse owners and renters - American Indian / Alaska Native residents 50 40.3% Owner occupied74 59.7% Renter occupiedHouse owners and renters - Native Hawaiian / Pacific Islander residents 16 100.0% Owner occupiedHouse owners and renters - Other race residents 157 86.1% Owner occupied25 13.9% Renter occupiedHouse owners and renters - Two or more races residents 202 60.2% Owner occupied134 39.8% Renter occupiedHouse owners and renters - White alone residents 3,079 79.2% Owner occupied809 20.8% Renter occupiedHouse owners and renters - Hispanic or Latino residents 200 45.3% Owner occupied241 54.7% Renter occupied
Language usage in Gardnerville Ranchos
English speakers - Total 89.4% of residents of Gardnerville Ranchos speak English at home.
8.7% of residents speak Spanish at home 687 65.1% Speak English very well369 34.9% Speak English less than very well1.8% of residents speak other language at home 206 94.1% Speak English very well13 5.9% Speak English less than very well
English speakers - Born in the United States 93.2% of residents of Gardnerville Ranchos speak English at home.
6.4% of residents speak Spanish at home 411 75.8% Speak English very well131 24.2% Speak English less than very well0.6% of residents speak other language at home 48 100.0% Speak English very well
English speakers - Native, born elsewhere 80.6% of residents of Gardnerville Ranchos speak English at home.
13.4% of residents speak Spanish at home 9 100.0% Speak English very well
English speakers - Foreign-born 44.5% of residents of Gardnerville Ranchos speak English at home.
34.4% of residents speak Spanish at home 16 10.7% Speak English very well134 89.3% Speak English less than very well19.3% of residents speak other language at home 72 85.7% Speak English very well12 14.3% Speak English less than very well
White (Caucasian) - Speak only English Native:
99.5% (8,885)Foreign-born:
62.6% (146)
White (Caucasian) - Speak another language Native:
2.3% (206)Foreign-born:
48.0% (112)
Other race - Speak only English Native:
48.1% (284)Foreign-born:
43.4% (15)
Other race - Speak another language Native:
51.4% (304)Foreign-born:
56.3% (20)
Two or more races - Speak only English Native:
57.8% (824)Foreign-born:
90.4% (15)
White alone - Speak only English Native:
98.1% (8,504)Foreign-born:
66.1% (161)
White alone - Speak another language Native:
1.9% (164)Foreign-born:
33.2% (81)
Hispanic or Latino - Speak only English Native:
50.8% (869)Foreign-born:
8.8% (15)
Hispanic or Latino - Speak another language Native:
49.3% (843)Foreign-born:
91.1% (153)
Foreign-born residents in Gardnerville Ranchos 436 residents are foreign born (1.6% Europe , 1.3% Latin America ).
This city:
3.5%Nevada:
19.1%
Marital status for residents in Gardnerville Ranchos Marital status - White (Caucasian) population 15 years and over
Males 27.6% Never married57.2% Now married0.4% Separated2.5% Widowed12.3% DivorcedFemales 25.1% Never married51.6% Now married1.7% Separated7.8% Widowed13.9% DivorcedWomen who gave birth in the past 12 months Now married:
100.0% (90)Unmarried:
0.0% (0)
Women who did not give birth in the past 12 months Now married:
38.4% (716)Unmarried:
61.6% (1,150)
Marital status - American Indian / Alaska Native population 15 years and over
Males 37.5% Never married62.5% Now married0.0% Separated0.0% Widowed0.0% DivorcedFemales 24.2% Never married25.8% Now married0.0% Separated50.0% Widowed0.0% DivorcedWomen who did not give birth in the past 12 months Now married:
0.0% (0)Unmarried:
100.0% (37)
Marital status - Asian population 15 years and over
Males 0.0% Never married100.0% Now married0.0% Separated0.0% Widowed0.0% DivorcedFemales 42.9% Never married26.2% Now married0.0% Separated31.0% Widowed0.0% DivorcedWomen who did not give birth in the past 12 months Now married:
0.0% (0)Unmarried:
100.0% (20)
Marital status - Other race population 15 years and over
Males 14.0% Never married86.0% Now married0.0% Separated0.0% Widowed0.0% DivorcedFemales 0.0% Never married100.0% Now married0.0% Separated0.0% Widowed0.0% DivorcedWomen who did not give birth in the past 12 months Now married:
100.0% (139)Unmarried:
0.0% (0)
Marital status - Two or more races population 15 years and over
Males 23.9% Never married63.4% Now married0.0% Separated1.7% Widowed11.0% DivorcedFemales 50.1% Never married47.2% Now married0.0% Separated0.3% Widowed2.4% DivorcedWomen who did not give birth in the past 12 months Now married:
30.6% (104)Unmarried:
69.4% (235)
Marital status - White alone, not Hispanic / Latino population 15 years and over
Males 25.0% Never married58.8% Now married0.4% Separated2.7% Widowed13.2% DivorcedFemales 23.5% Never married52.0% Now married1.8% Separated7.3% Widowed15.3% DivorcedWomen who gave birth in the past 12 months Now married:
100.0% (39)Unmarried:
0.0% (0)
Women who did not give birth in the past 12 months Now married:
37.2% (668)Unmarried:
62.8% (1,128)
Marital status - Hispanic or Latino population 15 years and over
Males 40.0% Never married56.6% Now married0.0% Separated0.0% Widowed3.3% DivorcedFemales 44.8% Never married48.3% Now married0.0% Separated6.9% Widowed0.0% DivorcedWomen who gave birth in the past 12 months Now married:
100.0% (66)Unmarried:
0.0% (0)
Women who did not give birth in the past 12 months Now married:
42.2% (240)Unmarried:
57.8% (328)
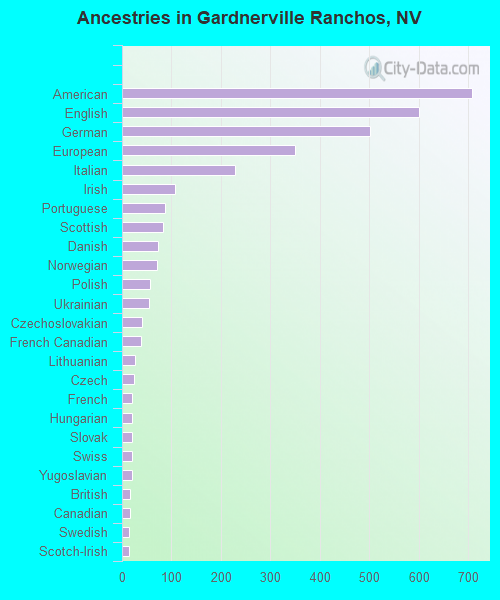
Ancestries in Gardnerville Ranchos
707 13.5% American600 11.5% English502 9.6% German349 6.7% European228 4.4% Italian108 2.1% Irish87 1.7% Portuguese82 1.6% Scottish73 1.4% Danish71 1.4% Norwegian56 1.1% Polish55 1.1% Ukrainian41 0.8% Czechoslovakian38 0.7% French Canadian26 0.5% Lithuanian24 0.5% Czech20 0.4% French20 0.4% Hungarian20 0.4% Slovak20 0.4% Swiss20 0.4% Yugoslavian17 0.3% British17 0.3% Canadian15 0.3% Swedish14 0.3% Scotch-Irish12 0.2% Dutch11 0.2% Welsh8 0.2% Greek5 0.10% Scandinavian
Children Nativity (place of birth) in Gardnerville Ranchos
Children under 6 years - Living with two parents Both parents native 190 100.0% NativeBoth parents foreign-born 21 100.0% NativeChildren under 6 years - Living with one parent Native parent 86 100.0% Native
Children 6 to 17 years - Living with two parents Both parents native 1,150 100.0% NativeBoth parents foreign-born 40 100.0% NativeOne native, one foreign-born parent 22 100.0% NativeChildren 6 to 17 years - Living with one parent Native parent 682 100.0% Native
Grandparents responsible for own grandchildren in Gardnerville Ranchos
Grandparents (30 to 59 years) White / Caucasian 22 47.3% Responsible for grandchildren25 52.7% Not responsible for grandchildrenWhite alone, not Hispanic / Latino 30 52.5% Responsible for grandchildren28 47.5% Not responsible for grandchildrenGrandparents (60 years and over) White / Caucasian 83 64.3% Responsible for grandchildren46 35.7% Not responsible for grandchildrenWhite alone, not Hispanic / Latino 95 64.6% Responsible for grandchildren52 35.4% Not responsible for grandchildren