Races in Gary, Indiana (IN) Detailed Stats
Data:
Races - White alone (%)
Races - White alone (% change since 2000)
Races - Black alone (%)
Races - Black alone (% change since 2000)
Races - American Indian alone (%)
Races - American Indian alone (% change since 2000)
Races - Asian alone (%)
Races - Asian alone (% change since 2000)
Races - Hispanic (%)
Races - Hispanic (% change since 2000)
Races - Native Hawaiian and Other Pacific Islander alone (%)
Races - Native Hawaiian and Other Pacific Islander alone (% change since 2000)
Races - Two or more races(%)
Races - Two or more races(% change since 2000)
Races - Other race alone (%)
Races - Other race alone (% change since 2000)
Racial diversity
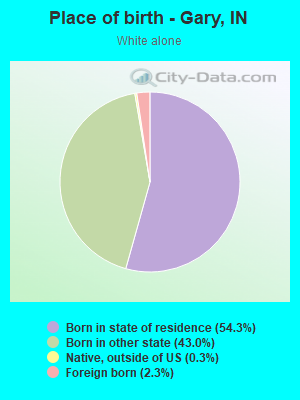
Place of birth - Born in state of residence (%)
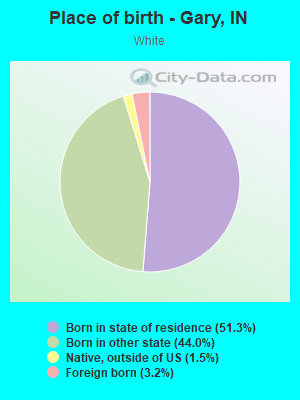
Place of birth - Born in state of residence (%) - White
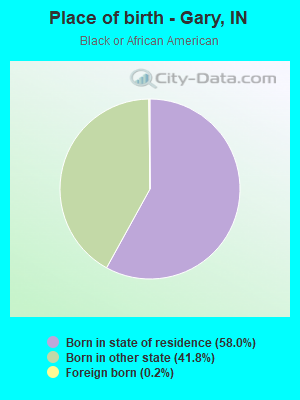
Place of birth - Born in state of residence (%) - Black or African American
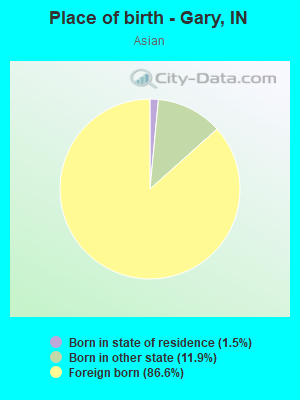
Place of birth - Born in state of residence (%) - Asian
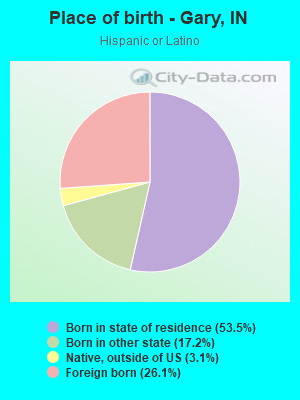
Place of birth - Born in state of residence (%) - Hispanic or Latino
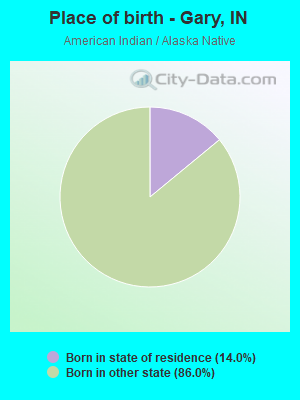
Place of birth - Born in state of residence (%) - American Indian and Alaska Native
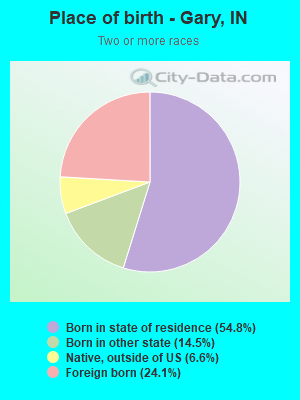
Place of birth - Born in state of residence (%) - Multirace
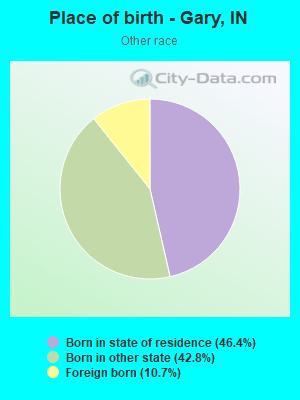
Place of birth - Born in state of residence (%) - Other Race
Place of birth - Born in other state (%)
Place of birth - Born in other state (%) - White
Place of birth - Born in other state (%) - Black or African American
Place of birth - Born in other state (%) - Asian
Place of birth - Born in other state (%) - Hispanic or Latino
Place of birth - Born in other state (%) - American Indian and Alaska Native
Place of birth - Born in other state (%) - Multirace
Place of birth - Born in other state (%) - Other Race
Place of birth - Native, outside of US (%)
Place of birth - Native, outside of US (%) - White
Place of birth - Native, outside of US (%) - Black or African American
Place of birth - Native, outside of US (%) - Asian
Place of birth - Native, outside of US (%) - Hispanic or Latino
Place of birth - Native, outside of US (%) - American Indian and Alaska Native
Place of birth - Native, outside of US (%) - Multirace
Place of birth - Native, outside of US (%) - Other Race
Place of birth - Foreign born (%)
Place of birth - Foreign born (%) - White
Place of birth - Foreign born (%) - Black or African American
Place of birth - Foreign born (%) - Asian
Place of birth - Foreign born (%) - Hispanic or Latino
Place of birth - Foreign born (%) - American Indian and Alaska Native
Place of birth - Foreign born (%) - Multirace
Place of birth - Foreign born (%) - Other Race
Residents speaking English at home (%)
Residents speaking English at home - Born in the United States (%)
Residents speaking English at home - Native, born elsewhere (%)
Residents speaking English at home - Foreign born (%)
Residents speaking Spanish at home (%)
Residents speaking Spanish at home - Born in the United States (%)
Residents speaking Spanish at home - Native, born elsewhere (%)
Residents speaking Spanish at home - Foreign born (%)
Residents speaking other language at home (%)
Residents speaking other language at home - Born in the United States (%)
Residents speaking other language at home - Native, born elsewhere (%)
Residents speaking other language at home - Foreign born (%)
Marital status - Never married (%)
Marital status - Now married (%)
Marital status - Separated (%)
Marital status - Widowed (%)
Marital status - Divorced (%)
Ancestries Reported - Arab (%)
Ancestries Reported - Czech (%)
Ancestries Reported - Danish (%)
Ancestries Reported - Dutch (%)
Ancestries Reported - English (%)
Ancestries Reported - French (%)
Ancestries Reported - French Canadian (%)
Ancestries Reported - German (%)
Ancestries Reported - Greek (%)
Ancestries Reported - Hungarian (%)
Ancestries Reported - Irish (%)
Ancestries Reported - Italian (%)
Ancestries Reported - Lithuanian (%)
Ancestries Reported - Norwegian (%)
Ancestries Reported - Polish (%)
Ancestries Reported - Portuguese (%)
Ancestries Reported - Russian (%)
Ancestries Reported - Scotch-Irish (%)
Ancestries Reported - Scottish (%)
Ancestries Reported - Slovak (%)
Ancestries Reported - Subsaharan African (%)
Ancestries Reported - Swedish (%)
Ancestries Reported - Swiss (%)
Ancestries Reported - Ukrainian (%)
Ancestries Reported - United States (%)
Ancestries Reported - Welsh (%)
Ancestries Reported - West Indian (%)
Ancestries Reported - Other (%)
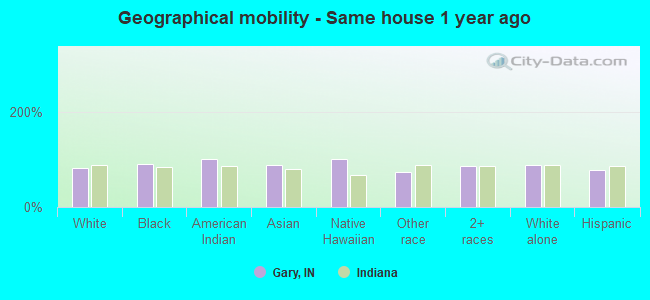
Geographical mobility - Same house 1 year ago (%)
Geographical mobility - Same house 1 year ago (%) - White
Geographical mobility - Same house 1 year ago (%) - Black or African American
Geographical mobility - Same house 1 year ago (%) - Asian
Geographical mobility - Same house 1 year ago (%) - Hispanic or Latino
Geographical mobility - Same house 1 year ago (%) - American Indian and Alaska Native
Geographical mobility - Same house 1 year ago (%) - Multirace
Geographical mobility - Same house 1 year ago (%) - Other Race
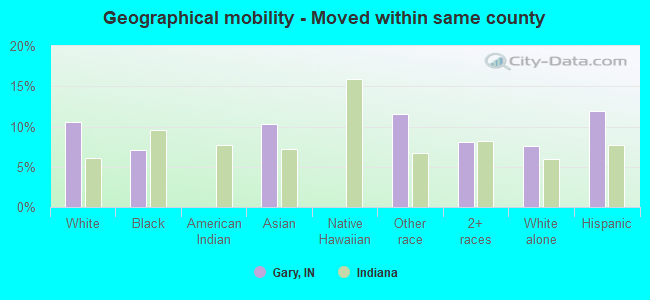
Geographical mobility - Moved within same county (%)
Geographical mobility - Moved within same county (%) - White
Geographical mobility - Moved within same county (%) - Black or African American
Geographical mobility - Moved within same county (%) - Asian
Geographical mobility - Moved within same county (%) - Hispanic or Latino
Geographical mobility - Moved within same county (%) - American Indian and Alaska Native
Geographical mobility - Moved within same county (%) - Multirace
Geographical mobility - Moved within same county (%) - Other Race
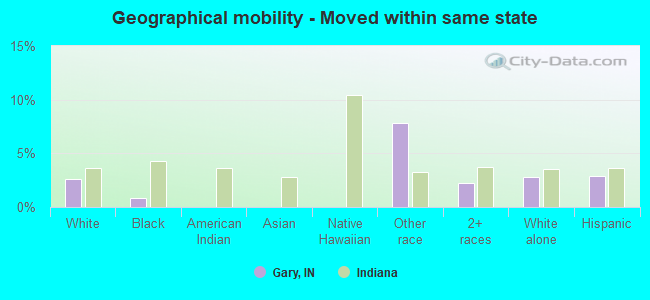
Geographical mobility - Moved from different county within same state (%)
Geographical mobility - Moved from different county within same state (%) - White
Geographical mobility - Moved from different county within same state (%) - Black or African American
Geographical mobility - Moved from different county within same state (%) - Asian
Geographical mobility - Moved from different county within same state (%) - Hispanic or Latino
Geographical mobility - Moved from different county within same state (%) - American Indian and Alaska Native
Geographical mobility - Moved from different county within same state (%) - Multirace
Geographical mobility - Moved from different county within same state (%) - Other Race
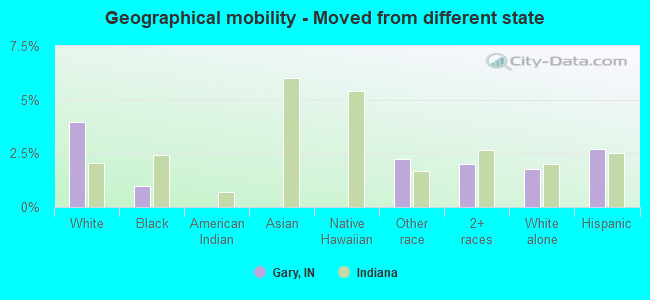
Geographical mobility - Moved from different state (%)
Geographical mobility - Moved from different state (%) - White
Geographical mobility - Moved from different state (%) - Black or African American
Geographical mobility - Moved from different state (%) - Asian
Geographical mobility - Moved from different state (%) - Hispanic or Latino
Geographical mobility - Moved from different state (%) - American Indian and Alaska Native
Geographical mobility - Moved from different state (%) - Multirace
Geographical mobility - Moved from different state (%) - Other Race
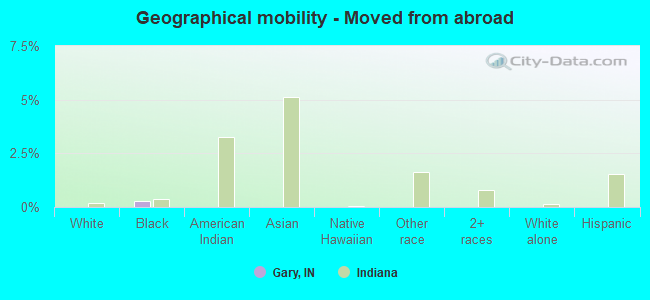
Geographical mobility - Moved from abroad (%)
Geographical mobility - Moved from abroad (%) - White
Geographical mobility - Moved from abroad (%) - Black or African American
Geographical mobility - Moved from abroad (%) - Asian
Geographical mobility - Moved from abroad (%) - Hispanic or Latino
Geographical mobility - Moved from abroad (%) - American Indian and Alaska Native
Geographical mobility - Moved from abroad (%) - Multirace
Geographical mobility - Moved from abroad (%) - Other Race
Place of birth for the foreign-born population - Ireland (%)
Place of birth for the foreign-born population - Denmark (%)
Place of birth for the foreign-born population - Norway (%)
Place of birth for the foreign-born population - Sweden (%)
Place of birth for the foreign-born population - United Kingdom (%)
Place of birth for the foreign-born population - England (%)
Place of birth for the foreign-born population - Scotland (%)
Place of birth for the foreign-born population - Other Northern Europe (%)
Place of birth for the foreign-born population - Austria (%)
Place of birth for the foreign-born population - Belgium (%)
Place of birth for the foreign-born population - France (%)
Place of birth for the foreign-born population - Germany (%)
Place of birth for the foreign-born population - Netherlands (%)
Place of birth for the foreign-born population - Switzerland (%)
Place of birth for the foreign-born population - Other Western Europe (%)
Place of birth for the foreign-born population - Greece (%)
Place of birth for the foreign-born population - Italy (%)
Place of birth for the foreign-born population - Portugal (%)
Place of birth for the foreign-born population - Spain (%)
Place of birth for the foreign-born population - Other Southern Europe (%)
Place of birth for the foreign-born population - Albania (%)
Place of birth for the foreign-born population - Belarus (%)
Place of birth for the foreign-born population - Bosnia and Herzegovina (%)
Place of birth for the foreign-born population - Bulgaria (%)
Place of birth for the foreign-born population - Croatia (%)
Place of birth for the foreign-born population - Czechoslovakia (%)
Place of birth for the foreign-born population - Hungary (%)
Place of birth for the foreign-born population - Latvia (%)
Place of birth for the foreign-born population - Lithuania (%)
Place of birth for the foreign-born population - North Macedonia (Macedonia) (%)
Place of birth for the foreign-born population - Moldova (%)
Place of birth for the foreign-born population - Poland (%)
Place of birth for the foreign-born population - Romania (%)
Place of birth for the foreign-born population - Russia (%)
Place of birth for the foreign-born population - Serbia (%)
Place of birth for the foreign-born population - Ukraine (%)
Place of birth for the foreign-born population - Other Eastern Europe (%)
Place of birth for the foreign-born population - China (%)
Place of birth for the foreign-born population - Hong Kong (%)
Place of birth for the foreign-born population - Taiwan (%)
Place of birth for the foreign-born population - Japan (%)
Place of birth for the foreign-born population - Korea (%)
Place of birth for the foreign-born population - Other Eastern Asia (%)
Place of birth for the foreign-born population - Afghanistan (%)
Place of birth for the foreign-born population - Bangladesh (%)
Place of birth for the foreign-born population - India (%)
Place of birth for the foreign-born population - Iran (%)
Place of birth for the foreign-born population - Kazakhstan (%)
Place of birth for the foreign-born population - Nepal (%)
Place of birth for the foreign-born population - Pakistan (%)
Place of birth for the foreign-born population - Sri Lanka (%)
Place of birth for the foreign-born population - Uzbekistan (%)
Place of birth for the foreign-born population - Other South Central Asia (%)
Place of birth for the foreign-born population - Burma (%)
Place of birth for the foreign-born population - Cambodia (%)
Place of birth for the foreign-born population - Indonesia (%)
Place of birth for the foreign-born population - Laos (%)
Place of birth for the foreign-born population - Malaysia (%)
Place of birth for the foreign-born population - Philippines (%)
Place of birth for the foreign-born population - Singapore (%)
Place of birth for the foreign-born population - Thailand (%)
Place of birth for the foreign-born population - Vietnam (%)
Place of birth for the foreign-born population - Other South Eastern Asia (%)
Place of birth for the foreign-born population - Armenia (%)
Place of birth for the foreign-born population - Iraq (%)
Place of birth for the foreign-born population - Israel (%)
Place of birth for the foreign-born population - Jordan (%)
Place of birth for the foreign-born population - Kuwait (%)
Place of birth for the foreign-born population - Lebanon (%)
Place of birth for the foreign-born population - Saudi Arabia (%)
Place of birth for the foreign-born population - Syria (%)
Place of birth for the foreign-born population - Turkey (%)
Place of birth for the foreign-born population - Yemen (%)
Place of birth for the foreign-born population - Other Western Asia (%)
Place of birth for the foreign-born population - Eritrea (%)
Place of birth for the foreign-born population - Ethiopia (%)
Place of birth for the foreign-born population - Kenya (%)
Place of birth for the foreign-born population - Somalia (%)
Place of birth for the foreign-born population - Uganda (%)
Place of birth for the foreign-born population - Zimbabwe (%)
Place of birth for the foreign-born population - Other Eastern Africa (%)
Place of birth for the foreign-born population - Cameroon (%)
Place of birth for the foreign-born population - Congo (%)
Place of birth for the foreign-born population - Democratic Republic of Congo (Zaire) (%)
Place of birth for the foreign-born population - Other Middle Africa (%)
Place of birth for the foreign-born population - Egypt (%)
Place of birth for the foreign-born population - Morocco (%)
Place of birth for the foreign-born population - Sudan (%)
Place of birth for the foreign-born population - Other Northern Africa (%)
Place of birth for the foreign-born population - South Africa (%)
Place of birth for the foreign-born population - Other Southern Africa (%)
Place of birth for the foreign-born population - Cabo Verde (%)
Place of birth for the foreign-born population - Ghana (%)
Place of birth for the foreign-born population - Liberia (%)
Place of birth for the foreign-born population - Nigeria (%)
Place of birth for the foreign-born population - Senegal (%)
Place of birth for the foreign-born population - Sierra Leone (%)
Place of birth for the foreign-born population - Other Western Africa (%)
Place of birth for the foreign-born population - Australia (%)
Place of birth for the foreign-born population - New Zealand (%)
Place of birth for the foreign-born population - Fiji (%)
Place of birth for the foreign-born population - Micronesia (%)
Place of birth for the foreign-born population - Bahamas (%)
Place of birth for the foreign-born population - Barbados (%)
Place of birth for the foreign-born population - Cuba (%)
Place of birth for the foreign-born population - Dominica (%)
Place of birth for the foreign-born population - Dominican Republic (%)
Place of birth for the foreign-born population - Grenada (%)
Place of birth for the foreign-born population - Haiti (%)
Place of birth for the foreign-born population - Jamaica (%)
Place of birth for the foreign-born population - St. Vincent and the Grenadines (%)
Place of birth for the foreign-born population - Trinidad and Tobago (%)
Place of birth for the foreign-born population - West Indies (%)
Place of birth for the foreign-born population - Other Caribbean (%)
Place of birth for the foreign-born population - Belize (%)
Place of birth for the foreign-born population - Costa Rica (%)
Place of birth for the foreign-born population - El Salvador (%)
Place of birth for the foreign-born population - Guatemala (%)
Place of birth for the foreign-born population - Honduras (%)
Place of birth for the foreign-born population - Mexico (%)
Place of birth for the foreign-born population - Nicaragua (%)
Place of birth for the foreign-born population - Panama (%)
Place of birth for the foreign-born population - Other Central America (%)
Place of birth for the foreign-born population - Argentina (%)
Place of birth for the foreign-born population - Bolivia (%)
Place of birth for the foreign-born population - Brazil (%)
Place of birth for the foreign-born population - Chile (%)
Place of birth for the foreign-born population - Colombia (%)
Place of birth for the foreign-born population - Ecuador (%)
Place of birth for the foreign-born population - Guyana (%)
Place of birth for the foreign-born population - Peru (%)
Place of birth for the foreign-born population - Uruguay (%)
Place of birth for the foreign-born population - Venezuela (%)
Place of birth for the foreign-born population - Other South America (%)
Place of birth for the foreign-born population - Canada (%)
Place of birth for the foreign-born population - Other Northern America (%)
Place of birth for the foreign-born population - Other (%)
Latest news about races in Gary, IN collected exclusively by city-data.com from local newspapers, TV, and radio stations
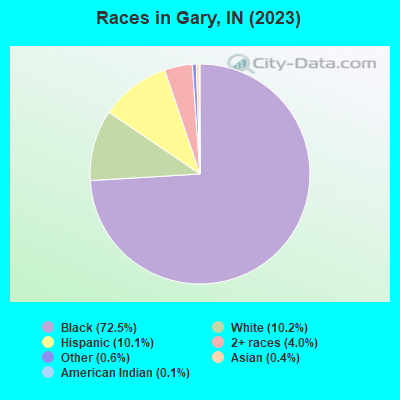
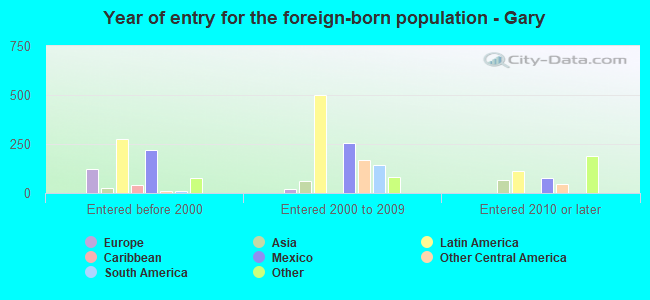
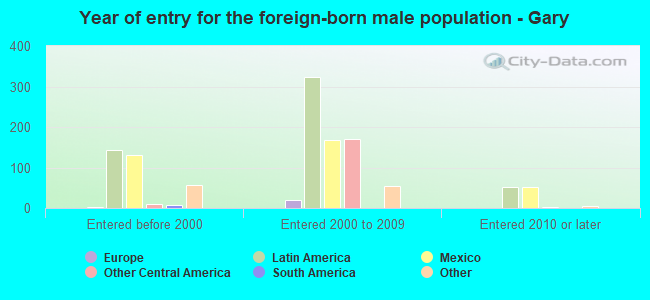
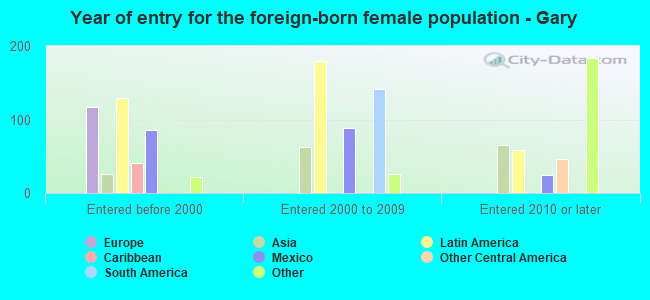
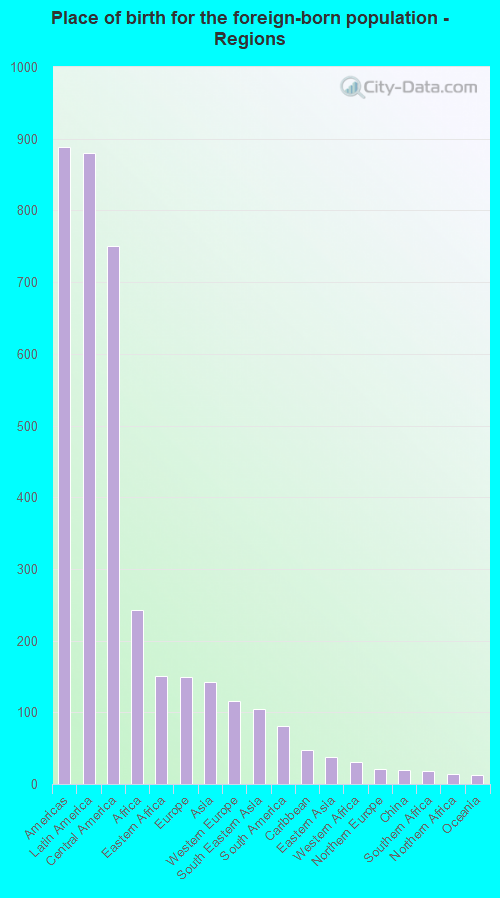
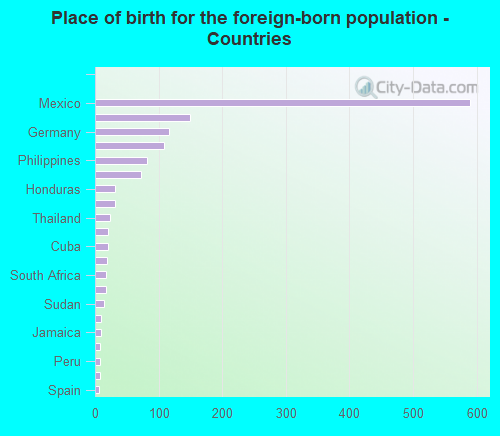
According to 2022 data, the most numerous races in Gary, IN are White alone (5,858 residents), Black alone (52,246 residents), and Hispanic (6,815 residents). 93.6% of Gary residents speak English at home. 2.1% of Gary, IN residents are foreign-born (1.2% born in Latin America, 0.3% born in Africa), which is 190.0% less than the foreign-born rate of 6.0% across the entire state of Indiana.
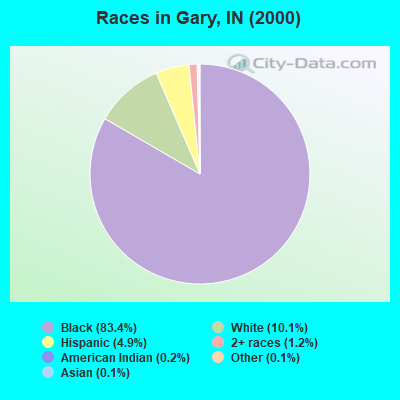
Race distribution in Gary
2000 2022
5,219,373 85.8% White alone 505,462 8.3% Black alone 214,536 3.5% Hispanic 61,115 1.0% Two or more races 58,424 1.0% Asian alone 13,654 0.2% American Indian alone 6,348 0.1% Other race alone 1,573 0.03% Native Hawaiian and Other
5,192,455 76.0% White alone 628,054 9.2% Black alone 534,528 7.8% Hispanic 263,242 3.9% Two or more races 172,880 2.5% Asian alone 33,467 0.5% Other race alone 5,866 0.09% American Indian alone 2,545 0.04% Native Hawaiian and Other
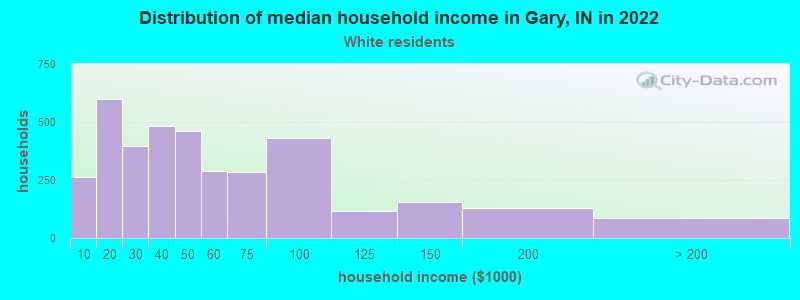
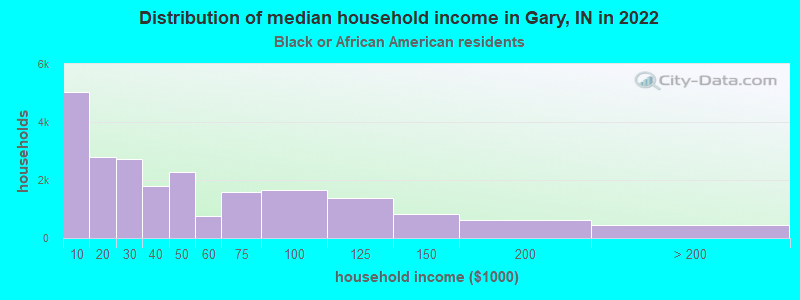
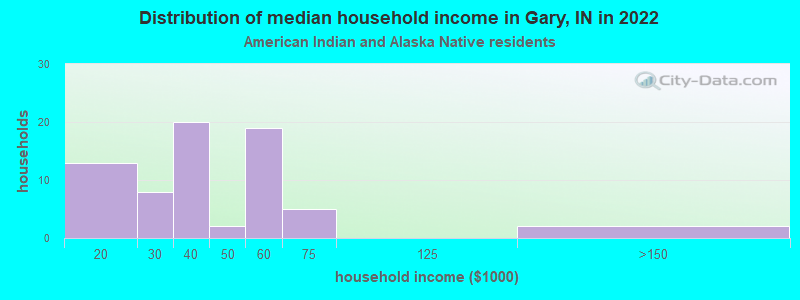
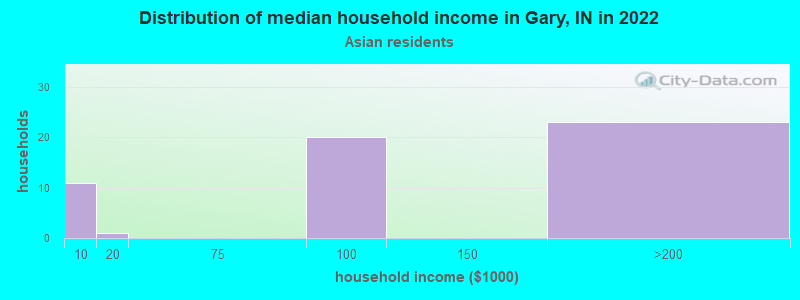
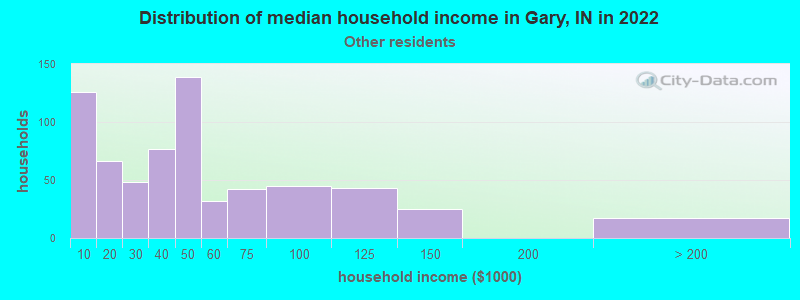
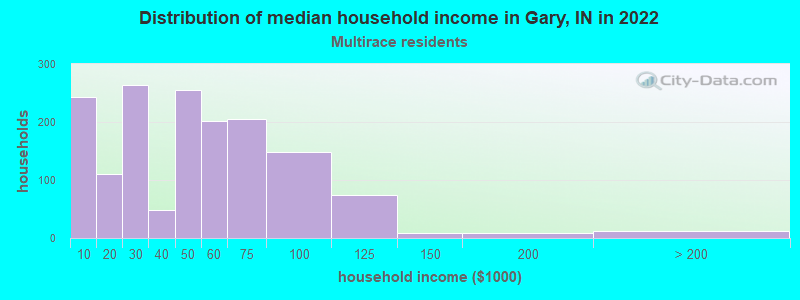
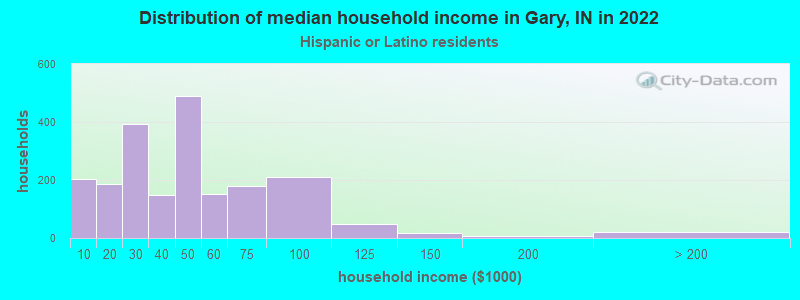
Income and house value in Gary Median household income in 2022 $50,017 White non-Hispanic householders$32,958 Black householders$57,100 Some other race householders$50,278 Two or more races householders$58,179 Hispanic or Latino race householdersMedian 2022 house value $104,755 White Non-Hispanic householders$95,528 Black or African American householders$145,825 American Indian or Alaska Native householders $184,181 Asian householders$81,416 Some other race householders$106,202 Two or more races householders$85,034 Hispanic or Latino householders
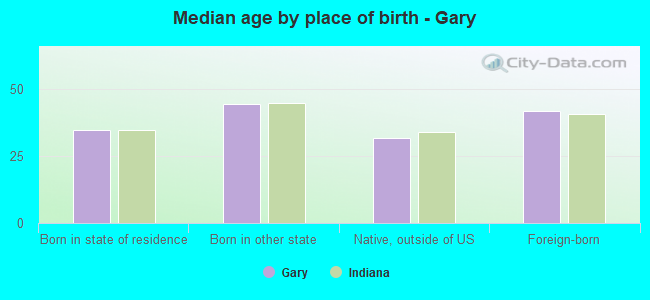
Median age by race in Gary
45.9 Median age for White residents50.5 39.5 36.6 Median age for Black or African American residents31.9 39.2 65.2 Median age for American Indian / Alaska Native residents-666,666,666.0 -666,666,666.0 52.8 Median age for Asian residents-666,666,666.0 52.8 -666,666,666.0 Median age for Native Hawaiian / Pacific Islander residents-666,666,666.0 -666,666,666.0 41.7 Median age for Other race residents50.4 41.2 32.5 Median age for Two or more races residents21.0 39.1 53.8 Median age for White alone residents50.6 57.5 22.9 Median age for Hispanic or Latino residents20.9 31.2
Owner/renter occupied households by race in Gary
House owners and renters - White residents 2,308 66.9% Owner occupied1,142 33.1% Renter occupiedHouse owners and renters - Black or African American residents 8,408 38.3% Owner occupied13,520 61.7% Renter occupiedHouse owners and renters - American Indian / Alaska Native residents 41 81.8% Owner occupied9 18.2% Renter occupiedHouse owners and renters - Asian residents 37 61.2% Owner occupied23 38.8% Renter occupiedHouse owners and renters - Other race residents 300 42.3% Owner occupied410 57.7% Renter occupiedHouse owners and renters - Two or more races residents 1,288 63.4% Owner occupied744 36.6% Renter occupiedHouse owners and renters - White alone residents 2,146 68.4% Owner occupied993 31.6% Renter occupiedHouse owners and renters - Hispanic or Latino residents 1,009 58.3% Owner occupied723 41.7% Renter occupied
Language usage in Gary
English speakers - Total 93.6% of residents of Gary speak English at home.
4.0% of residents speak Spanish at home 2,045 78.3% Speak English very well568 21.7% Speak English less than very well1.0% of residents speak other language at home 564 83.6% Speak English very well111 16.4% Speak English less than very well
English speakers - Born in the United States 95.0% of residents of Gary speak English at home.
3.4% of residents speak Spanish at home 851 95.3% Speak English very well42 4.7% Speak English less than very well0.7% of residents speak other language at home 185 100.0% Speak English very well
English speakers - Native, born elsewhere 15.5% of residents of Gary speak English at home.
92.4% of residents speak Spanish at home 239 98.0% Speak English very well5 2.0% Speak English less than very well5.3% of residents speak other language at home 14 100.0% Speak English very well
English speakers - Foreign-born 21.8% of residents of Gary speak English at home.
54.5% of residents speak Spanish at home 262 36.0% Speak English very well465 64.0% Speak English less than very well21.6% of residents speak other language at home 215 74.7% Speak English very well73 25.3% Speak English less than very well
White (Caucasian) - Speak only English Native:
92.6% (7,223)Foreign-born:
34.6% (93)
White (Caucasian) - Speak another language Native:
7.3% (573)Foreign-born:
61.3% (165)
Black or African American - Speak only English Native:
99.0% (49,245)Foreign-born:
37.4% (83)
Black or African American - Speak another language Native:
0.8% (404)Foreign-born:
51.3% (113)
Asian - Speak only English Native:
94.5% (22)Foreign-born:
48.7% (78)
Asian - Speak another language Native:
6.2% (1)Foreign-born:
58.2% (94)
Other race - Speak another language Native:
26.7% (400)Foreign-born:
97.6% (198)
Two or more races - Speak only English Native:
71.6% (3,593)Foreign-born:
7.6% (56)
Two or more races - Speak another language Native:
24.1% (1,208)Foreign-born:
92.4% (676)
White alone - Speak only English Native:
96.3% (5,940)Foreign-born:
47.7% (73)
White alone - Speak another language Native:
3.6% (222)Foreign-born:
30.0% (46)
Hispanic or Latino - Speak only English Native:
68.6% (3,716)Foreign-born:
8.0% (65)
Hispanic or Latino - Speak another language Native:
30.4% (1,648)Foreign-born:
92.0% (744)
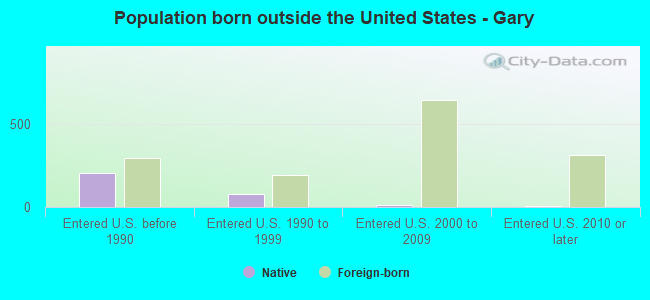
Foreign-born residents in Gary 1,436 residents are foreign born (1.2% Latin America , 0.3% Africa ).
This city:
2.1%Indiana:
5.6%
Marital status for residents in Gary Marital status - White (Caucasian) population 15 years and over
Males 44.0% Never married40.9% Now married0.0% Separated3.0% Widowed12.1% DivorcedFemales 37.7% Never married41.8% Now married0.0% Separated2.6% Widowed17.9% DivorcedWomen who gave birth in the past 12 months Now married:
32.2% (51)Unmarried:
67.8% (109)
Women who did not give birth in the past 12 months Now married:
25.3% (413)Unmarried:
74.7% (1,220)
Marital status - Black or African American population 15 years and over
Males 49.8% Never married27.6% Now married3.1% Separated6.5% Widowed13.0% DivorcedFemales 51.2% Never married20.0% Now married3.9% Separated10.9% Widowed13.9% DivorcedWomen who gave birth in the past 12 months Now married:
25.5% (320)Unmarried:
74.5% (936)
Women who did not give birth in the past 12 months Now married:
13.1% (1,446)Unmarried:
86.9% (9,575)
Marital status - American Indian / Alaska Native population 15 years and over
Males 0.0% Never married23.5% Now married11.8% Separated0.0% Widowed64.7% DivorcedFemales 0.0% Never married28.6% Now married0.0% Separated0.0% Widowed71.4% DivorcedMarital status - Asian population 15 years and over
Males 0.0% Never married0.0% Now married100.0% Separated0.0% Widowed0.0% DivorcedFemales 0.0% Never married81.1% Now married0.0% Separated7.6% Widowed11.4% DivorcedWomen who did not give birth in the past 12 months Now married:
82.8% (75)Unmarried:
17.2% (16)
Marital status - Other race population 15 years and over
Males 55.2% Never married27.6% Now married5.1% Separated1.6% Widowed10.5% DivorcedFemales 43.9% Never married26.7% Now married4.6% Separated14.7% Widowed10.2% DivorcedWomen who did not give birth in the past 12 months Now married:
23.0% (118)Unmarried:
77.0% (394)
Marital status - Two or more races population 15 years and over
Males 51.7% Never married28.0% Now married0.0% Separated2.2% Widowed18.2% DivorcedFemales 36.7% Never married35.8% Now married0.0% Separated8.9% Widowed18.6% DivorcedWomen who gave birth in the past 12 months Now married:
21.1% (6)Unmarried:
78.9% (23)
Women who did not give birth in the past 12 months Now married:
25.1% (329)Unmarried:
74.9% (985)
Marital status - White alone, not Hispanic / Latino population 15 years and over
Males 40.1% Never married43.8% Now married0.0% Separated3.2% Widowed13.0% DivorcedFemales 26.6% Never married53.4% Now married0.0% Separated3.3% Widowed16.7% DivorcedWomen who gave birth in the past 12 months Now married:
26.1% (28)Unmarried:
73.9% (80)
Women who did not give birth in the past 12 months Now married:
32.4% (377)Unmarried:
67.6% (786)
Marital status - Hispanic or Latino population 15 years and over
Males 54.0% Never married32.2% Now married3.8% Separated0.4% Widowed9.6% DivorcedFemales 45.8% Never married27.1% Now married3.7% Separated5.4% Widowed18.1% DivorcedWomen who gave birth in the past 12 months Now married:
43.3% (27)Unmarried:
56.7% (36)
Women who did not give birth in the past 12 months Now married:
21.5% (356)Unmarried:
78.5% (1,303)
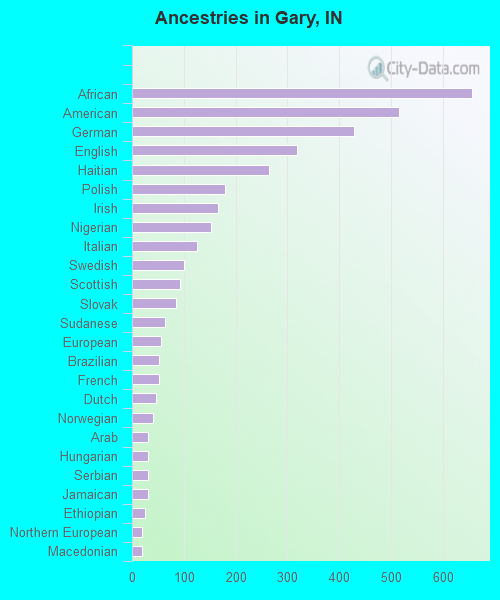
Ancestries in Gary
656 1.4% African516 1.1% American429 0.9% German318 0.7% English264 0.6% Haitian179 0.4% Polish166 0.4% Irish152 0.3% Nigerian125 0.3% Italian101 0.2% Swedish93 0.2% Scottish84 0.2% Slovak64 0.1% Sudanese55 0.1% European52 0.1% Brazilian52 0.1% French46 0.1% Dutch40 0.09% Norwegian30 0.07% Arab30 0.07% Hungarian30 0.07% Serbian30 0.07% Jamaican25 0.05% Ethiopian20 0.04% Northern European20 0.04% Macedonian18 0.04% Greek15 0.03% Scotch-Irish13 0.03% British12 0.03% Syrian10 0.02% French Canadian8 0.02% Belgian8 0.02% Lithuanian7 0.02% Australian5 0.01% Finnish5 0.01% Trinidadian and Tobagonian4 0.01% Estonian3 0.01% Romanian
Geographical mobility in Gary Same house 1 year ago 6,825 81.3% White (Caucasian)46,901 90.8% Black or African American154 100.0% American Indian / Alaska Native165 88.0% Asian4 100.0% Native Hawaiian / Pacific Islander1,272 72.6% Other race5,513 85.8% Two or more races5,715 87.4% White alone, not Hispanic / Latino5,192 77.9% Hispanic or LatinoMoved within same county 892 10.6% White / Caucasian3,641 7.0% Black or African American19 10.3% Asian202 11.5% Other race518 8.1% Two or more races494 7.6% White alone, not Hispanic / Latino796 11.9% Hispanic or LatinoMoved within same state 216 2.6% White / Caucasian456 0.9% Black or African American137 7.8% Other race143 2.2% Two or more races185 2.8% White alone, not Hispanic / Latino192 2.9% Hispanic or LatinoMoved from different state 332 3.9% White / Caucasian507 1.0% Black or African American40 2.3% Other race128 2.0% Two or more races116 1.8% White alone, not Hispanic / Latino179 2.7% Hispanic or LatinoMoved from abroad 146 0.3% Black or African American
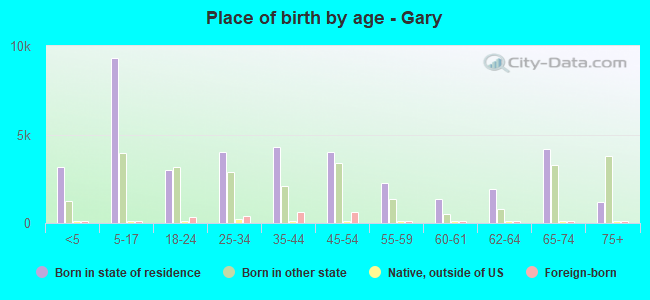
Children Nativity (place of birth) in Gary
Children under 6 years - Living with two parents Both parents native 670 100.0% NativeBoth parents foreign-born 119 100.0% NativeOne native, one foreign-born parent 71 100.0% NativeChildren under 6 years - Living with one parent Native parent 4,408 100.0% NativeForeign-born parent 23 100.0% NativeChildren 6 to 17 years - Living with two parents Both parents native 2,003 100.0% NativeBoth parents foreign-born 125 100.0% NativeOne native, one foreign-born parent 129 100.0% NativeChildren 6 to 17 years - Living with one parent Native parent 9,181 100.0% NativeForeign-born parent 209 49.4% Native214 50.6% Foreign-born
Grandparents responsible for own grandchildren in Gary
Grandparents (30 to 59 years) White / Caucasian 63 42.5% Responsible for grandchildren85 57.5% Not responsible for grandchildrenBlack or African American 263 33.6% Responsible for grandchildren520 66.4% Not responsible for grandchildrenOther race 2 9.3% Responsible for grandchildren23 90.7% Not responsible for grandchildrenTwo or more races 16 100.0% Responsible for grandchildrenWhite alone, not Hispanic / Latino 65 41.9% Responsible for grandchildren90 58.1% Not responsible for grandchildrenHispanic or Latino 3 12.5% Responsible for grandchildren18 87.5% Not responsible for grandchildrenGrandparents (60 years and over) White / Caucasian 26 16.9% Responsible for grandchildren129 83.1% Not responsible for grandchildrenBlack or African American 116 35.2% Responsible for grandchildren213 64.8% Not responsible for grandchildrenTwo or more races 4 100.0% Not responsible for grandchildrenWhite alone, not Hispanic / Latino 28 18.2% Responsible for grandchildren126 81.8% Not responsible for grandchildren