Races in Gastonia, North Carolina (NC) Detailed Stats
Data:
Races - White alone (%)
Races - White alone (% change since 2000)
Races - Black alone (%)
Races - Black alone (% change since 2000)
Races - American Indian alone (%)
Races - American Indian alone (% change since 2000)
Races - Asian alone (%)
Races - Asian alone (% change since 2000)
Races - Hispanic (%)
Races - Hispanic (% change since 2000)
Races - Native Hawaiian and Other Pacific Islander alone (%)
Races - Native Hawaiian and Other Pacific Islander alone (% change since 2000)
Races - Two or more races(%)
Races - Two or more races(% change since 2000)
Races - Other race alone (%)
Races - Other race alone (% change since 2000)
Racial diversity
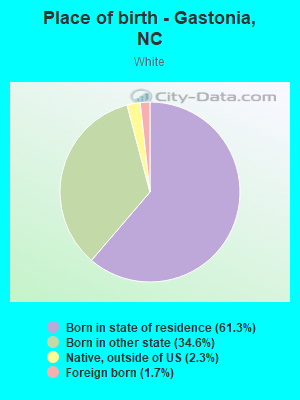
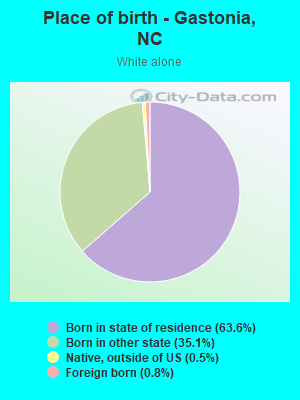
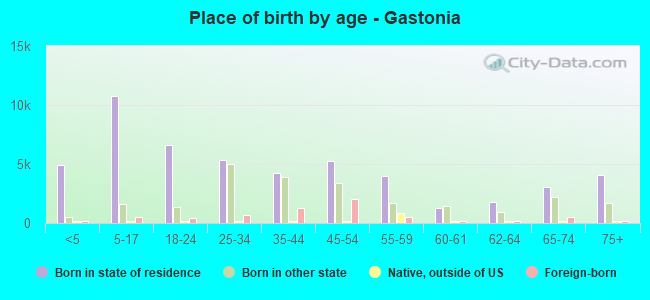
Place of birth - Born in state of residence (%)
Place of birth - Born in state of residence (%) - White
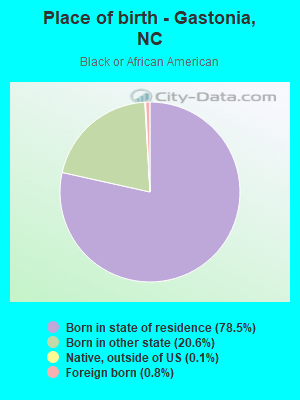
Place of birth - Born in state of residence (%) - Black or African American
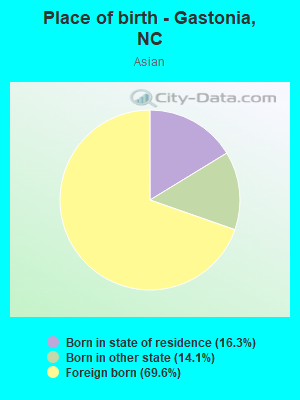
Place of birth - Born in state of residence (%) - Asian
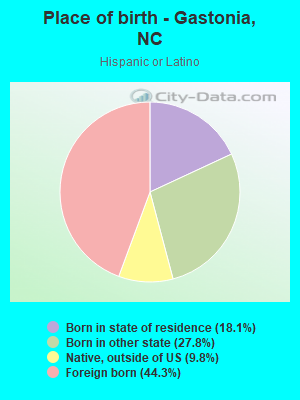
Place of birth - Born in state of residence (%) - Hispanic or Latino
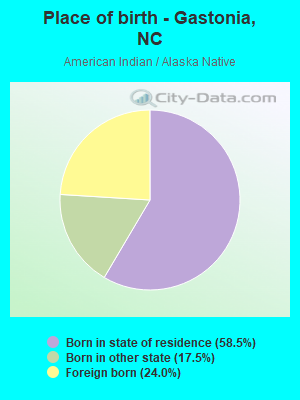
Place of birth - Born in state of residence (%) - American Indian and Alaska Native
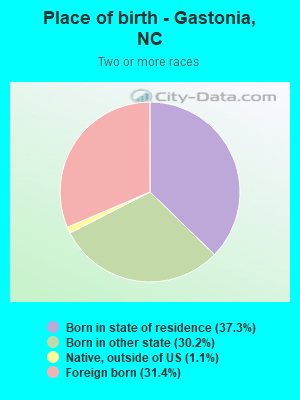
Place of birth - Born in state of residence (%) - Multirace
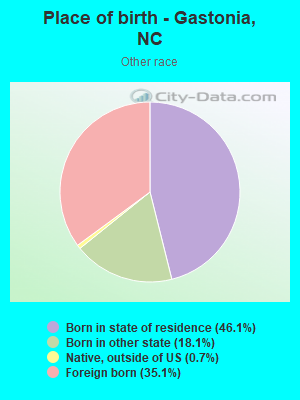
Place of birth - Born in state of residence (%) - Other Race
Place of birth - Born in other state (%)
Place of birth - Born in other state (%) - White
Place of birth - Born in other state (%) - Black or African American
Place of birth - Born in other state (%) - Asian
Place of birth - Born in other state (%) - Hispanic or Latino
Place of birth - Born in other state (%) - American Indian and Alaska Native
Place of birth - Born in other state (%) - Multirace
Place of birth - Born in other state (%) - Other Race
Place of birth - Native, outside of US (%)
Place of birth - Native, outside of US (%) - White
Place of birth - Native, outside of US (%) - Black or African American
Place of birth - Native, outside of US (%) - Asian
Place of birth - Native, outside of US (%) - Hispanic or Latino
Place of birth - Native, outside of US (%) - American Indian and Alaska Native
Place of birth - Native, outside of US (%) - Multirace
Place of birth - Native, outside of US (%) - Other Race
Place of birth - Foreign born (%)
Place of birth - Foreign born (%) - White
Place of birth - Foreign born (%) - Black or African American
Place of birth - Foreign born (%) - Asian
Place of birth - Foreign born (%) - Hispanic or Latino
Place of birth - Foreign born (%) - American Indian and Alaska Native
Place of birth - Foreign born (%) - Multirace
Place of birth - Foreign born (%) - Other Race
Residents speaking English at home (%)
Residents speaking English at home - Born in the United States (%)
Residents speaking English at home - Native, born elsewhere (%)
Residents speaking English at home - Foreign born (%)
Residents speaking Spanish at home (%)
Residents speaking Spanish at home - Born in the United States (%)
Residents speaking Spanish at home - Native, born elsewhere (%)
Residents speaking Spanish at home - Foreign born (%)
Residents speaking other language at home (%)
Residents speaking other language at home - Born in the United States (%)
Residents speaking other language at home - Native, born elsewhere (%)
Residents speaking other language at home - Foreign born (%)
Marital status - Never married (%)
Marital status - Now married (%)
Marital status - Separated (%)
Marital status - Widowed (%)
Marital status - Divorced (%)
Ancestries Reported - Arab (%)
Ancestries Reported - Czech (%)
Ancestries Reported - Danish (%)
Ancestries Reported - Dutch (%)
Ancestries Reported - English (%)
Ancestries Reported - French (%)
Ancestries Reported - French Canadian (%)
Ancestries Reported - German (%)
Ancestries Reported - Greek (%)
Ancestries Reported - Hungarian (%)
Ancestries Reported - Irish (%)
Ancestries Reported - Italian (%)
Ancestries Reported - Lithuanian (%)
Ancestries Reported - Norwegian (%)
Ancestries Reported - Polish (%)
Ancestries Reported - Portuguese (%)
Ancestries Reported - Russian (%)
Ancestries Reported - Scotch-Irish (%)
Ancestries Reported - Scottish (%)
Ancestries Reported - Slovak (%)
Ancestries Reported - Subsaharan African (%)
Ancestries Reported - Swedish (%)
Ancestries Reported - Swiss (%)
Ancestries Reported - Ukrainian (%)
Ancestries Reported - United States (%)
Ancestries Reported - Welsh (%)
Ancestries Reported - West Indian (%)
Ancestries Reported - Other (%)
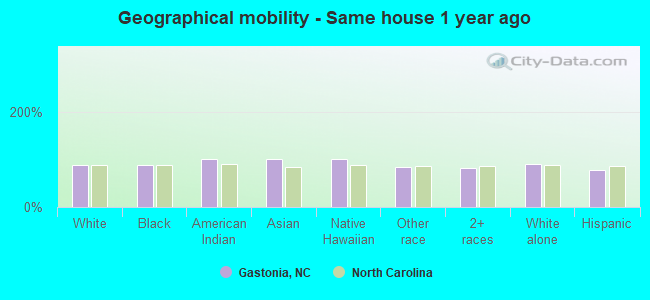
Geographical mobility - Same house 1 year ago (%)
Geographical mobility - Same house 1 year ago (%) - White
Geographical mobility - Same house 1 year ago (%) - Black or African American
Geographical mobility - Same house 1 year ago (%) - Asian
Geographical mobility - Same house 1 year ago (%) - Hispanic or Latino
Geographical mobility - Same house 1 year ago (%) - American Indian and Alaska Native
Geographical mobility - Same house 1 year ago (%) - Multirace
Geographical mobility - Same house 1 year ago (%) - Other Race
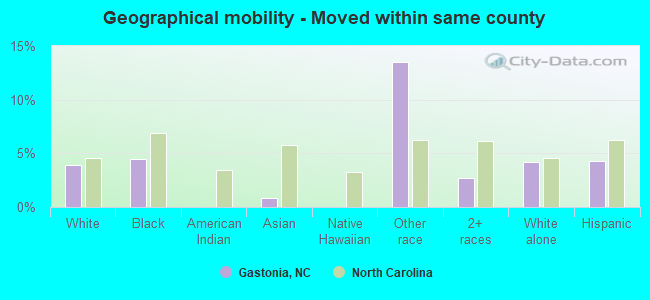
Geographical mobility - Moved within same county (%)
Geographical mobility - Moved within same county (%) - White
Geographical mobility - Moved within same county (%) - Black or African American
Geographical mobility - Moved within same county (%) - Asian
Geographical mobility - Moved within same county (%) - Hispanic or Latino
Geographical mobility - Moved within same county (%) - American Indian and Alaska Native
Geographical mobility - Moved within same county (%) - Multirace
Geographical mobility - Moved within same county (%) - Other Race
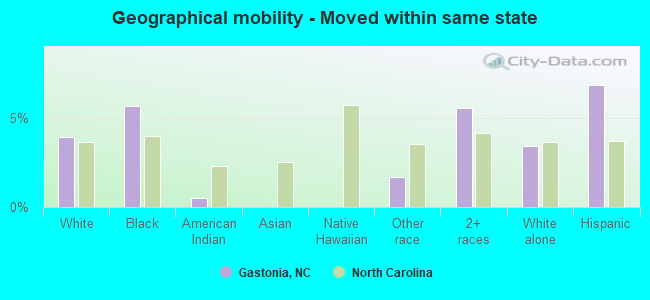
Geographical mobility - Moved from different county within same state (%)
Geographical mobility - Moved from different county within same state (%) - White
Geographical mobility - Moved from different county within same state (%) - Black or African American
Geographical mobility - Moved from different county within same state (%) - Asian
Geographical mobility - Moved from different county within same state (%) - Hispanic or Latino
Geographical mobility - Moved from different county within same state (%) - American Indian and Alaska Native
Geographical mobility - Moved from different county within same state (%) - Multirace
Geographical mobility - Moved from different county within same state (%) - Other Race
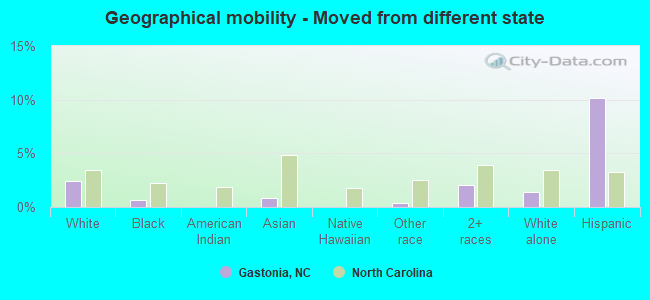
Geographical mobility - Moved from different state (%)
Geographical mobility - Moved from different state (%) - White
Geographical mobility - Moved from different state (%) - Black or African American
Geographical mobility - Moved from different state (%) - Asian
Geographical mobility - Moved from different state (%) - Hispanic or Latino
Geographical mobility - Moved from different state (%) - American Indian and Alaska Native
Geographical mobility - Moved from different state (%) - Multirace
Geographical mobility - Moved from different state (%) - Other Race
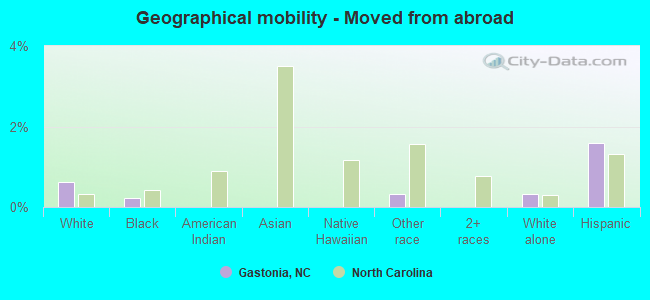
Geographical mobility - Moved from abroad (%)
Geographical mobility - Moved from abroad (%) - White
Geographical mobility - Moved from abroad (%) - Black or African American
Geographical mobility - Moved from abroad (%) - Asian
Geographical mobility - Moved from abroad (%) - Hispanic or Latino
Geographical mobility - Moved from abroad (%) - American Indian and Alaska Native
Geographical mobility - Moved from abroad (%) - Multirace
Geographical mobility - Moved from abroad (%) - Other Race
Place of birth for the foreign-born population - Ireland (%)
Place of birth for the foreign-born population - Denmark (%)
Place of birth for the foreign-born population - Norway (%)
Place of birth for the foreign-born population - Sweden (%)
Place of birth for the foreign-born population - United Kingdom (%)
Place of birth for the foreign-born population - England (%)
Place of birth for the foreign-born population - Scotland (%)
Place of birth for the foreign-born population - Other Northern Europe (%)
Place of birth for the foreign-born population - Austria (%)
Place of birth for the foreign-born population - Belgium (%)
Place of birth for the foreign-born population - France (%)
Place of birth for the foreign-born population - Germany (%)
Place of birth for the foreign-born population - Netherlands (%)
Place of birth for the foreign-born population - Switzerland (%)
Place of birth for the foreign-born population - Other Western Europe (%)
Place of birth for the foreign-born population - Greece (%)
Place of birth for the foreign-born population - Italy (%)
Place of birth for the foreign-born population - Portugal (%)
Place of birth for the foreign-born population - Spain (%)
Place of birth for the foreign-born population - Other Southern Europe (%)
Place of birth for the foreign-born population - Albania (%)
Place of birth for the foreign-born population - Belarus (%)
Place of birth for the foreign-born population - Bosnia and Herzegovina (%)
Place of birth for the foreign-born population - Bulgaria (%)
Place of birth for the foreign-born population - Croatia (%)
Place of birth for the foreign-born population - Czechoslovakia (%)
Place of birth for the foreign-born population - Hungary (%)
Place of birth for the foreign-born population - Latvia (%)
Place of birth for the foreign-born population - Lithuania (%)
Place of birth for the foreign-born population - North Macedonia (Macedonia) (%)
Place of birth for the foreign-born population - Moldova (%)
Place of birth for the foreign-born population - Poland (%)
Place of birth for the foreign-born population - Romania (%)
Place of birth for the foreign-born population - Russia (%)
Place of birth for the foreign-born population - Serbia (%)
Place of birth for the foreign-born population - Ukraine (%)
Place of birth for the foreign-born population - Other Eastern Europe (%)
Place of birth for the foreign-born population - China (%)
Place of birth for the foreign-born population - Hong Kong (%)
Place of birth for the foreign-born population - Taiwan (%)
Place of birth for the foreign-born population - Japan (%)
Place of birth for the foreign-born population - Korea (%)
Place of birth for the foreign-born population - Other Eastern Asia (%)
Place of birth for the foreign-born population - Afghanistan (%)
Place of birth for the foreign-born population - Bangladesh (%)
Place of birth for the foreign-born population - India (%)
Place of birth for the foreign-born population - Iran (%)
Place of birth for the foreign-born population - Kazakhstan (%)
Place of birth for the foreign-born population - Nepal (%)
Place of birth for the foreign-born population - Pakistan (%)
Place of birth for the foreign-born population - Sri Lanka (%)
Place of birth for the foreign-born population - Uzbekistan (%)
Place of birth for the foreign-born population - Other South Central Asia (%)
Place of birth for the foreign-born population - Burma (%)
Place of birth for the foreign-born population - Cambodia (%)
Place of birth for the foreign-born population - Indonesia (%)
Place of birth for the foreign-born population - Laos (%)
Place of birth for the foreign-born population - Malaysia (%)
Place of birth for the foreign-born population - Philippines (%)
Place of birth for the foreign-born population - Singapore (%)
Place of birth for the foreign-born population - Thailand (%)
Place of birth for the foreign-born population - Vietnam (%)
Place of birth for the foreign-born population - Other South Eastern Asia (%)
Place of birth for the foreign-born population - Armenia (%)
Place of birth for the foreign-born population - Iraq (%)
Place of birth for the foreign-born population - Israel (%)
Place of birth for the foreign-born population - Jordan (%)
Place of birth for the foreign-born population - Kuwait (%)
Place of birth for the foreign-born population - Lebanon (%)
Place of birth for the foreign-born population - Saudi Arabia (%)
Place of birth for the foreign-born population - Syria (%)
Place of birth for the foreign-born population - Turkey (%)
Place of birth for the foreign-born population - Yemen (%)
Place of birth for the foreign-born population - Other Western Asia (%)
Place of birth for the foreign-born population - Eritrea (%)
Place of birth for the foreign-born population - Ethiopia (%)
Place of birth for the foreign-born population - Kenya (%)
Place of birth for the foreign-born population - Somalia (%)
Place of birth for the foreign-born population - Uganda (%)
Place of birth for the foreign-born population - Zimbabwe (%)
Place of birth for the foreign-born population - Other Eastern Africa (%)
Place of birth for the foreign-born population - Cameroon (%)
Place of birth for the foreign-born population - Congo (%)
Place of birth for the foreign-born population - Democratic Republic of Congo (Zaire) (%)
Place of birth for the foreign-born population - Other Middle Africa (%)
Place of birth for the foreign-born population - Egypt (%)
Place of birth for the foreign-born population - Morocco (%)
Place of birth for the foreign-born population - Sudan (%)
Place of birth for the foreign-born population - Other Northern Africa (%)
Place of birth for the foreign-born population - South Africa (%)
Place of birth for the foreign-born population - Other Southern Africa (%)
Place of birth for the foreign-born population - Cabo Verde (%)
Place of birth for the foreign-born population - Ghana (%)
Place of birth for the foreign-born population - Liberia (%)
Place of birth for the foreign-born population - Nigeria (%)
Place of birth for the foreign-born population - Senegal (%)
Place of birth for the foreign-born population - Sierra Leone (%)
Place of birth for the foreign-born population - Other Western Africa (%)
Place of birth for the foreign-born population - Australia (%)
Place of birth for the foreign-born population - New Zealand (%)
Place of birth for the foreign-born population - Fiji (%)
Place of birth for the foreign-born population - Micronesia (%)
Place of birth for the foreign-born population - Bahamas (%)
Place of birth for the foreign-born population - Barbados (%)
Place of birth for the foreign-born population - Cuba (%)
Place of birth for the foreign-born population - Dominica (%)
Place of birth for the foreign-born population - Dominican Republic (%)
Place of birth for the foreign-born population - Grenada (%)
Place of birth for the foreign-born population - Haiti (%)
Place of birth for the foreign-born population - Jamaica (%)
Place of birth for the foreign-born population - St. Vincent and the Grenadines (%)
Place of birth for the foreign-born population - Trinidad and Tobago (%)
Place of birth for the foreign-born population - West Indies (%)
Place of birth for the foreign-born population - Other Caribbean (%)
Place of birth for the foreign-born population - Belize (%)
Place of birth for the foreign-born population - Costa Rica (%)
Place of birth for the foreign-born population - El Salvador (%)
Place of birth for the foreign-born population - Guatemala (%)
Place of birth for the foreign-born population - Honduras (%)
Place of birth for the foreign-born population - Mexico (%)
Place of birth for the foreign-born population - Nicaragua (%)
Place of birth for the foreign-born population - Panama (%)
Place of birth for the foreign-born population - Other Central America (%)
Place of birth for the foreign-born population - Argentina (%)
Place of birth for the foreign-born population - Bolivia (%)
Place of birth for the foreign-born population - Brazil (%)
Place of birth for the foreign-born population - Chile (%)
Place of birth for the foreign-born population - Colombia (%)
Place of birth for the foreign-born population - Ecuador (%)
Place of birth for the foreign-born population - Guyana (%)
Place of birth for the foreign-born population - Peru (%)
Place of birth for the foreign-born population - Uruguay (%)
Place of birth for the foreign-born population - Venezuela (%)
Place of birth for the foreign-born population - Other South America (%)
Place of birth for the foreign-born population - Canada (%)
Place of birth for the foreign-born population - Other Northern America (%)
Place of birth for the foreign-born population - Other (%)
Latest news about races in Gastonia, NC collected exclusively by city-data.com from local newspapers, TV, and radio stations
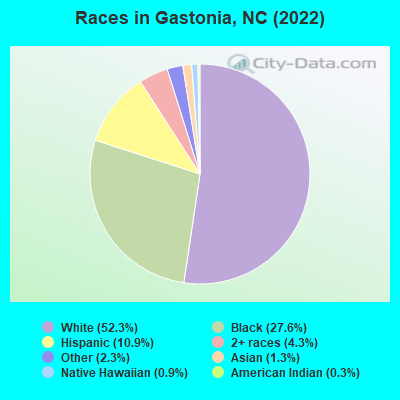
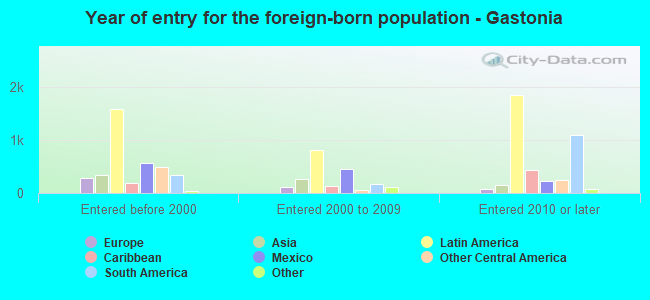
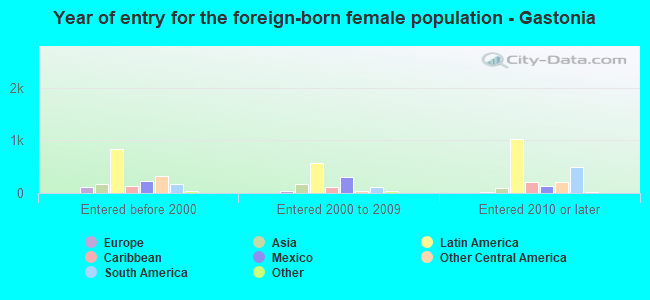
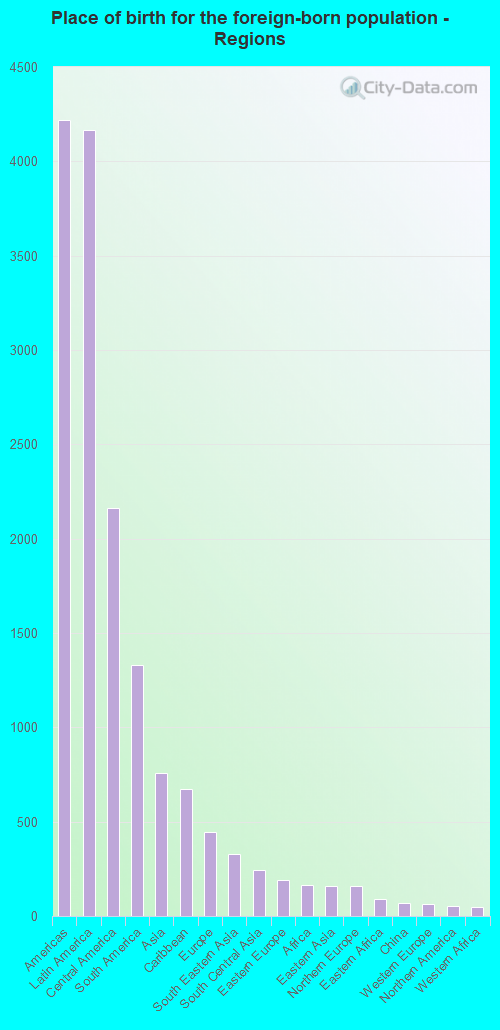
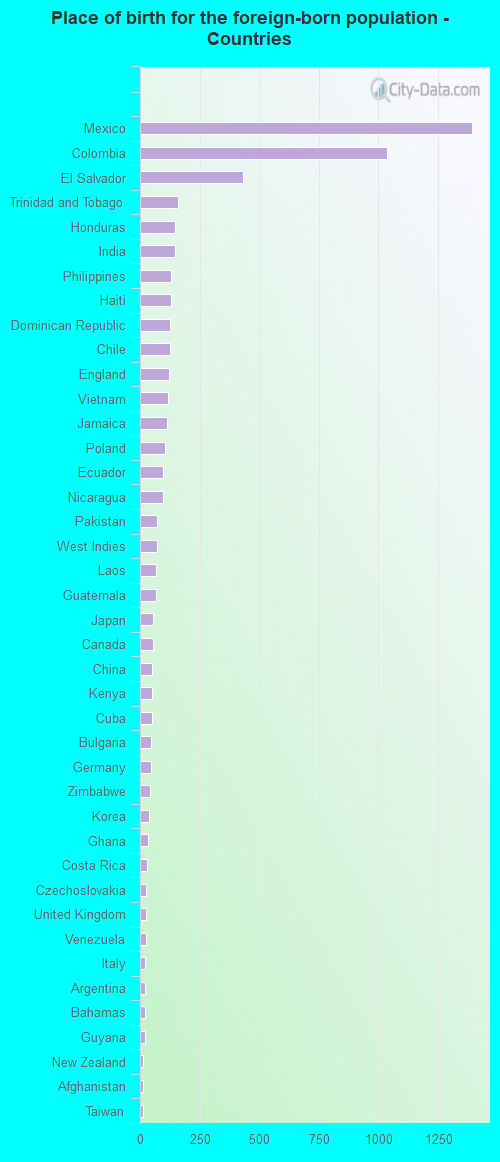
According to 2022 data, the most numerous races in Gastonia, NC are White alone (43,226 residents), Black alone (22,839 residents), and Hispanic (8,979 residents). 88.6% of Gastonia residents speak English at home. 6.8% of Gastonia, NC residents are foreign-born (4.9% born in Latin America, 0.9% born in Asia), which is 17.6% less than the foreign-born rate of 8.0% across the entire state of North Carolina.
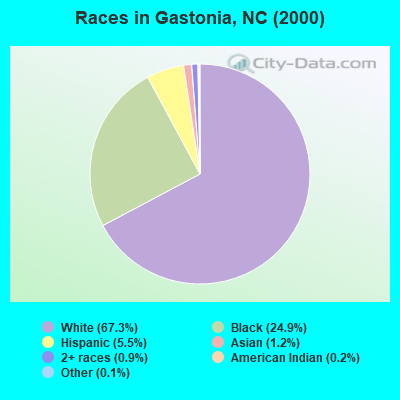
Race distribution in Gastonia
2000 2022
5,647,155 70.2% White alone 1,723,301 21.4% Black alone 378,963 4.7% Hispanic 112,416 1.4% Asian alone 95,333 1.2% American Indian alone 79,965 1.0% Two or more races 9,015 0.1% Other race alone 3,165 0.04% Native Hawaiian and Other
6,497,519 60.7% White alone 2,155,650 20.1% Black alone 1,114,799 10.4% Hispanic 438,061 4.1% Two or more races 341,052 3.2% Asian alone 91,758 0.9% American Indian alone 50,180 0.5% Other race alone 9,954 0.09% Native Hawaiian and Other
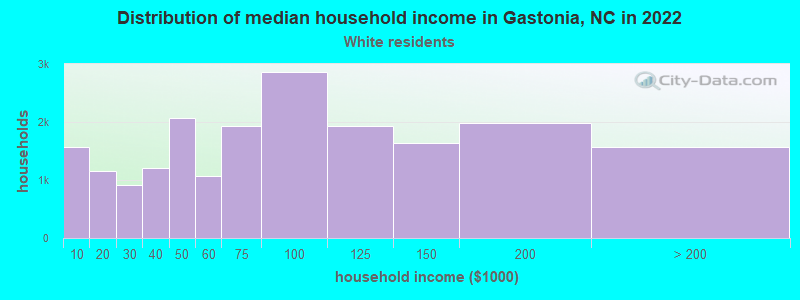
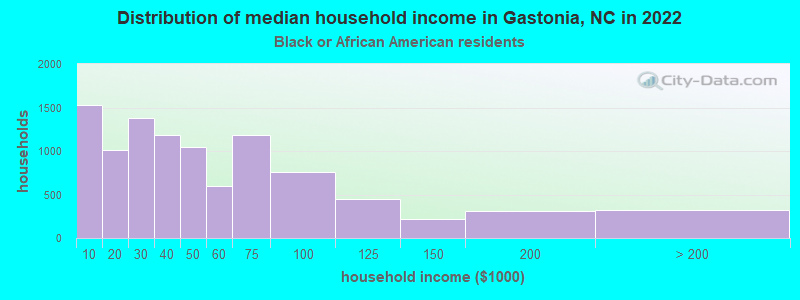
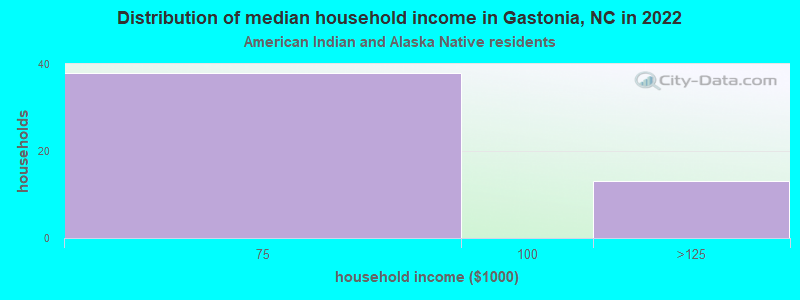
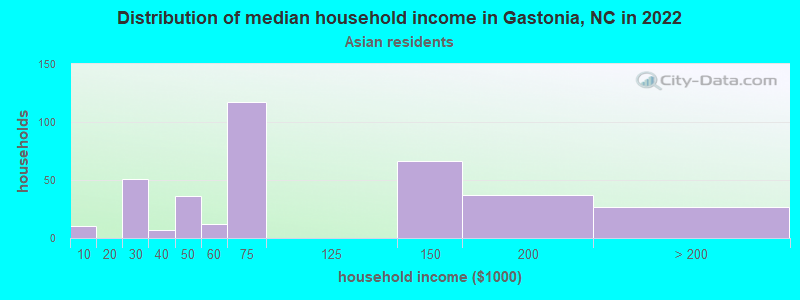
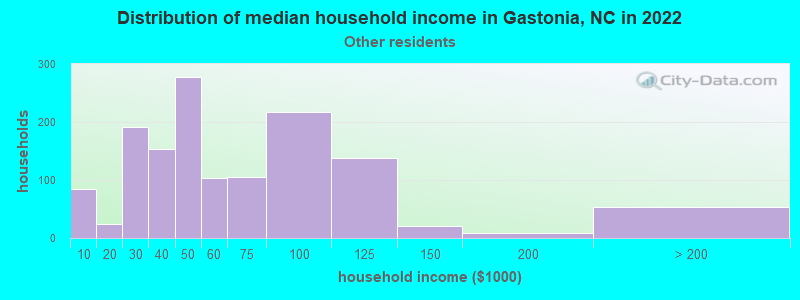
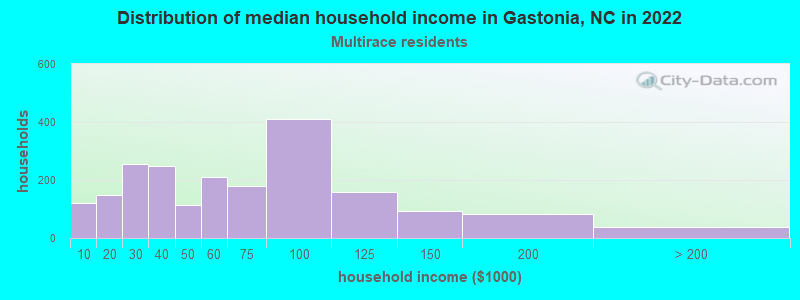
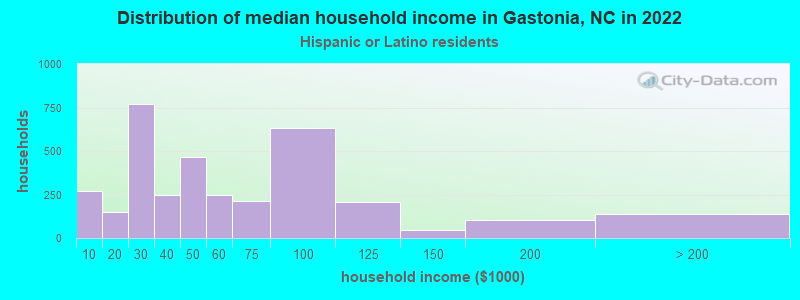
Income and house value in Gastonia Median household income in 2022 $79,929 White non-Hispanic householders$37,008 Black householders$72,574 Asian householders$42,390 Some other race householders$52,430 Two or more races householders$40,480 Hispanic or Latino race householdersMedian 2022 house value $289,637 White Non-Hispanic householders$213,090 Black or African American householders$270,131 American Indian or Alaska Native householders $470,217 Asian householders$265,993 Some other race householders$374,164 Two or more races householders$263,924 Hispanic or Latino householders
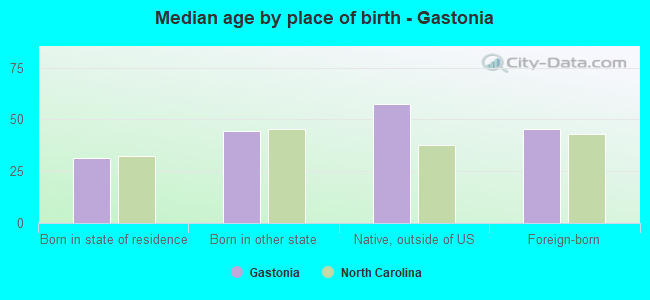
Median age by race in Gastonia
44.1 Median age for White residents40.9 45.5 34.1 Median age for Black or African American residents33.7 34.4 9.6 Median age for American Indian / Alaska Native residents-666,666,666.0 8.4 45.3 Median age for Asian residents33.1 46.6 53.3 Median age for Native Hawaiian / Pacific Islander residents-666,666,666.0 53.3 34.5 Median age for Other race residents27.0 43.2 26.4 Median age for Two or more races residents24.9 27.7 44.6 Median age for White alone residents41.0 46.1 37.7 Median age for Hispanic or Latino residents39.4 33.5
Owner/renter occupied households by race in Gastonia
House owners and renters - White residents 13,898 70.0% Owner occupied5,970 30.0% Renter occupiedHouse owners and renters - Black or African American residents 3,204 32.1% Owner occupied6,773 67.9% Renter occupiedHouse owners and renters - American Indian / Alaska Native residents 34 60.8% Owner occupied22 39.2% Renter occupiedHouse owners and renters - Asian residents 322 64.8% Owner occupied175 35.2% Renter occupiedHouse owners and renters - Native Hawaiian / Pacific Islander residents 44 100.0% Renter occupiedHouse owners and renters - Other race residents 872 50.4% Owner occupied858 49.6% Renter occupiedHouse owners and renters - Two or more races residents 1,748 72.4% Owner occupied668 27.6% Renter occupiedHouse owners and renters - White alone residents 12,942 69.6% Owner occupied5,665 30.4% Renter occupiedHouse owners and renters - Hispanic or Latino residents 2,574 65.2% Owner occupied1,371 34.8% Renter occupied
Language usage in Gastonia
English speakers - Total 88.6% of residents of Gastonia speak English at home.
9.0% of residents speak Spanish at home 3,492 50.2% Speak English very well3,466 49.8% Speak English less than very well2.3% of residents speak other language at home 874 48.7% Speak English very well919 51.3% Speak English less than very well
English speakers - Born in the United States 93.7% of residents of Gastonia speak English at home.
5.9% of residents speak Spanish at home 929 67.1% Speak English very well455 32.9% Speak English less than very well0.4% of residents speak other language at home 44 46.3% Speak English very well51 53.7% Speak English less than very well
English speakers - Native, born elsewhere 27.0% of residents of Gastonia speak English at home.
73.0% of residents speak Spanish at home 30 3.8% Speak English very well769 96.2% Speak English less than very well
English speakers - Foreign-born 19.6% of residents of Gastonia speak English at home.
58.8% of residents speak Spanish at home 1,524 40.5% Speak English very well2,242 59.5% Speak English less than very well21.6% of residents speak other language at home 665 48.0% Speak English very well721 52.0% Speak English less than very well
White (Caucasian) - Speak only English Native:
96.1% (40,862)Foreign-born:
23.2% (172)
White (Caucasian) - Speak another language Native:
3.9% (1,664)Foreign-born:
76.8% (569)
Black or African American - Speak only English Native:
99.0% (21,406)Foreign-born:
31.7% (120)
Black or African American - Speak another language Native:
1.1% (232)Foreign-born:
68.1% (258)
American Indian / Alaska Native - Speak another language Native:
5.2% (12)Foreign-born:
100.0% (74)
Asian - Speak only English Native:
54.8% (143)Foreign-born:
24.1% (144)
Asian - Speak another language Native:
45.0% (117)Foreign-born:
73.2% (437)
Other race - Speak only English Native:
50.6% (1,135)Foreign-born:
2.3% (41)
Other race - Speak another language Native:
50.8% (1,140)Foreign-born:
99.1% (1,780)
Two or more races - Speak only English Native:
77.6% (3,447)Foreign-born:
12.9% (310)
Two or more races - Speak another language Native:
22.4% (996)Foreign-born:
87.1% (2,099)
White alone - Speak only English Native:
98.7% (40,009)Foreign-born:
52.9% (212)
White alone - Speak another language Native:
1.3% (525)Foreign-born:
39.0% (156)
Hispanic or Latino - Speak only English Native:
31.2% (1,419)Foreign-born:
5.4% (216)
Hispanic or Latino - Speak another language Native:
68.8% (3,135)Foreign-born:
94.6% (3,766)
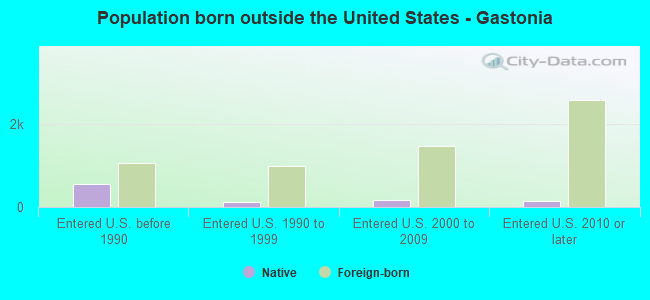
Foreign-born residents in Gastonia 5,611 residents are foreign born (4.9% Latin America , 0.9% Asia ).
This city:
6.8%North Carolina:
8.3%
Marital status for residents in Gastonia Marital status - White (Caucasian) population 15 years and over
Males 35.4% Never married48.6% Now married2.1% Separated2.7% Widowed11.1% DivorcedFemales 26.3% Never married45.8% Now married1.6% Separated12.1% Widowed14.2% DivorcedWomen who gave birth in the past 12 months Now married:
62.1% (681)Unmarried:
37.9% (415)
Women who did not give birth in the past 12 months Now married:
38.1% (3,119)Unmarried:
61.9% (5,060)
Marital status - Black or African American population 15 years and over
Males 44.2% Never married37.5% Now married4.6% Separated1.2% Widowed12.5% DivorcedFemales 46.8% Never married33.0% Now married0.9% Separated11.0% Widowed8.3% DivorcedWomen who gave birth in the past 12 months Now married:
25.6% (325)Unmarried:
74.4% (944)
Women who did not give birth in the past 12 months Now married:
27.2% (1,175)Unmarried:
72.8% (3,139)
Marital status - American Indian / Alaska Native population 15 years and over
Males 42.5% Never married31.5% Now married0.0% Separated0.0% Widowed26.0% DivorcedFemales 35.8% Never married51.6% Now married0.0% Separated0.0% Widowed12.6% DivorcedWomen who gave birth in the past 12 months Now married:
100.0% (19)Unmarried:
0.0% (0)
Women who did not give birth in the past 12 months Now married:
0.0% (0)Unmarried:
100.0% (49)
Marital status - Asian population 15 years and over
Males 50.2% Never married39.0% Now married0.0% Separated0.0% Widowed10.8% DivorcedFemales 33.7% Never married61.4% Now married0.0% Separated0.5% Widowed4.3% DivorcedWomen who gave birth in the past 12 months Now married:
100.0% (5)Unmarried:
0.0% (0)
Women who did not give birth in the past 12 months Now married:
44.5% (120)Unmarried:
55.5% (149)
Marital status - Other race population 15 years and over
Males 31.0% Never married58.0% Now married0.2% Separated0.0% Widowed10.8% DivorcedFemales 36.5% Never married50.6% Now married5.0% Separated2.3% Widowed5.6% DivorcedWomen who gave birth in the past 12 months Now married:
27.3% (12)Unmarried:
72.7% (32)
Women who did not give birth in the past 12 months Now married:
48.6% (560)Unmarried:
51.4% (593)
Marital status - Two or more races population 15 years and over
Males 35.4% Never married60.7% Now married0.0% Separated0.0% Widowed3.9% DivorcedFemales 17.5% Never married52.9% Now married9.3% Separated1.7% Widowed18.6% DivorcedWomen who gave birth in the past 12 months Now married:
4.8% (3)Unmarried:
95.2% (56)
Women who did not give birth in the past 12 months Now married:
48.4% (778)Unmarried:
51.6% (830)
Marital status - White alone, not Hispanic / Latino population 15 years and over
Males 32.0% Never married51.9% Now married1.1% Separated3.0% Widowed12.1% DivorcedFemales 25.2% Never married46.9% Now married1.7% Separated12.5% Widowed13.7% DivorcedWomen who gave birth in the past 12 months Now married:
60.2% (628)Unmarried:
39.8% (415)
Women who did not give birth in the past 12 months Now married:
40.2% (3,084)Unmarried:
59.8% (4,588)
Marital status - Hispanic or Latino population 15 years and over
Males 36.3% Never married47.7% Now married4.2% Separated2.3% Widowed9.4% DivorcedFemales 42.8% Never married40.2% Now married6.0% Separated4.2% Widowed6.7% DivorcedWomen who gave birth in the past 12 months Now married:
100.0% (79)Unmarried:
0.0% (0)
Women who did not give birth in the past 12 months Now married:
48.8% (1,151)Unmarried:
51.2% (1,209)
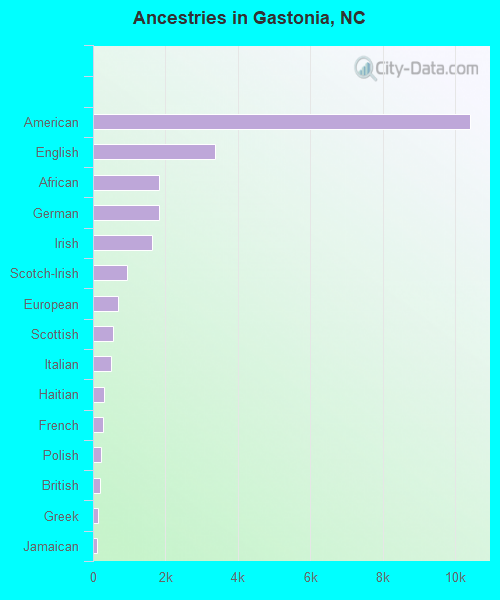
Ancestries in Gastonia
10,416 21.2% American3,383 6.9% English1,814 3.7% African1,812 3.7% German1,633 3.3% Irish931 1.9% Scotch-Irish702 1.4% European547 1.1% Scottish503 1.0% Italian296 0.6% Haitian273 0.6% French230 0.5% Polish185 0.4% British133 0.3% Greek116 0.2% Jamaican94 0.2% Dutch90 0.2% West Indian87 0.2% Northern European78 0.2% Trinidadian and Tobagonian61 0.1% Bulgarian59 0.1% Swedish54 0.1% Bahamian50 0.1% Norwegian44 0.09% Turkish38 0.08% Guyanese37 0.08% Russian35 0.07% Slovak34 0.07% Hungarian33 0.07% Eastern European33 0.07% Kenyan33 0.07% Welsh30 0.06% French Canadian29 0.06% Jordanian25 0.05% Afghan24 0.05% Ghanaian21 0.04% Scandinavian14 0.03% Israeli11 0.02% Egyptian9 0.02% Canadian8 0.02% Austrian8 0.02% Czech7 0.01% Portuguese7 0.01% Moroccan7 0.01% Lithuanian6 0.01% Belgian6 0.01% Swiss6 0.01% Australian
Geographical mobility in Gastonia Same house 1 year ago 40,009 89.1% White (Caucasian)20,111 89.0% Black or African American300 100.0% American Indian / Alaska Native1,011 100.0% Asian146 100.0% Native Hawaiian / Pacific Islander3,137 82.7% Other race5,923 82.3% Two or more races38,498 90.7% White alone, not Hispanic / Latino6,795 77.1% Hispanic or LatinoMoved within same county 1,761 3.9% White / Caucasian1,020 4.5% Black or African American8 0.8% Asian512 13.5% Other race193 2.7% Two or more races1,761 4.1% White alone, not Hispanic / Latino377 4.3% Hispanic or LatinoMoved within same state 1,754 3.9% White / Caucasian1,274 5.6% Black or African American2 0.5% American Indian / Alaska Native63 1.7% Other race397 5.5% Two or more races1,452 3.4% White alone, not Hispanic / Latino601 6.8% Hispanic or LatinoMoved from different state 1,105 2.5% White / Caucasian152 0.7% Black or African American8 0.8% Asian14 0.4% Other race151 2.1% Two or more races583 1.4% White alone, not Hispanic / Latino896 10.2% Hispanic or LatinoMoved from abroad 282 0.6% White49 0.2% Black or African American13 0.3% Other race141 0.3% White alone, not Hispanic / Latino141 1.6% Hispanic or Latino
Children Nativity (place of birth) in Gastonia
Children under 6 years - Living with two parents Both parents native 2,148 100.0% NativeBoth parents foreign-born 163 97.0% Native5 3.0% Foreign-bornOne native, one foreign-born parent 216 100.0% NativeChildren under 6 years - Living with one parent Native parent 3,390 100.0% NativeForeign-born parent 160 72.9% Native59 27.1% Foreign-bornChildren 6 to 17 years - Living with two parents Both parents native 5,203 100.0% NativeBoth parents foreign-born 328 53.5% Native284 46.5% Foreign-bornOne native, one foreign-born parent 632 97.2% Native18 2.8% Foreign-bornChildren 6 to 17 years - Living with one parent Native parent 4,952 100.0% NativeForeign-born parent 385 72.9% Native143 27.1% Foreign-born
Grandparents responsible for own grandchildren in Gastonia
Grandparents (30 to 59 years) White / Caucasian 133 32.4% Responsible for grandchildren277 67.6% Not responsible for grandchildrenBlack or African American 401 38.1% Responsible for grandchildren650 61.9% Not responsible for grandchildrenAmerican Indian / Alaska Native 32 100.0% Not responsible for grandchildrenOther race 29 100.0% Responsible for grandchildrenTwo or more races 29 100.0% Not responsible for grandchildrenWhite alone, not Hispanic / Latino 133 45.0% Responsible for grandchildren162 55.0% Not responsible for grandchildrenHispanic or Latino 23 35.5% Responsible for grandchildren41 64.5% Not responsible for grandchildrenGrandparents (60 years and over) White / Caucasian 217 41.9% Responsible for grandchildren300 58.1% Not responsible for grandchildrenBlack or African American 146 66.3% Responsible for grandchildren74 33.7% Not responsible for grandchildrenOther race 6 100.0% Not responsible for grandchildrenTwo or more races 6 100.0% Not responsible for grandchildrenWhite alone, not Hispanic / Latino 217 42.4% Responsible for grandchildren295 57.6% Not responsible for grandchildrenHispanic or Latino 27 100.0% Not responsible for grandchildren