Races in Gatlinburg, Tennessee (TN) Detailed Stats
Ancestries, Foreign-born residents, place of birth
Settings
X


Recent posts about races in Gatlinburg, Tennessee on our local forum with over 2,400,000 registered users:
 | Gatlinburg, Great Smokies National park hotel question (28 replies) |
| looking to move to Tennessee, but where ? (27 replies) |
| Want to move soon from NY. Ideas appreciated. (41 replies) |
| Can someone tell me about the Rogersville area? (26 replies) |
| Your thoughts on Greeneville, or TN in general-? (25 replies) |
| Racism really an issue in TN? (15 replies) |
Latest news about races in Gatlinburg, TN collected exclusively by city-data.com from local newspapers, TV, and radio stations
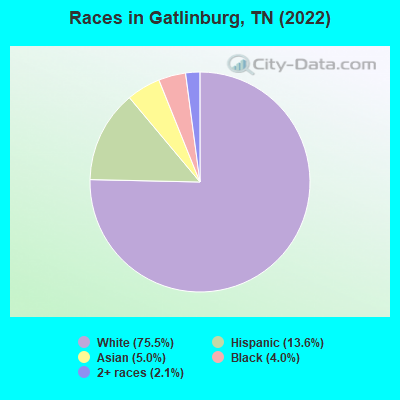
According to 2022 data, the most numerous races in Gatlinburg, TN are White alone (2,796 residents), Black alone (149 residents), and Hispanic (503 residents). 80.5% of Gatlinburg residents speak English at home. 17.8% of Gatlinburg, TN residents are foreign-born (9.9% born in Latin America, 5.1% born in Asia), which is 72.0% greater than the foreign-born rate of 5.0% across the entire state of Tennessee.
Race distribution in Gatlinburg
2000
2022

- 3,21194.9%White alone
- 662.0%Hispanic
- 581.7%Asian alone
- 210.6%Two or more races
- 170.5%American Indian alone
- 50.1%Black alone
- 30.09%Other race alone
- 10.03%Native Hawaiian and Other
Pacific Islander alone

-
- 2,79675.5%White alone
- 50313.6%Hispanic
- 1865.0%Asian alone
- 1494.0%Black alone
- 782.1%Two or more races
- 30.08%American Indian alone
2000
2022
-
- 4,505,93079.2%White alone
- 928,20416.3%Black alone
- 123,8382.2%Hispanic
- 54,8241.0%Two or more races
- 56,0771.0%Asian alone
- 13,8200.2%American Indian alone
- 4,7800.08%Other race alone
- 1,8100.03%Native Hawaiian and Other
Pacific Islander alone

-
- 5,070,02671.9%White alone
- 1,089,73815.5%Black alone
- 442,6296.3%Hispanic
- 279,3814.0%Two or more races
- 131,8171.9%Asian alone
- 26,9720.4%Other race alone
- 6,3870.09%American Indian alone
- 4,3890.06%Native Hawaiian and Other
Pacific Islander alone

Income and house value in Gatlinburg
- Median household income in 2022
- $51,314White non-Hispanic householders
- $40,617Asian householders
- $43,869Some other race householders
- $42,774Two or more races householders
- $53,687Hispanic or Latino race householders
- Median 2022 house value
- $393,774White Non-Hispanic householders
- $393,508Asian householders
- $199,818Hispanic or Latino householders
Household income for White non-Hispanic householders

Household income for Black householders

Household income for Asian householders

Household income for Some other race householders

Household income for Two or more races householders

Household income for Hispanic or Latino race householders

Median age by race in Gatlinburg
- 51.7Median age for White residents
- 48.2Males
- 56.4Females
- 52.7Median age for Black or African American residents
- 31.3Males
- 57.7Females
- -557,471,263.8Median age for American Indian / Alaska Native residents
- -633,911,367.4Males
- -667,936,507.3Females
- 38.7Median age for Asian residents
- 29.4Males
- 51.0Females
- -666,666,666.0Median age for Native Hawaiian / Pacific Islander residents
- -666,666,666.0Males
- -666,666,666.0Females
- 24.2Median age for Other race residents
- 20.2Males
- 36.2Females
- 37.9Median age for Two or more races residents
- 39.0Males
- 26.4Females
- 52.3Median age for White alone residents
- 49.0Males
- 56.7Females
- 24.0Median age for Hispanic or Latino residents
- 21.0Males
- 32.9Females
Owner/renter occupied households by race in Gatlinburg
- House owners and renters - White residents
- 94773.6%Owner occupied
- 33926.4%Renter occupied
- House owners and renters - Black or African American residents
- 1519.8%Owner occupied
- 6280.2%Renter occupied
- House owners and renters - Asian residents
- 2562.8%Owner occupied
- 1537.2%Renter occupied
- House owners and renters - Other race residents
- 67.2%Owner occupied
- 7492.8%Renter occupied
- House owners and renters - Two or more races residents
- 2429.7%Owner occupied
- 5770.3%Renter occupied
- House owners and renters - White alone residents
- 93875.9%Owner occupied
- 29824.1%Renter occupied
- House owners and renters - Hispanic or Latino residents
- 2716.0%Owner occupied
- 14184.0%Renter occupied
Language usage in Gatlinburg
- English speakers - Total
- 80.5% of residents of Gatlinburg speak English at home.
- 13.7% of residents speak Spanish at home
- 23849.4%Speak English very well
- 24450.6%Speak English less than very well
- 6.6% of residents speak other language at home
- 14361.9%Speak English very well
- 8838.1%Speak English less than very well
- English speakers - Born in the United States
- 95.1% of residents of Gatlinburg speak English at home.
- 1.9% of residents speak Spanish at home
- 22100.0%Speak English very well
- 5.1% of residents speak other language at home
- 60100.0%Speak English very well
All residents speak only English at home
- English speakers - Foreign-born
- 9.0% of residents of Gatlinburg speak English at home.
- 67.5% of residents speak Spanish at home
- 16333.5%Speak English very well
- 32366.5%Speak English less than very well
- 23.6% of residents speak other language at home
- 8348.8%Speak English very well
- 8751.2%Speak English less than very well
White (Caucasian) - Speak only English
| Native: | 99.8% (2,528) |
| Foreign-born: | 33.8% (49) |
White (Caucasian) - Speak another language
| Native: | 0.4% (10) |
| Foreign-born: | 67.3% (97) |
Black or African American - Speak only English
| Native: | 90.3% (136) |
| Foreign-born: | 71.6% (23) |
Black or African American - Speak another language
| Native: | 10.1% (15) |
| Foreign-born: | 31.3% (10) |
Asian - Speak another language
| Native: | 79.5% (34) |
| Foreign-born: | 100.0% (144) |
Other race - Speak another language
| Native: | 100.0% (52) |
| Foreign-born: | 98.6% (332) |
Two or more races - Speak another language
| Native: | 14.5% (13) |
| Foreign-born: | 100.0% (57) |
White alone - Speak only English
| Native: | 99.4% (2,530) |
| Foreign-born: | 64.0% (52) |
White alone - Speak another language
| Native: | 0.6% (15) |
| Foreign-born: | 41.3% (34) |
Hispanic or Latino - Speak only English
| Native: | 42.2% (36) |
| Foreign-born: | 0.8% (4) |
Hispanic or Latino - Speak another language
| Native: | 56.0% (48) |
| Foreign-born: | 100.0% (476) |
Foreign-born residents in Gatlinburg
651 residents are foreign born (9.9% Latin America, 5.1% Asia).
| This city: | 17.8% |
| Tennessee: | 5.4% |


Marital status for residents in Gatlinburg
Marital status - White (Caucasian) population 15 years and over
- Males
- 18.8%Never married
- 61.9%Now married
- 2.3%Separated
- 1.3%Widowed
- 15.7%Divorced
- Females
- 20.8%Never married
- 54.9%Now married
- 0.4%Separated
- 7.6%Widowed
- 16.3%Divorced
Women who did not give birth in the past 12 months
| Now married: | 49.1% (202) |
| Unmarried: | 50.9% (209) |
Marital status - Black or African American population 15 years and over
- Males
- 77.9%Never married
- 22.1%Now married
- 0.0%Separated
- 0.0%Widowed
- 0.0%Divorced
- Females
- 1.0%Never married
- 81.6%Now married
- 0.0%Separated
- 0.0%Widowed
- 17.5%Divorced
Women who did not give birth in the past 12 months
| Now married: | 81.6% (82) |
| Unmarried: | 18.4% (18) |
Marital status - Asian population 15 years and over
- Males
- 55.2%Never married
- 44.8%Now married
- 0.0%Separated
- 0.0%Widowed
- 0.0%Divorced
- Females
- 18.1%Never married
- 81.9%Now married
- 0.0%Separated
- 0.0%Widowed
- 0.0%Divorced
Women who did not give birth in the past 12 months
| Now married: | 57.1% (13) |
| Unmarried: | 42.9% (9) |
Marital status - Other race population 15 years and over
- Males
- 62.8%Never married
- 37.2%Now married
- 0.0%Separated
- 0.0%Widowed
- 0.0%Divorced
- Females
- 57.1%Never married
- 33.3%Now married
- 0.0%Separated
- 0.0%Widowed
- 9.5%Divorced
Women who did not give birth in the past 12 months
| Now married: | 33.3% (38) |
| Unmarried: | 66.7% (77) |
Marital status - Two or more races population 15 years and over
- Males
- 44.4%Never married
- 55.6%Now married
- 0.0%Separated
- 0.0%Widowed
- 0.0%Divorced
- Females
- 41.5%Never married
- 49.1%Now married
- 0.0%Separated
- 0.0%Widowed
- 9.4%Divorced
Women who gave birth in the past 12 months
| Now married: | 100.0% (1) |
| Unmarried: | 0.0% (0) |
Women who did not give birth in the past 12 months
| Now married: | 51.4% (28) |
| Unmarried: | 48.6% (27) |
Marital status - White alone, not Hispanic / Latino population 15 years and over
- Males
- 19.5%Never married
- 61.2%Now married
- 2.4%Separated
- 1.3%Widowed
- 15.6%Divorced
- Females
- 21.6%Never married
- 52.8%Now married
- 0.5%Separated
- 8.0%Widowed
- 17.1%Divorced
Women who did not give birth in the past 12 months
| Now married: | 42.1% (153) |
| Unmarried: | 57.9% (209) |
Marital status - Hispanic or Latino population 15 years and over
- Males
- 48.5%Never married
- 46.4%Now married
- 0.0%Separated
- 0.0%Widowed
- 5.1%Divorced
- Females
- 40.4%Never married
- 52.0%Now married
- 0.0%Separated
- 0.0%Widowed
- 7.6%Divorced
Women who gave birth in the past 12 months
| Now married: | 100.0% (1) |
| Unmarried: | 0.0% (0) |
Women who did not give birth in the past 12 months
| Now married: | 53.3% (114) |
| Unmarried: | 46.7% (100) |
Ancestries in Gatlinburg

- 52222.1%American
- 34614.6%English
- 1456.1%Irish
- 1265.3%German
- 1235.2%Scottish
- 401.7%Scotch-Irish
- 271.1%Lebanese
- 271.1%European
- 190.8%Polish
- 170.7%Canadian
- 110.5%Welsh
- 100.4%Dutch
- 70.3%British
- 70.3%French Canadian
- 70.3%Italian
- 70.3%Portuguese
- 60.3%Swiss
- 40.2%Croatian
- 40.2%Norwegian

Geographical mobility in Gatlinburg

- Same house 1 year ago
- 2,51088.9%White (Caucasian)
- 17295.0%Black or African American
- 5100.0%American Indian / Alaska Native
- 10254.0%Asian
- 27495.3%Other race
- 16379.0%Two or more races
- 2,47589.6%White alone, not Hispanic / Latino
- 42183.5%Hispanic or Latino

-
- Moved within same county
- 832.9%White / Caucasian
- 167.6%Two or more races
- 873.1%White alone, not Hispanic / Latino

-
- Moved within same state
- 1184.2%White / Caucasian
- 782.8%White alone, not Hispanic / Latino
- 479.3%Hispanic or Latino

-
- Moved from different state
- 712.5%White / Caucasian
- 6534.7%Asian
- 712.6%White alone, not Hispanic / Latino

-
- Moved from abroad
- 110.4%White
- 158.2%Black or African American
- 5328.4%Asian
- 165.6%Other race
- 2813.5%Two or more races
- 271.0%White alone, not Hispanic / Latino
- 448.8%Hispanic or Latino

Children Nativity (place of birth) in Gatlinburg
Place of birth for residents in Gatlinburg
![Place of birth for the foreign-born population - Regions]()
- 403Americas
- 376Latin America
- 314Central America
- 193Asia
- 63Eastern Asia
- 63China
- 61South Eastern Asia
- 60Caribbean
- 55Europe
- 44South Central Asia
- 34Western Europe
- 27Northern America
- 22Western Asia
- 15Eastern Europe
- 5Northern Europe
- 1South America

![Place of birth for the foreign-born population - Countries]()
- 200Honduras
- 113Mexico
- 59China
- 44India
- 38Dominican Republic
- 34Germany
- 32Philippines
- 27Canada
- 22Turkey
- 21Jamaica
- 19Malaysia
- 9Thailand
- 8Ukraine
- 7Latvia
- 4Norway
- 4Taiwan
- 1Ireland
- 1Peru

Grandparents responsible for own grandchildren in Gatlinburg
Zip codes: 37738.