Races in Gettysburg, Pennsylvania (PA) Detailed Stats
Data:
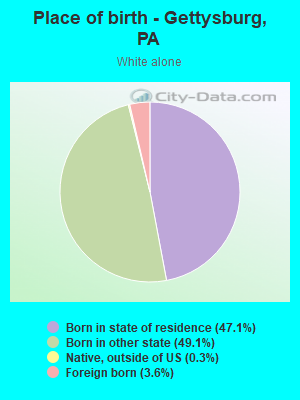
Races - White alone (%)
Races - White alone (% change since 2000)
Races - Black alone (%)
Races - Black alone (% change since 2000)
Races - American Indian alone (%)
Races - American Indian alone (% change since 2000)
Races - Asian alone (%)
Races - Asian alone (% change since 2000)
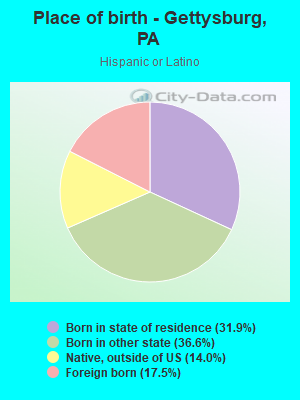
Races - Hispanic (%)
Races - Hispanic (% change since 2000)
Races - Native Hawaiian and Other Pacific Islander alone (%)
Races - Native Hawaiian and Other Pacific Islander alone (% change since 2000)
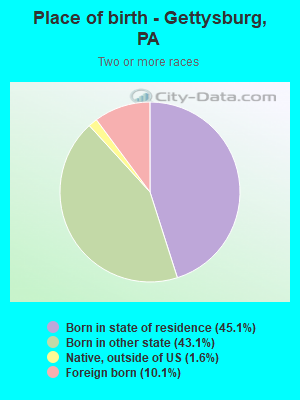
Races - Two or more races(%)
Races - Two or more races(% change since 2000)
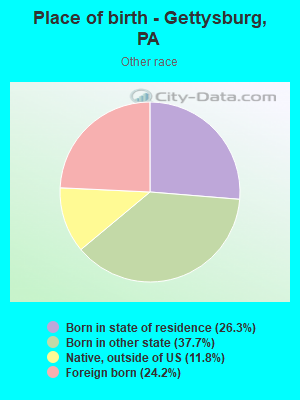
Races - Other race alone (%)
Races - Other race alone (% change since 2000)
Racial diversity
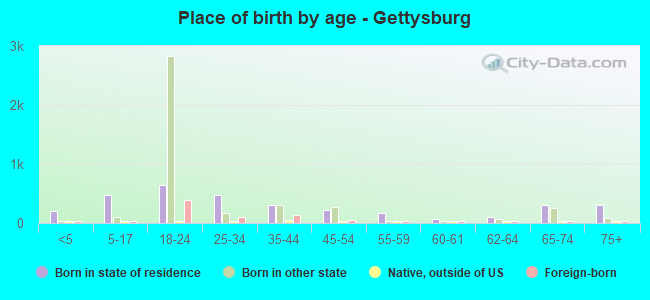
Place of birth - Born in state of residence (%)
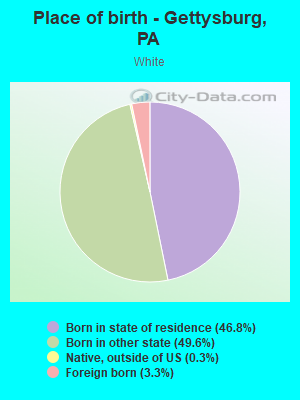
Place of birth - Born in state of residence (%) - White
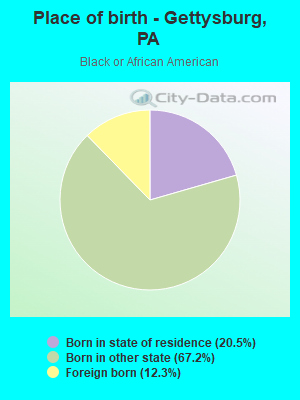
Place of birth - Born in state of residence (%) - Black or African American
Place of birth - Born in state of residence (%) - Asian
Place of birth - Born in state of residence (%) - Hispanic or Latino
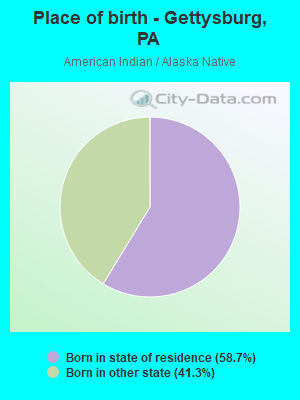
Place of birth - Born in state of residence (%) - American Indian and Alaska Native
Place of birth - Born in state of residence (%) - Multirace
Place of birth - Born in state of residence (%) - Other Race
Place of birth - Born in other state (%)
Place of birth - Born in other state (%) - White
Place of birth - Born in other state (%) - Black or African American
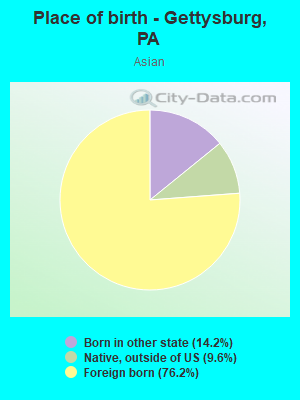
Place of birth - Born in other state (%) - Asian
Place of birth - Born in other state (%) - Hispanic or Latino
Place of birth - Born in other state (%) - American Indian and Alaska Native
Place of birth - Born in other state (%) - Multirace
Place of birth - Born in other state (%) - Other Race
Place of birth - Native, outside of US (%)
Place of birth - Native, outside of US (%) - White
Place of birth - Native, outside of US (%) - Black or African American
Place of birth - Native, outside of US (%) - Asian
Place of birth - Native, outside of US (%) - Hispanic or Latino
Place of birth - Native, outside of US (%) - American Indian and Alaska Native
Place of birth - Native, outside of US (%) - Multirace
Place of birth - Native, outside of US (%) - Other Race
Place of birth - Foreign born (%)
Place of birth - Foreign born (%) - White
Place of birth - Foreign born (%) - Black or African American
Place of birth - Foreign born (%) - Asian
Place of birth - Foreign born (%) - Hispanic or Latino
Place of birth - Foreign born (%) - American Indian and Alaska Native
Place of birth - Foreign born (%) - Multirace
Place of birth - Foreign born (%) - Other Race
Residents speaking English at home (%)
Residents speaking English at home - Born in the United States (%)
Residents speaking English at home - Native, born elsewhere (%)
Residents speaking English at home - Foreign born (%)
Residents speaking Spanish at home (%)
Residents speaking Spanish at home - Born in the United States (%)
Residents speaking Spanish at home - Native, born elsewhere (%)
Residents speaking Spanish at home - Foreign born (%)
Residents speaking other language at home (%)
Residents speaking other language at home - Born in the United States (%)
Residents speaking other language at home - Native, born elsewhere (%)
Residents speaking other language at home - Foreign born (%)
Marital status - Never married (%)
Marital status - Now married (%)
Marital status - Separated (%)
Marital status - Widowed (%)
Marital status - Divorced (%)
Ancestries Reported - Arab (%)
Ancestries Reported - Czech (%)
Ancestries Reported - Danish (%)
Ancestries Reported - Dutch (%)
Ancestries Reported - English (%)
Ancestries Reported - French (%)
Ancestries Reported - French Canadian (%)
Ancestries Reported - German (%)
Ancestries Reported - Greek (%)
Ancestries Reported - Hungarian (%)
Ancestries Reported - Irish (%)
Ancestries Reported - Italian (%)
Ancestries Reported - Lithuanian (%)
Ancestries Reported - Norwegian (%)
Ancestries Reported - Polish (%)
Ancestries Reported - Portuguese (%)
Ancestries Reported - Russian (%)
Ancestries Reported - Scotch-Irish (%)
Ancestries Reported - Scottish (%)
Ancestries Reported - Slovak (%)
Ancestries Reported - Subsaharan African (%)
Ancestries Reported - Swedish (%)
Ancestries Reported - Swiss (%)
Ancestries Reported - Ukrainian (%)
Ancestries Reported - United States (%)
Ancestries Reported - Welsh (%)
Ancestries Reported - West Indian (%)
Ancestries Reported - Other (%)
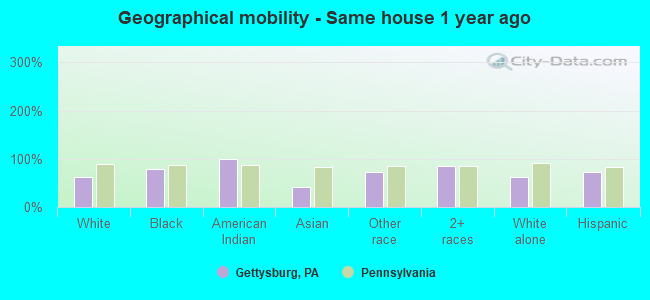
Geographical mobility - Same house 1 year ago (%)
Geographical mobility - Same house 1 year ago (%) - White
Geographical mobility - Same house 1 year ago (%) - Black or African American
Geographical mobility - Same house 1 year ago (%) - Asian
Geographical mobility - Same house 1 year ago (%) - Hispanic or Latino
Geographical mobility - Same house 1 year ago (%) - American Indian and Alaska Native
Geographical mobility - Same house 1 year ago (%) - Multirace
Geographical mobility - Same house 1 year ago (%) - Other Race
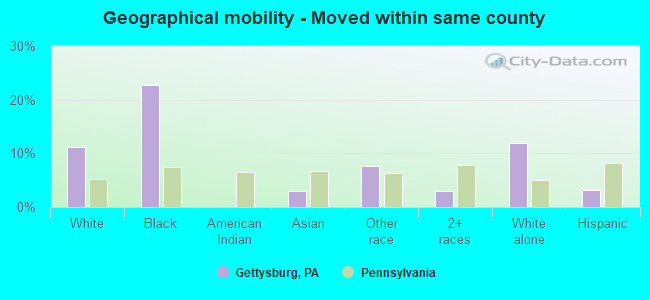
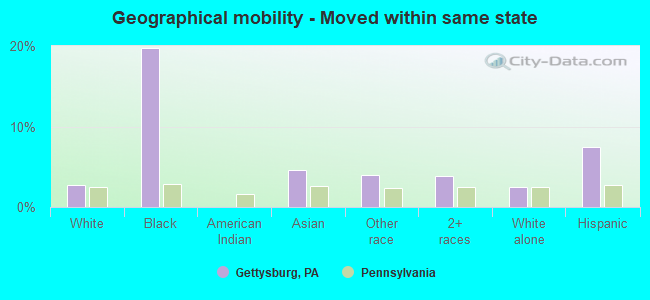
Geographical mobility - Moved within same county (%)
Geographical mobility - Moved within same county (%) - White
Geographical mobility - Moved within same county (%) - Black or African American
Geographical mobility - Moved within same county (%) - Asian
Geographical mobility - Moved within same county (%) - Hispanic or Latino
Geographical mobility - Moved within same county (%) - American Indian and Alaska Native
Geographical mobility - Moved within same county (%) - Multirace
Geographical mobility - Moved within same county (%) - Other Race
Geographical mobility - Moved from different county within same state (%)
Geographical mobility - Moved from different county within same state (%) - White
Geographical mobility - Moved from different county within same state (%) - Black or African American
Geographical mobility - Moved from different county within same state (%) - Asian
Geographical mobility - Moved from different county within same state (%) - Hispanic or Latino
Geographical mobility - Moved from different county within same state (%) - American Indian and Alaska Native
Geographical mobility - Moved from different county within same state (%) - Multirace
Geographical mobility - Moved from different county within same state (%) - Other Race
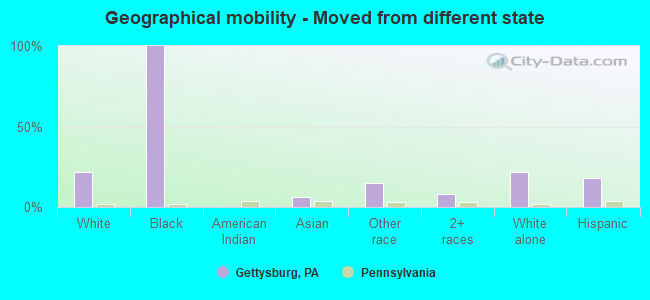
Geographical mobility - Moved from different state (%)
Geographical mobility - Moved from different state (%) - White
Geographical mobility - Moved from different state (%) - Black or African American
Geographical mobility - Moved from different state (%) - Asian
Geographical mobility - Moved from different state (%) - Hispanic or Latino
Geographical mobility - Moved from different state (%) - American Indian and Alaska Native
Geographical mobility - Moved from different state (%) - Multirace
Geographical mobility - Moved from different state (%) - Other Race
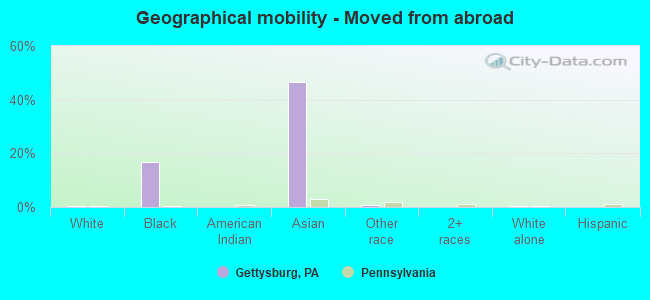
Geographical mobility - Moved from abroad (%)
Geographical mobility - Moved from abroad (%) - White
Geographical mobility - Moved from abroad (%) - Black or African American
Geographical mobility - Moved from abroad (%) - Asian
Geographical mobility - Moved from abroad (%) - Hispanic or Latino
Geographical mobility - Moved from abroad (%) - American Indian and Alaska Native
Geographical mobility - Moved from abroad (%) - Multirace
Geographical mobility - Moved from abroad (%) - Other Race
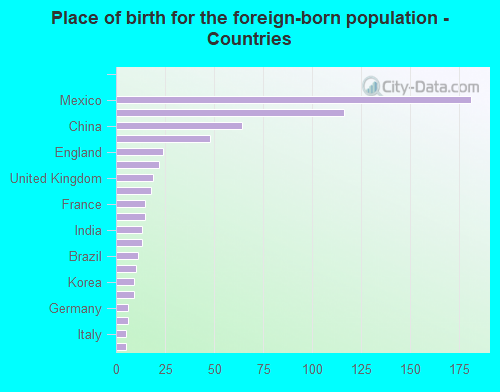
Place of birth for the foreign-born population - Ireland (%)
Place of birth for the foreign-born population - Denmark (%)
Place of birth for the foreign-born population - Norway (%)
Place of birth for the foreign-born population - Sweden (%)
Place of birth for the foreign-born population - United Kingdom (%)
Place of birth for the foreign-born population - England (%)
Place of birth for the foreign-born population - Scotland (%)
Place of birth for the foreign-born population - Other Northern Europe (%)
Place of birth for the foreign-born population - Austria (%)
Place of birth for the foreign-born population - Belgium (%)
Place of birth for the foreign-born population - France (%)
Place of birth for the foreign-born population - Germany (%)
Place of birth for the foreign-born population - Netherlands (%)
Place of birth for the foreign-born population - Switzerland (%)
Place of birth for the foreign-born population - Other Western Europe (%)
Place of birth for the foreign-born population - Greece (%)
Place of birth for the foreign-born population - Italy (%)
Place of birth for the foreign-born population - Portugal (%)
Place of birth for the foreign-born population - Spain (%)
Place of birth for the foreign-born population - Other Southern Europe (%)
Place of birth for the foreign-born population - Albania (%)
Place of birth for the foreign-born population - Belarus (%)
Place of birth for the foreign-born population - Bosnia and Herzegovina (%)
Place of birth for the foreign-born population - Bulgaria (%)
Place of birth for the foreign-born population - Croatia (%)
Place of birth for the foreign-born population - Czechoslovakia (%)
Place of birth for the foreign-born population - Hungary (%)
Place of birth for the foreign-born population - Latvia (%)
Place of birth for the foreign-born population - Lithuania (%)
Place of birth for the foreign-born population - North Macedonia (Macedonia) (%)
Place of birth for the foreign-born population - Moldova (%)
Place of birth for the foreign-born population - Poland (%)
Place of birth for the foreign-born population - Romania (%)
Place of birth for the foreign-born population - Russia (%)
Place of birth for the foreign-born population - Serbia (%)
Place of birth for the foreign-born population - Ukraine (%)
Place of birth for the foreign-born population - Other Eastern Europe (%)
Place of birth for the foreign-born population - China (%)
Place of birth for the foreign-born population - Hong Kong (%)
Place of birth for the foreign-born population - Taiwan (%)
Place of birth for the foreign-born population - Japan (%)
Place of birth for the foreign-born population - Korea (%)
Place of birth for the foreign-born population - Other Eastern Asia (%)
Place of birth for the foreign-born population - Afghanistan (%)
Place of birth for the foreign-born population - Bangladesh (%)
Place of birth for the foreign-born population - India (%)
Place of birth for the foreign-born population - Iran (%)
Place of birth for the foreign-born population - Kazakhstan (%)
Place of birth for the foreign-born population - Nepal (%)
Place of birth for the foreign-born population - Pakistan (%)
Place of birth for the foreign-born population - Sri Lanka (%)
Place of birth for the foreign-born population - Uzbekistan (%)
Place of birth for the foreign-born population - Other South Central Asia (%)
Place of birth for the foreign-born population - Burma (%)
Place of birth for the foreign-born population - Cambodia (%)
Place of birth for the foreign-born population - Indonesia (%)
Place of birth for the foreign-born population - Laos (%)
Place of birth for the foreign-born population - Malaysia (%)
Place of birth for the foreign-born population - Philippines (%)
Place of birth for the foreign-born population - Singapore (%)
Place of birth for the foreign-born population - Thailand (%)
Place of birth for the foreign-born population - Vietnam (%)
Place of birth for the foreign-born population - Other South Eastern Asia (%)
Place of birth for the foreign-born population - Armenia (%)
Place of birth for the foreign-born population - Iraq (%)
Place of birth for the foreign-born population - Israel (%)
Place of birth for the foreign-born population - Jordan (%)
Place of birth for the foreign-born population - Kuwait (%)
Place of birth for the foreign-born population - Lebanon (%)
Place of birth for the foreign-born population - Saudi Arabia (%)
Place of birth for the foreign-born population - Syria (%)
Place of birth for the foreign-born population - Turkey (%)
Place of birth for the foreign-born population - Yemen (%)
Place of birth for the foreign-born population - Other Western Asia (%)
Place of birth for the foreign-born population - Eritrea (%)
Place of birth for the foreign-born population - Ethiopia (%)
Place of birth for the foreign-born population - Kenya (%)
Place of birth for the foreign-born population - Somalia (%)
Place of birth for the foreign-born population - Uganda (%)
Place of birth for the foreign-born population - Zimbabwe (%)
Place of birth for the foreign-born population - Other Eastern Africa (%)
Place of birth for the foreign-born population - Cameroon (%)
Place of birth for the foreign-born population - Congo (%)
Place of birth for the foreign-born population - Democratic Republic of Congo (Zaire) (%)
Place of birth for the foreign-born population - Other Middle Africa (%)
Place of birth for the foreign-born population - Egypt (%)
Place of birth for the foreign-born population - Morocco (%)
Place of birth for the foreign-born population - Sudan (%)
Place of birth for the foreign-born population - Other Northern Africa (%)
Place of birth for the foreign-born population - South Africa (%)
Place of birth for the foreign-born population - Other Southern Africa (%)
Place of birth for the foreign-born population - Cabo Verde (%)
Place of birth for the foreign-born population - Ghana (%)
Place of birth for the foreign-born population - Liberia (%)
Place of birth for the foreign-born population - Nigeria (%)
Place of birth for the foreign-born population - Senegal (%)
Place of birth for the foreign-born population - Sierra Leone (%)
Place of birth for the foreign-born population - Other Western Africa (%)
Place of birth for the foreign-born population - Australia (%)
Place of birth for the foreign-born population - New Zealand (%)
Place of birth for the foreign-born population - Fiji (%)
Place of birth for the foreign-born population - Micronesia (%)
Place of birth for the foreign-born population - Bahamas (%)
Place of birth for the foreign-born population - Barbados (%)
Place of birth for the foreign-born population - Cuba (%)
Place of birth for the foreign-born population - Dominica (%)
Place of birth for the foreign-born population - Dominican Republic (%)
Place of birth for the foreign-born population - Grenada (%)
Place of birth for the foreign-born population - Haiti (%)
Place of birth for the foreign-born population - Jamaica (%)
Place of birth for the foreign-born population - St. Vincent and the Grenadines (%)
Place of birth for the foreign-born population - Trinidad and Tobago (%)
Place of birth for the foreign-born population - West Indies (%)
Place of birth for the foreign-born population - Other Caribbean (%)
Place of birth for the foreign-born population - Belize (%)
Place of birth for the foreign-born population - Costa Rica (%)
Place of birth for the foreign-born population - El Salvador (%)
Place of birth for the foreign-born population - Guatemala (%)
Place of birth for the foreign-born population - Honduras (%)
Place of birth for the foreign-born population - Mexico (%)
Place of birth for the foreign-born population - Nicaragua (%)
Place of birth for the foreign-born population - Panama (%)
Place of birth for the foreign-born population - Other Central America (%)
Place of birth for the foreign-born population - Argentina (%)
Place of birth for the foreign-born population - Bolivia (%)
Place of birth for the foreign-born population - Brazil (%)
Place of birth for the foreign-born population - Chile (%)
Place of birth for the foreign-born population - Colombia (%)
Place of birth for the foreign-born population - Ecuador (%)
Place of birth for the foreign-born population - Guyana (%)
Place of birth for the foreign-born population - Peru (%)
Place of birth for the foreign-born population - Uruguay (%)
Place of birth for the foreign-born population - Venezuela (%)
Place of birth for the foreign-born population - Other South America (%)
Place of birth for the foreign-born population - Canada (%)
Place of birth for the foreign-born population - Other Northern America (%)
Place of birth for the foreign-born population - Other (%)
Latest news about races in Gettysburg, PA collected exclusively by city-data.com from local newspapers, TV, and radio stations
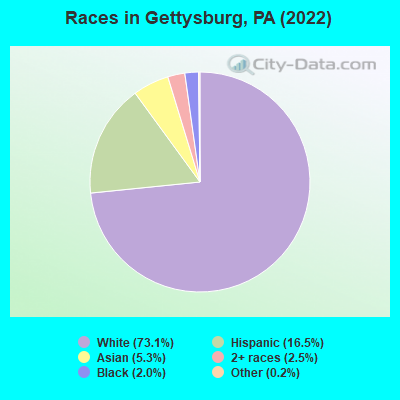
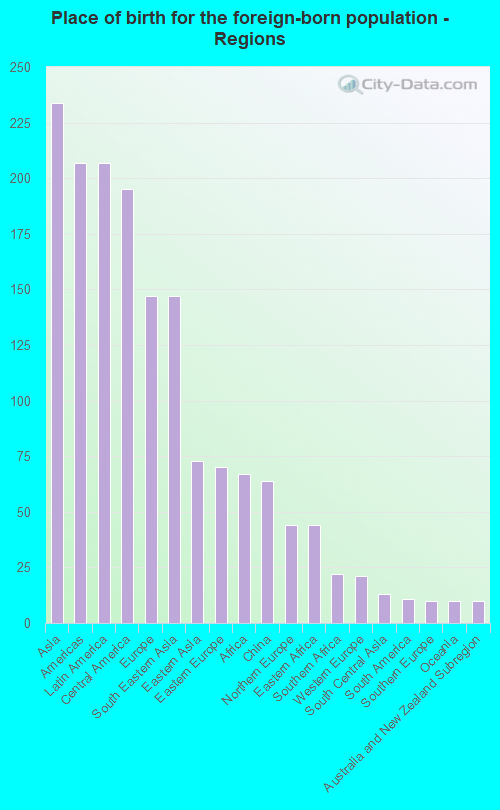
According to 2022 data, the most numerous races in Gettysburg, PA are White alone (5,713 residents), Black alone (160 residents), and Hispanic (1,289 residents). 87.4% of Gettysburg residents speak English at home. 8.5% of Gettysburg, PA residents are foreign-born (2.9% born in Asia, 2.6% born in Latin America, 1.8% born in Europe), which is 18.0% greater than the foreign-born rate of 7.0% across the entire state of Pennsylvania.
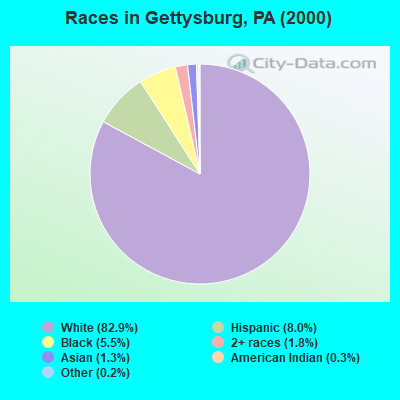
Race distribution in Gettysburg
2000 2022
10,322,455 84.1% White alone 1,202,437 9.8% Black alone 394,088 3.2% Hispanic 218,296 1.8% Asian alone 113,097 0.9% Two or more races 13,086 0.1% Other race alone 14,904 0.1% American Indian alone 2,691 0.02% Native Hawaiian and Other
9,487,228 73.1% White alone 1,311,581 10.1% Black alone 1,115,997 8.6% Hispanic 493,942 3.8% Two or more races 487,124 3.8% Asian alone 63,582 0.5% Other race alone 10,130 0.08% American Indian alone 2,424 0.02% Native Hawaiian and Other
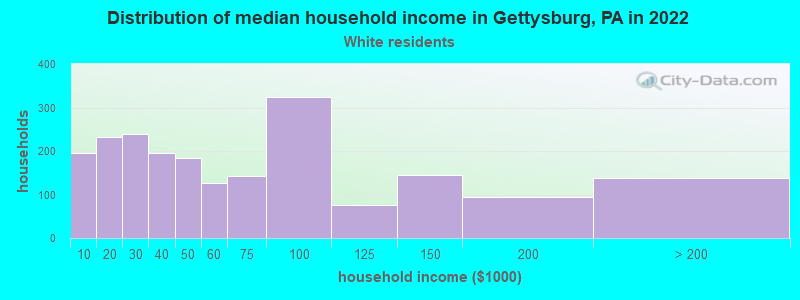
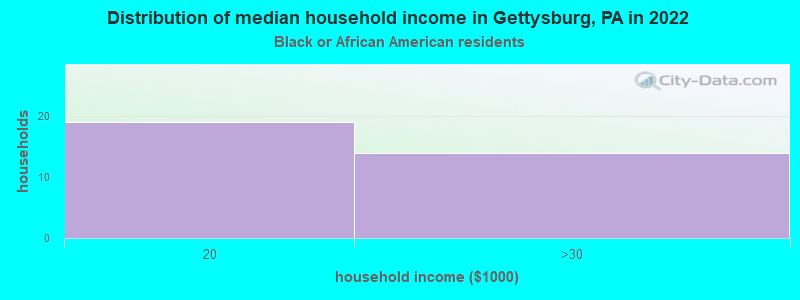
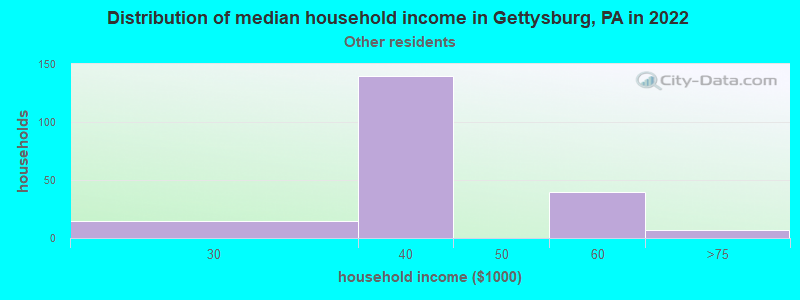
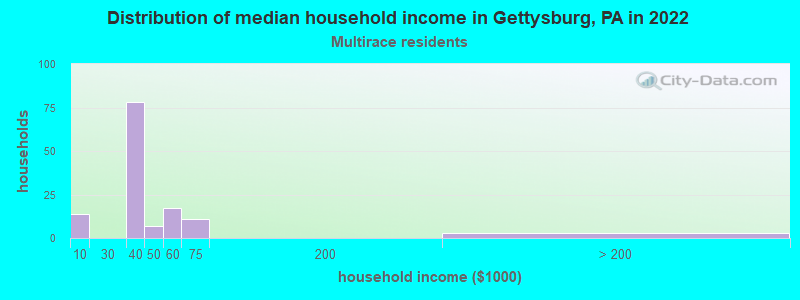
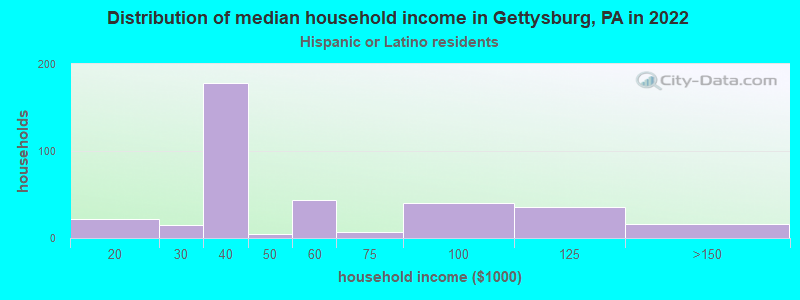
Income and house value in Gettysburg Median household income in 2022 $54,055 White non-Hispanic householders$61,888 Some other race householders$43,892 Two or more races householders$43,940 Hispanic or Latino race householdersMedian 2022 house value $247,968 White Non-Hispanic householders$135,070 Black or African American householders $413,582 Asian householders$254,529 Two or more races householders
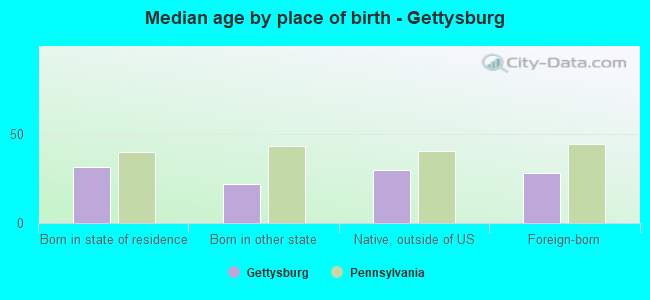
Median age by race in Gettysburg
23.0 Median age for White residents22.0 24.8 18.2 Median age for Black or African American residents25.2 20.4 27.5 Median age for American Indian / Alaska Native residents30.4 -577,519,379.3 15.0 Median age for Asian residents20.3 15.4 -666,666,666.0 Median age for Native Hawaiian / Pacific Islander residents-666,666,666.0 -666,666,666.0 52.1 Median age for Other race residents48.8 34.8 33.3 Median age for Two or more races residents24.7 38.2 23.7 Median age for White alone residents22.2 26.5 27.3 Median age for Hispanic or Latino residents19.8 29.7
Owner/renter occupied households by race in Gettysburg
House owners and renters - White residents 863 41.7% Owner occupied1,204 58.3% Renter occupiedHouse owners and renters - Black or African American residents 35 100.0% Renter occupiedHouse owners and renters - American Indian / Alaska Native residents 14 100.0% Renter occupiedHouse owners and renters - Asian residents 10 76.3% Owner occupied3 23.7% Renter occupiedHouse owners and renters - Other race residents 174 82.2% Owner occupied38 17.8% Renter occupiedHouse owners and renters - Two or more races residents 19 9.7% Owner occupied181 90.3% Renter occupiedHouse owners and renters - White alone residents 870 43.8% Owner occupied1,119 56.2% Renter occupiedHouse owners and renters - Hispanic or Latino residents 114 35.4% Owner occupied208 64.6% Renter occupied
Language usage in Gettysburg
English speakers - Total 87.4% of residents of Gettysburg speak English at home.
5.8% of residents speak Spanish at home 217 49.3% Speak English very well223 50.7% Speak English less than very well7.0% of residents speak other language at home 341 64.0% Speak English very well192 36.0% Speak English less than very well
English speakers - Born in the United States 90.3% of residents of Gettysburg speak English at home.
6.7% of residents speak Spanish at home 223 91.4% Speak English very well21 8.6% Speak English less than very well4.7% of residents speak other language at home 169 100.0% Speak English very well
English speakers - Native, born elsewhere 38.6% of residents of Gettysburg speak English at home.
47.6% of residents speak Spanish at home 4 5.8% Speak English very well65 94.2% Speak English less than very well
English speakers - Foreign-born 41.0% of residents of Gettysburg speak English at home.
21.2% of residents speak Spanish at home 82 48.5% Speak English very well87 51.5% Speak English less than very well38.4% of residents speak other language at home 100 32.7% Speak English very well206 67.3% Speak English less than very well
White (Caucasian) - Speak only English Native:
95.0% (5,481)Foreign-born:
83.0% (163)
White (Caucasian) - Speak another language Native:
3.7% (213)Foreign-born:
34.4% (67)
Black or African American - Speak another language Native:
3.0% (8)Foreign-born:
91.9% (36)
Asian - Speak only English Native:
55.6% (23)Foreign-born:
55.4% (208)
Asian - Speak another language Native:
53.4% (22)Foreign-born:
49.6% (186)
Other race - Speak another language Native:
39.2% (126)Foreign-born:
100.0% (95)
Two or more races - Speak only English Native:
84.0% (524)Foreign-born:
22.1% (15)
Two or more races - Speak another language Native:
16.8% (105)Foreign-born:
71.4% (49)
White alone - Speak only English Native:
96.0% (5,176)Foreign-born:
60.0% (123)
White alone - Speak another language Native:
3.1% (166)Foreign-born:
39.0% (80)
Hispanic or Latino - Speak only English Native:
75.0% (749)Foreign-born:
10.8% (25)
Hispanic or Latino - Speak another language Native:
26.4% (264)Foreign-born:
81.1% (189)
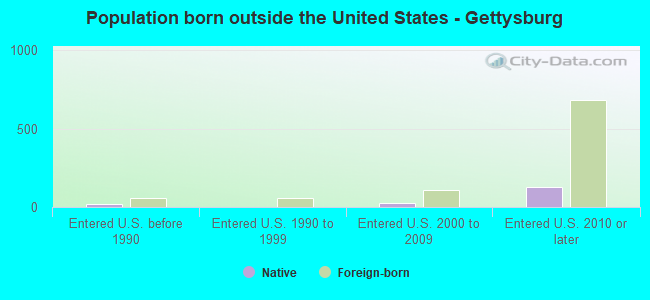
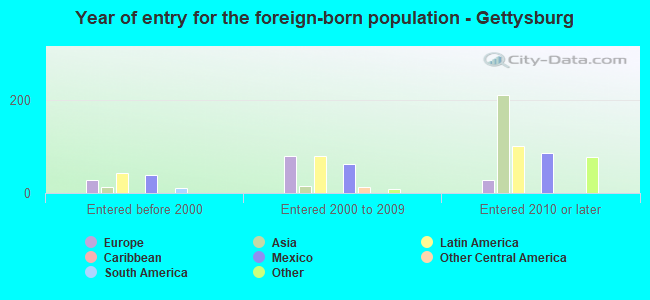
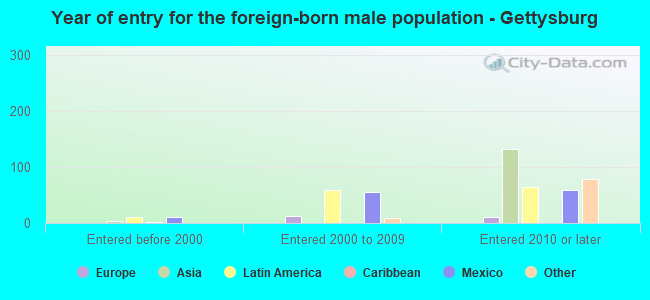
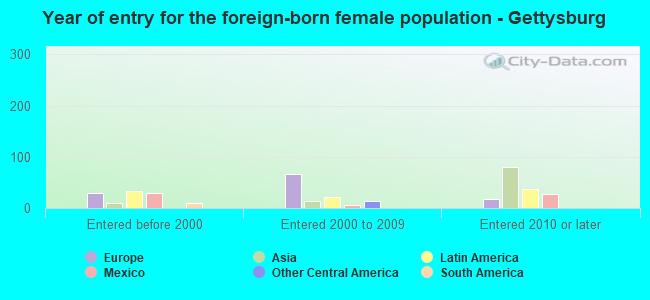
Foreign-born residents in Gettysburg 667 residents are foreign born (2.9% Asia , 2.6% Latin America , 1.8% Europe ).
This city:
8.5%Pennsylvania:
7.3%
Marital status for residents in Gettysburg Marital status - White (Caucasian) population 15 years and over
Males 61.8% Never married24.9% Now married0.2% Separated3.0% Widowed10.1% DivorcedFemales 55.7% Never married25.0% Now married1.4% Separated2.6% Widowed15.2% DivorcedWomen who gave birth in the past 12 months Now married:
100.0% (30)Unmarried:
0.0% (0)
Women who did not give birth in the past 12 months Now married:
18.6% (362)Unmarried:
81.4% (1,579)
Marital status - Black or African American population 15 years and over
Males 99.3% Never married0.0% Now married0.0% Separated0.0% Widowed0.7% DivorcedFemales 83.1% Never married9.8% Now married7.1% Separated0.0% Widowed0.0% DivorcedWomen who gave birth in the past 12 months Now married:
0.0% (0)Unmarried:
100.0% (2)
Women who did not give birth in the past 12 months Now married:
17.1% (30)Unmarried:
82.9% (144)
Marital status - American Indian / Alaska Native population 15 years and over
Males 0.0% Never married100.0% Now married0.0% Separated0.0% Widowed0.0% DivorcedFemales 0.0% Never married100.0% Now married0.0% Separated0.0% Widowed0.0% DivorcedWomen who did not give birth in the past 12 months Now married:
100.0% (20)Unmarried:
0.0% (0)
Marital status - Asian population 15 years and over
Males 98.1% Never married1.9% Now married0.0% Separated0.0% Widowed0.0% DivorcedFemales 80.7% Never married19.3% Now married0.0% Separated0.0% Widowed0.0% DivorcedWomen who did not give birth in the past 12 months Now married:
13.5% (17)Unmarried:
86.5% (112)
Marital status - Other race population 15 years and over
Males 32.7% Never married67.3% Now married0.0% Separated0.0% Widowed0.0% DivorcedFemales 31.1% Never married17.3% Now married0.0% Separated0.0% Widowed51.5% DivorcedWomen who did not give birth in the past 12 months Now married:
17.3% (42)Unmarried:
82.7% (202)
Marital status - Two or more races population 15 years and over
Males 95.0% Never married5.0% Now married0.0% Separated0.0% Widowed0.0% DivorcedFemales 57.6% Never married36.6% Now married0.0% Separated2.9% Widowed2.9% DivorcedWomen who did not give birth in the past 12 months Now married:
29.9% (56)Unmarried:
70.1% (132)
Marital status - White alone, not Hispanic / Latino population 15 years and over
Males 59.9% Never married27.2% Now married0.2% Separated3.4% Widowed9.3% DivorcedFemales 54.0% Never married25.0% Now married1.6% Separated2.8% Widowed16.6% DivorcedWomen who gave birth in the past 12 months Now married:
100.0% (31)Unmarried:
0.0% (0)
Women who did not give birth in the past 12 months Now married:
19.9% (355)Unmarried:
80.1% (1,426)
Marital status - Hispanic or Latino population 15 years and over
Males 74.9% Never married16.4% Now married0.0% Separated0.0% Widowed8.7% DivorcedFemales 55.9% Never married25.5% Now married0.0% Separated0.9% Widowed17.8% DivorcedWomen who did not give birth in the past 12 months Now married:
18.0% (105)Unmarried:
82.0% (478)
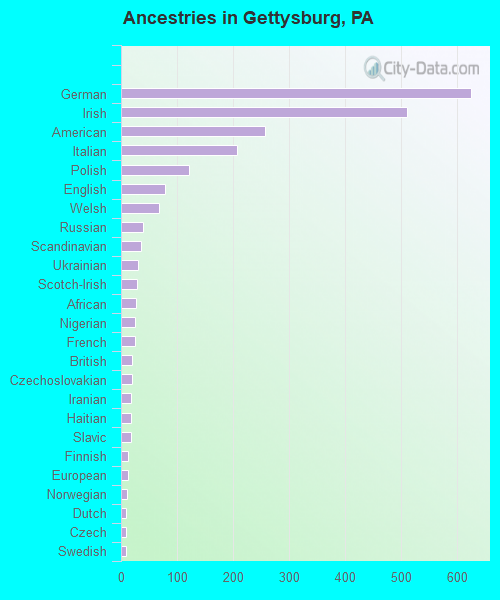
Ancestries in Gettysburg
625 18.1% German510 14.8% Irish257 7.4% American206 6.0% Italian121 3.5% Polish79 2.3% English68 2.0% Welsh40 1.2% Russian35 1.0% Scandinavian30 0.9% Ukrainian28 0.8% Scotch-Irish27 0.8% African25 0.7% Nigerian25 0.7% French19 0.5% British19 0.5% Czechoslovakian18 0.5% Iranian17 0.5% Haitian17 0.5% Slavic13 0.4% Finnish13 0.4% European11 0.3% Norwegian9 0.3% Dutch9 0.3% Czech9 0.3% Swedish9 0.3% Egyptian7 0.2% Greek7 0.2% Swiss5 0.1% Romanian5 0.1% Scottish5 0.1% Danish4 0.1% South African4 0.1% Canadian3 0.09% Eastern European1 0.03% Israeli
Children Nativity (place of birth) in Gettysburg
Children under 6 years - Living with two parents Both parents native 117 100.0% NativeOne native, one foreign-born parent 31 100.0% NativeChildren under 6 years - Living with one parent Native parent 69 100.0% NativeForeign-born parent 8 100.0% Native
Children 6 to 17 years - Living with two parents Both parents native 304 100.0% NativeBoth parents foreign-born 5 100.0% Foreign-bornOne native, one foreign-born parent 88 100.0% NativeChildren 6 to 17 years - Living with one parent Native parent 125 100.0% Native
Grandparents responsible for own grandchildren in Gettysburg
Grandparents (30 to 59 years) Two or more races 7 100.0% Responsible for grandchildren
Grandparents (60 years and over)