Races in Gig Harbor, Washington (WA) Detailed Stats
Data:
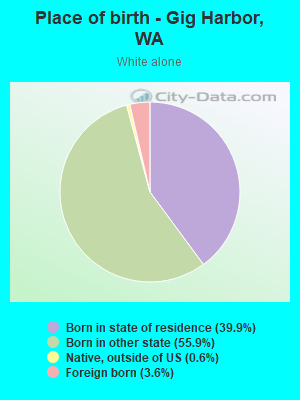
Races - White alone (%)
Races - White alone (% change since 2000)
Races - Black alone (%)
Races - Black alone (% change since 2000)
Races - American Indian alone (%)
Races - American Indian alone (% change since 2000)
Races - Asian alone (%)
Races - Asian alone (% change since 2000)
Races - Hispanic (%)
Races - Hispanic (% change since 2000)
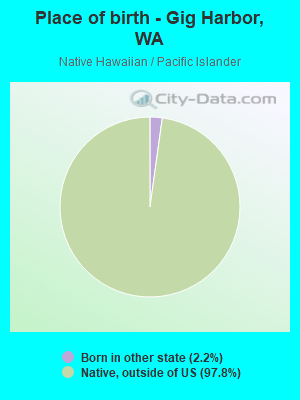
Races - Native Hawaiian and Other Pacific Islander alone (%)
Races - Native Hawaiian and Other Pacific Islander alone (% change since 2000)
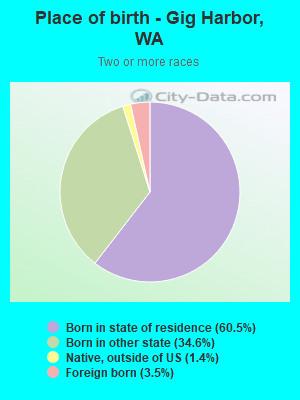
Races - Two or more races(%)
Races - Two or more races(% change since 2000)
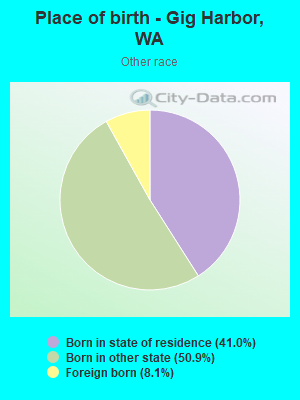
Races - Other race alone (%)
Races - Other race alone (% change since 2000)
Racial diversity
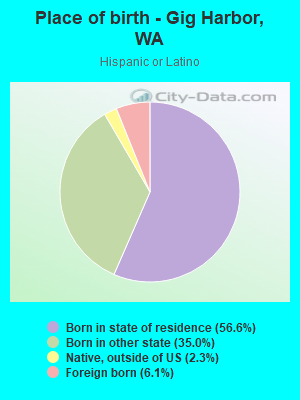
Place of birth - Born in state of residence (%)
Place of birth - Born in state of residence (%) - White
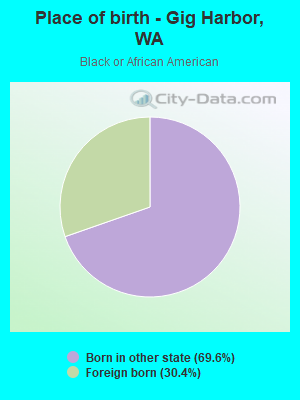
Place of birth - Born in state of residence (%) - Black or African American
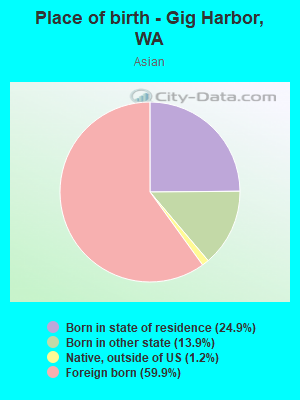
Place of birth - Born in state of residence (%) - Asian
Place of birth - Born in state of residence (%) - Hispanic or Latino
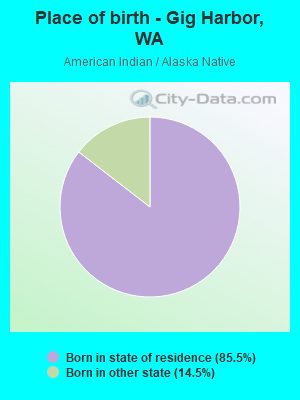
Place of birth - Born in state of residence (%) - American Indian and Alaska Native
Place of birth - Born in state of residence (%) - Multirace
Place of birth - Born in state of residence (%) - Other Race
Place of birth - Born in other state (%)
Place of birth - Born in other state (%) - White
Place of birth - Born in other state (%) - Black or African American
Place of birth - Born in other state (%) - Asian
Place of birth - Born in other state (%) - Hispanic or Latino
Place of birth - Born in other state (%) - American Indian and Alaska Native
Place of birth - Born in other state (%) - Multirace
Place of birth - Born in other state (%) - Other Race
Place of birth - Native, outside of US (%)
Place of birth - Native, outside of US (%) - White
Place of birth - Native, outside of US (%) - Black or African American
Place of birth - Native, outside of US (%) - Asian
Place of birth - Native, outside of US (%) - Hispanic or Latino
Place of birth - Native, outside of US (%) - American Indian and Alaska Native
Place of birth - Native, outside of US (%) - Multirace
Place of birth - Native, outside of US (%) - Other Race
Place of birth - Foreign born (%)
Place of birth - Foreign born (%) - White
Place of birth - Foreign born (%) - Black or African American
Place of birth - Foreign born (%) - Asian
Place of birth - Foreign born (%) - Hispanic or Latino
Place of birth - Foreign born (%) - American Indian and Alaska Native
Place of birth - Foreign born (%) - Multirace
Place of birth - Foreign born (%) - Other Race
Residents speaking English at home (%)
Residents speaking English at home - Born in the United States (%)
Residents speaking English at home - Native, born elsewhere (%)
Residents speaking English at home - Foreign born (%)
Residents speaking Spanish at home (%)
Residents speaking Spanish at home - Born in the United States (%)
Residents speaking Spanish at home - Native, born elsewhere (%)
Residents speaking Spanish at home - Foreign born (%)
Residents speaking other language at home (%)
Residents speaking other language at home - Born in the United States (%)
Residents speaking other language at home - Native, born elsewhere (%)
Residents speaking other language at home - Foreign born (%)
Marital status - Never married (%)
Marital status - Now married (%)
Marital status - Separated (%)
Marital status - Widowed (%)
Marital status - Divorced (%)
Ancestries Reported - Arab (%)
Ancestries Reported - Czech (%)
Ancestries Reported - Danish (%)
Ancestries Reported - Dutch (%)
Ancestries Reported - English (%)
Ancestries Reported - French (%)
Ancestries Reported - French Canadian (%)
Ancestries Reported - German (%)
Ancestries Reported - Greek (%)
Ancestries Reported - Hungarian (%)
Ancestries Reported - Irish (%)
Ancestries Reported - Italian (%)
Ancestries Reported - Lithuanian (%)
Ancestries Reported - Norwegian (%)
Ancestries Reported - Polish (%)
Ancestries Reported - Portuguese (%)
Ancestries Reported - Russian (%)
Ancestries Reported - Scotch-Irish (%)
Ancestries Reported - Scottish (%)
Ancestries Reported - Slovak (%)
Ancestries Reported - Subsaharan African (%)
Ancestries Reported - Swedish (%)
Ancestries Reported - Swiss (%)
Ancestries Reported - Ukrainian (%)
Ancestries Reported - United States (%)
Ancestries Reported - Welsh (%)
Ancestries Reported - West Indian (%)
Ancestries Reported - Other (%)
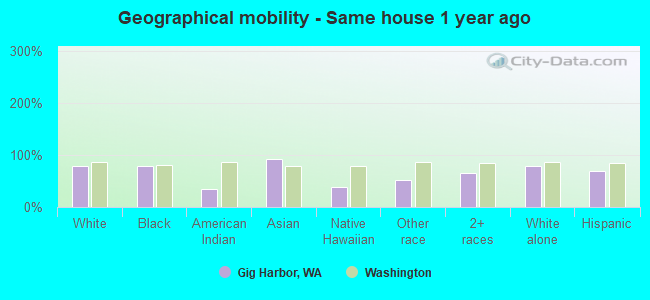
Geographical mobility - Same house 1 year ago (%)
Geographical mobility - Same house 1 year ago (%) - White
Geographical mobility - Same house 1 year ago (%) - Black or African American
Geographical mobility - Same house 1 year ago (%) - Asian
Geographical mobility - Same house 1 year ago (%) - Hispanic or Latino
Geographical mobility - Same house 1 year ago (%) - American Indian and Alaska Native
Geographical mobility - Same house 1 year ago (%) - Multirace
Geographical mobility - Same house 1 year ago (%) - Other Race
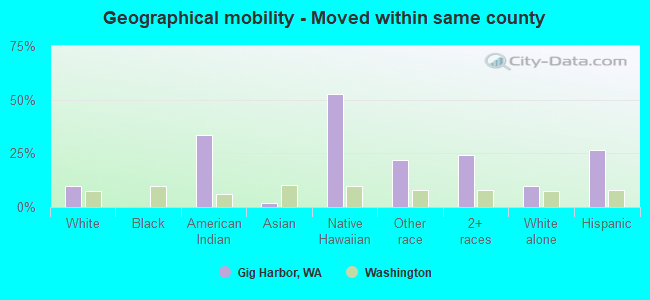
Geographical mobility - Moved within same county (%)
Geographical mobility - Moved within same county (%) - White
Geographical mobility - Moved within same county (%) - Black or African American
Geographical mobility - Moved within same county (%) - Asian
Geographical mobility - Moved within same county (%) - Hispanic or Latino
Geographical mobility - Moved within same county (%) - American Indian and Alaska Native
Geographical mobility - Moved within same county (%) - Multirace
Geographical mobility - Moved within same county (%) - Other Race
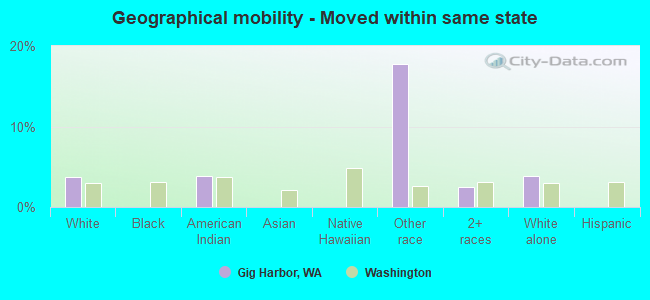
Geographical mobility - Moved from different county within same state (%)
Geographical mobility - Moved from different county within same state (%) - White
Geographical mobility - Moved from different county within same state (%) - Black or African American
Geographical mobility - Moved from different county within same state (%) - Asian
Geographical mobility - Moved from different county within same state (%) - Hispanic or Latino
Geographical mobility - Moved from different county within same state (%) - American Indian and Alaska Native
Geographical mobility - Moved from different county within same state (%) - Multirace
Geographical mobility - Moved from different county within same state (%) - Other Race
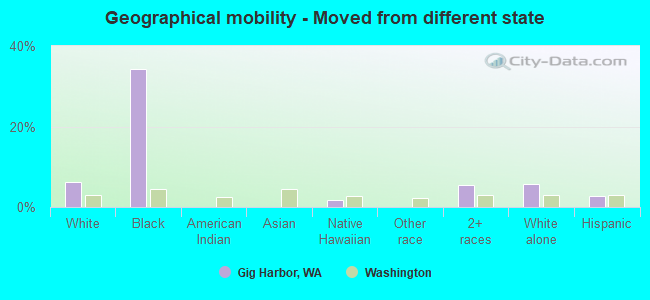
Geographical mobility - Moved from different state (%)
Geographical mobility - Moved from different state (%) - White
Geographical mobility - Moved from different state (%) - Black or African American
Geographical mobility - Moved from different state (%) - Asian
Geographical mobility - Moved from different state (%) - Hispanic or Latino
Geographical mobility - Moved from different state (%) - American Indian and Alaska Native
Geographical mobility - Moved from different state (%) - Multirace
Geographical mobility - Moved from different state (%) - Other Race
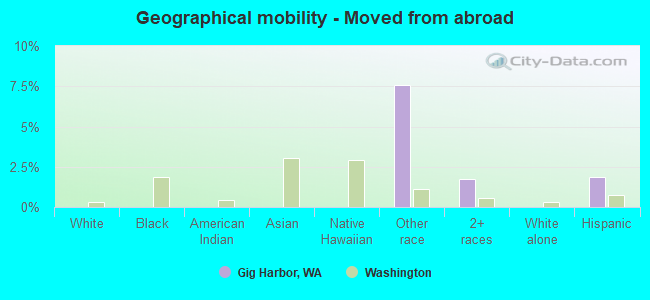
Geographical mobility - Moved from abroad (%)
Geographical mobility - Moved from abroad (%) - White
Geographical mobility - Moved from abroad (%) - Black or African American
Geographical mobility - Moved from abroad (%) - Asian
Geographical mobility - Moved from abroad (%) - Hispanic or Latino
Geographical mobility - Moved from abroad (%) - American Indian and Alaska Native
Geographical mobility - Moved from abroad (%) - Multirace
Geographical mobility - Moved from abroad (%) - Other Race
Place of birth for the foreign-born population - Ireland (%)
Place of birth for the foreign-born population - Denmark (%)
Place of birth for the foreign-born population - Norway (%)
Place of birth for the foreign-born population - Sweden (%)
Place of birth for the foreign-born population - United Kingdom (%)
Place of birth for the foreign-born population - England (%)
Place of birth for the foreign-born population - Scotland (%)
Place of birth for the foreign-born population - Other Northern Europe (%)
Place of birth for the foreign-born population - Austria (%)
Place of birth for the foreign-born population - Belgium (%)
Place of birth for the foreign-born population - France (%)
Place of birth for the foreign-born population - Germany (%)
Place of birth for the foreign-born population - Netherlands (%)
Place of birth for the foreign-born population - Switzerland (%)
Place of birth for the foreign-born population - Other Western Europe (%)
Place of birth for the foreign-born population - Greece (%)
Place of birth for the foreign-born population - Italy (%)
Place of birth for the foreign-born population - Portugal (%)
Place of birth for the foreign-born population - Spain (%)
Place of birth for the foreign-born population - Other Southern Europe (%)
Place of birth for the foreign-born population - Albania (%)
Place of birth for the foreign-born population - Belarus (%)
Place of birth for the foreign-born population - Bosnia and Herzegovina (%)
Place of birth for the foreign-born population - Bulgaria (%)
Place of birth for the foreign-born population - Croatia (%)
Place of birth for the foreign-born population - Czechoslovakia (%)
Place of birth for the foreign-born population - Hungary (%)
Place of birth for the foreign-born population - Latvia (%)
Place of birth for the foreign-born population - Lithuania (%)
Place of birth for the foreign-born population - North Macedonia (Macedonia) (%)
Place of birth for the foreign-born population - Moldova (%)
Place of birth for the foreign-born population - Poland (%)
Place of birth for the foreign-born population - Romania (%)
Place of birth for the foreign-born population - Russia (%)
Place of birth for the foreign-born population - Serbia (%)
Place of birth for the foreign-born population - Ukraine (%)
Place of birth for the foreign-born population - Other Eastern Europe (%)
Place of birth for the foreign-born population - China (%)
Place of birth for the foreign-born population - Hong Kong (%)
Place of birth for the foreign-born population - Taiwan (%)
Place of birth for the foreign-born population - Japan (%)
Place of birth for the foreign-born population - Korea (%)
Place of birth for the foreign-born population - Other Eastern Asia (%)
Place of birth for the foreign-born population - Afghanistan (%)
Place of birth for the foreign-born population - Bangladesh (%)
Place of birth for the foreign-born population - India (%)
Place of birth for the foreign-born population - Iran (%)
Place of birth for the foreign-born population - Kazakhstan (%)
Place of birth for the foreign-born population - Nepal (%)
Place of birth for the foreign-born population - Pakistan (%)
Place of birth for the foreign-born population - Sri Lanka (%)
Place of birth for the foreign-born population - Uzbekistan (%)
Place of birth for the foreign-born population - Other South Central Asia (%)
Place of birth for the foreign-born population - Burma (%)
Place of birth for the foreign-born population - Cambodia (%)
Place of birth for the foreign-born population - Indonesia (%)
Place of birth for the foreign-born population - Laos (%)
Place of birth for the foreign-born population - Malaysia (%)
Place of birth for the foreign-born population - Philippines (%)
Place of birth for the foreign-born population - Singapore (%)
Place of birth for the foreign-born population - Thailand (%)
Place of birth for the foreign-born population - Vietnam (%)
Place of birth for the foreign-born population - Other South Eastern Asia (%)
Place of birth for the foreign-born population - Armenia (%)
Place of birth for the foreign-born population - Iraq (%)
Place of birth for the foreign-born population - Israel (%)
Place of birth for the foreign-born population - Jordan (%)
Place of birth for the foreign-born population - Kuwait (%)
Place of birth for the foreign-born population - Lebanon (%)
Place of birth for the foreign-born population - Saudi Arabia (%)
Place of birth for the foreign-born population - Syria (%)
Place of birth for the foreign-born population - Turkey (%)
Place of birth for the foreign-born population - Yemen (%)
Place of birth for the foreign-born population - Other Western Asia (%)
Place of birth for the foreign-born population - Eritrea (%)
Place of birth for the foreign-born population - Ethiopia (%)
Place of birth for the foreign-born population - Kenya (%)
Place of birth for the foreign-born population - Somalia (%)
Place of birth for the foreign-born population - Uganda (%)
Place of birth for the foreign-born population - Zimbabwe (%)
Place of birth for the foreign-born population - Other Eastern Africa (%)
Place of birth for the foreign-born population - Cameroon (%)
Place of birth for the foreign-born population - Congo (%)
Place of birth for the foreign-born population - Democratic Republic of Congo (Zaire) (%)
Place of birth for the foreign-born population - Other Middle Africa (%)
Place of birth for the foreign-born population - Egypt (%)
Place of birth for the foreign-born population - Morocco (%)
Place of birth for the foreign-born population - Sudan (%)
Place of birth for the foreign-born population - Other Northern Africa (%)
Place of birth for the foreign-born population - South Africa (%)
Place of birth for the foreign-born population - Other Southern Africa (%)
Place of birth for the foreign-born population - Cabo Verde (%)
Place of birth for the foreign-born population - Ghana (%)
Place of birth for the foreign-born population - Liberia (%)
Place of birth for the foreign-born population - Nigeria (%)
Place of birth for the foreign-born population - Senegal (%)
Place of birth for the foreign-born population - Sierra Leone (%)
Place of birth for the foreign-born population - Other Western Africa (%)
Place of birth for the foreign-born population - Australia (%)
Place of birth for the foreign-born population - New Zealand (%)
Place of birth for the foreign-born population - Fiji (%)
Place of birth for the foreign-born population - Micronesia (%)
Place of birth for the foreign-born population - Bahamas (%)
Place of birth for the foreign-born population - Barbados (%)
Place of birth for the foreign-born population - Cuba (%)
Place of birth for the foreign-born population - Dominica (%)
Place of birth for the foreign-born population - Dominican Republic (%)
Place of birth for the foreign-born population - Grenada (%)
Place of birth for the foreign-born population - Haiti (%)
Place of birth for the foreign-born population - Jamaica (%)
Place of birth for the foreign-born population - St. Vincent and the Grenadines (%)
Place of birth for the foreign-born population - Trinidad and Tobago (%)
Place of birth for the foreign-born population - West Indies (%)
Place of birth for the foreign-born population - Other Caribbean (%)
Place of birth for the foreign-born population - Belize (%)
Place of birth for the foreign-born population - Costa Rica (%)
Place of birth for the foreign-born population - El Salvador (%)
Place of birth for the foreign-born population - Guatemala (%)
Place of birth for the foreign-born population - Honduras (%)
Place of birth for the foreign-born population - Mexico (%)
Place of birth for the foreign-born population - Nicaragua (%)
Place of birth for the foreign-born population - Panama (%)
Place of birth for the foreign-born population - Other Central America (%)
Place of birth for the foreign-born population - Argentina (%)
Place of birth for the foreign-born population - Bolivia (%)
Place of birth for the foreign-born population - Brazil (%)
Place of birth for the foreign-born population - Chile (%)
Place of birth for the foreign-born population - Colombia (%)
Place of birth for the foreign-born population - Ecuador (%)
Place of birth for the foreign-born population - Guyana (%)
Place of birth for the foreign-born population - Peru (%)
Place of birth for the foreign-born population - Uruguay (%)
Place of birth for the foreign-born population - Venezuela (%)
Place of birth for the foreign-born population - Other South America (%)
Place of birth for the foreign-born population - Canada (%)
Place of birth for the foreign-born population - Other Northern America (%)
Place of birth for the foreign-born population - Other (%)
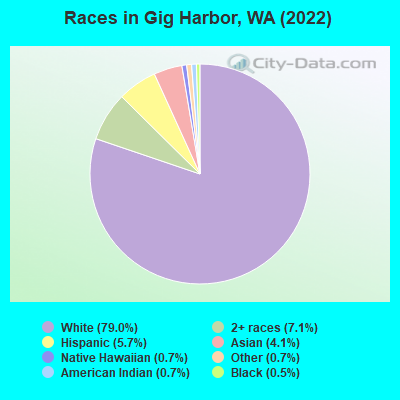
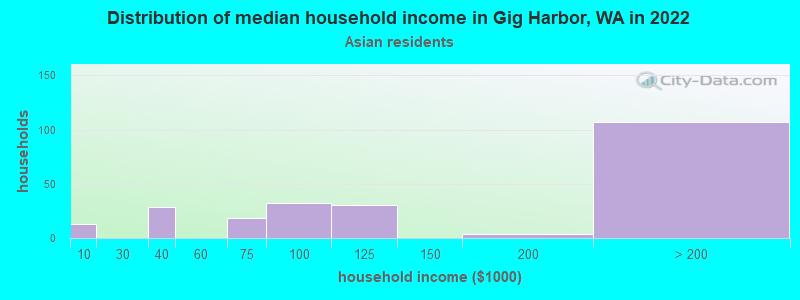
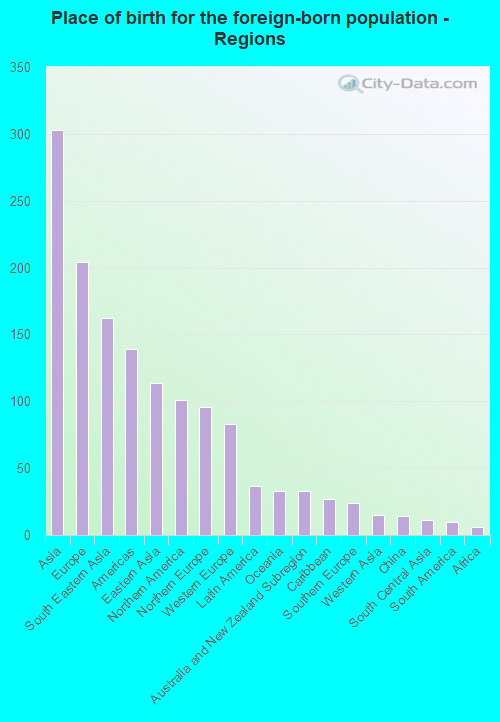
According to 2022 data, the most numerous races in Gig Harbor, WA are White alone (9,497 residents), Hispanic (682 residents), and Asian alone (499 residents). 92.8% of Gig Harbor residents speak English at home. 5.7% of Gig Harbor, WA residents are foreign-born (2.4% born in Asia, 1.6% born in Europe, 0.8% born in North America), which is 163.0% less than the foreign-born rate of 15.0% across the entire state of Washington.
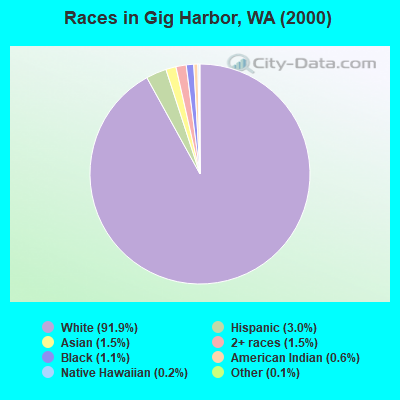
Race distribution in Gig Harbor
2000 2022
4,652,490 78.9% White alone 441,509 7.5% Hispanic 319,401 5.4% Asian alone 184,631 3.1% Black alone 175,926 3.0% Two or more races 85,396 1.4% American Indian alone 22,779 0.4% Native Hawaiian and Other 11,989 0.2% Other race alone
4,941,456 63.5% White alone 1,093,313 14.0% Hispanic 755,832 9.7% Asian alone 523,448 6.7% Two or more races 299,537 3.8% Black alone 69,024 0.9% American Indian alone 52,231 0.7% Native Hawaiian and Other 50,945 0.7% Other race alone
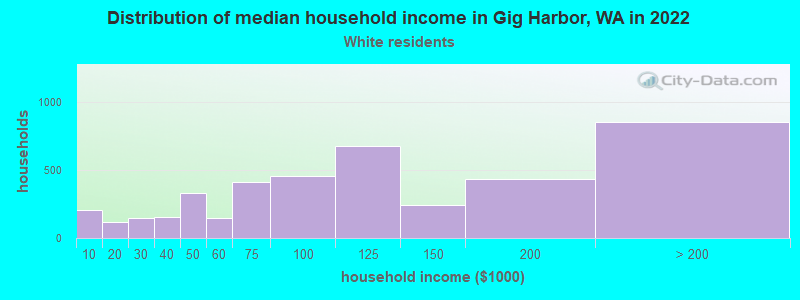
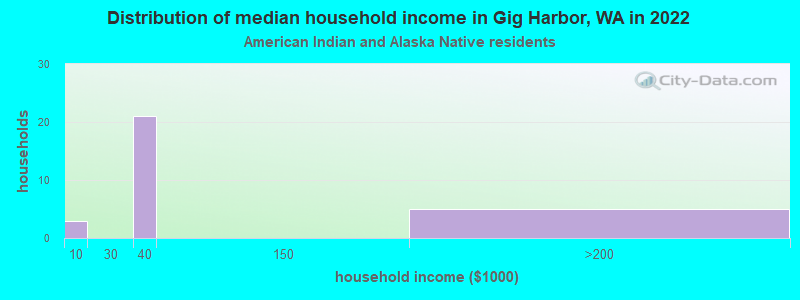
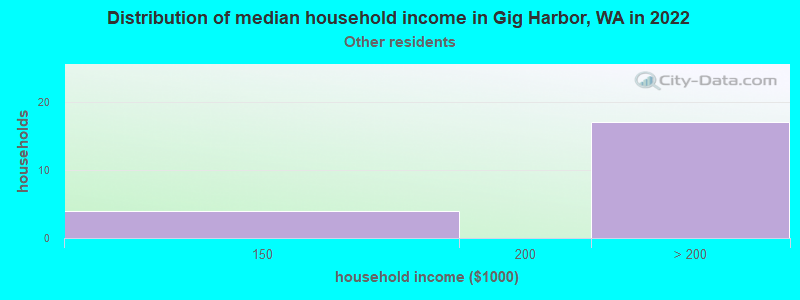
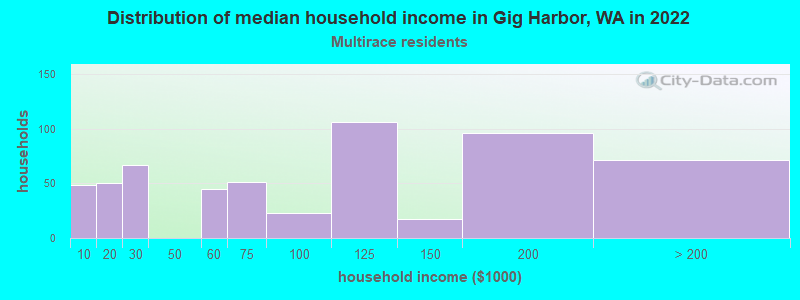
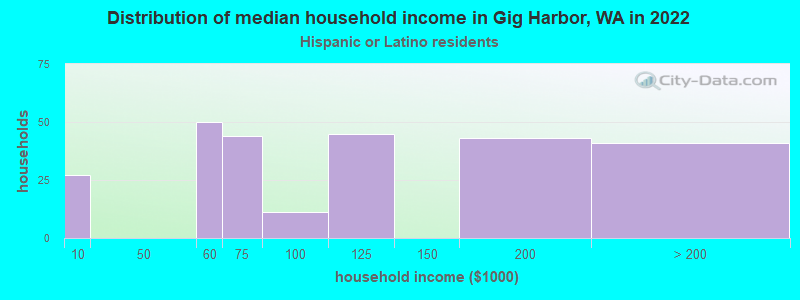
Income and house value in Gig Harbor Median household income in 2022 $105,016 White non-Hispanic householders$49,019 American Indian and Alaska Native householders$114,945 Asian householders$98,653 Two or more races householders$92,669 Hispanic or Latino race householdersMedian 2022 house value $884,036 White Non-Hispanic householders$656,397 Black or African American householders $810,196 Asian householders$813,052 Two or more races householders
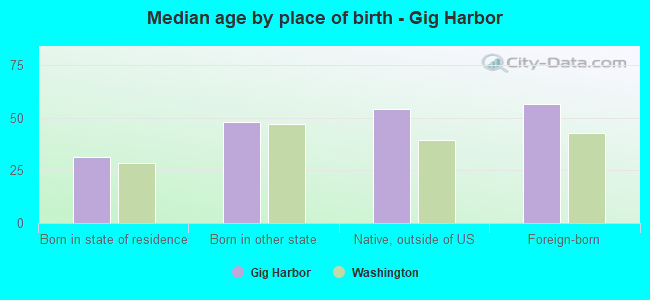
Median age by race in Gig Harbor
47.9 Median age for White residents46.8 51.3 65.7 Median age for Black or African American residents78.7 -716,122,650.1 26.8 Median age for American Indian / Alaska Native residents-622,057,000.6 25.8 47.3 Median age for Asian residents37.2 47.8 57.6 Median age for Native Hawaiian / Pacific Islander residents62.1 -634,538,152.0 42.3 Median age for Other race residents24.2 62.4 22.2 Median age for Two or more races residents17.2 25.9 47.5 Median age for White alone residents46.4 50.9 20.6 Median age for Hispanic or Latino residents12.7 31.3
Owner/renter occupied households by race in Gig Harbor
House owners and renters - White residents 2,502 60.3% Owner occupied1,644 39.7% Renter occupiedHouse owners and renters - Black or African American residents 13 100.0% Owner occupiedHouse owners and renters - American Indian / Alaska Native residents 4 19.6% Owner occupied16 80.4% Renter occupiedHouse owners and renters - Asian residents 185 75.6% Owner occupied59 24.4% Renter occupiedHouse owners and renters - Native Hawaiian / Pacific Islander residents 61 100.0% Renter occupiedHouse owners and renters - Other race residents 16 100.0% Renter occupiedHouse owners and renters - Two or more races residents 325 58.7% Owner occupied228 41.3% Renter occupiedHouse owners and renters - White alone residents 2,507 60.4% Owner occupied1,644 39.6% Renter occupiedHouse owners and renters - Hispanic or Latino residents 206 78.2% Owner occupied57 21.8% Renter occupied
Language usage in Gig Harbor
English speakers - Total 92.8% of residents of Gig Harbor speak English at home.
2.2% of residents speak Spanish at home 198 78.9% Speak English very well53 21.1% Speak English less than very well4.8% of residents speak other language at home 265 49.0% Speak English very well276 51.0% Speak English less than very well
English speakers - Born in the United States 97.6% of residents of Gig Harbor speak English at home.
1.3% of residents speak Spanish at home 74 100.0% Speak English very well1.1% of residents speak other language at home 29 46.0% Speak English very well34 54.0% Speak English less than very well
English speakers - Native, born elsewhere 65.0% of residents of Gig Harbor speak English at home.
10.4% of residents speak Spanish at home 17 100.0% Speak English very well26.4% of residents speak other language at home 7 16.3% Speak English very well36 83.7% Speak English less than very well
English speakers - Foreign-born 42.5% of residents of Gig Harbor speak English at home.
5.5% of residents speak Spanish at home 23 59.0% Speak English very well16 41.0% Speak English less than very well50.3% of residents speak other language at home 240 67.4% Speak English very well116 32.6% Speak English less than very well
White (Caucasian) - Speak only English Native:
99.3% (8,710)Foreign-born:
63.1% (196)
White (Caucasian) - Speak another language Native:
1.4% (120)Foreign-born:
30.3% (94)
Black or African American - Speak only English Native:
99.6% (48)Foreign-born:
52.8% (10)
Asian - Speak only English Native:
69.6% (89)Foreign-born:
17.4% (51)
Asian - Speak another language Native:
31.1% (40)Foreign-born:
81.6% (240)
Other race - Speak only English Native:
95.4% (65)Foreign-born:
100.0% (8)
Two or more races - Speak only English Native:
85.5% (1,107)Foreign-born:
11.9% (7)
Two or more races - Speak another language Native:
14.3% (185)Foreign-born:
87.6% (49)
White alone - Speak only English Native:
98.5% (8,693)Foreign-born:
60.4% (207)
White alone - Speak another language Native:
1.6% (144)Foreign-born:
28.1% (96)
Hispanic or Latino - Speak another language Native:
26.5% (135)Foreign-born:
100.0% (42)
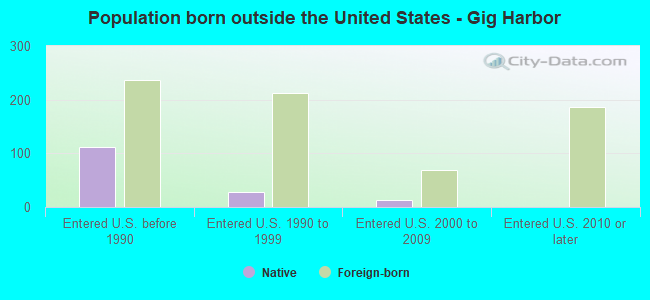
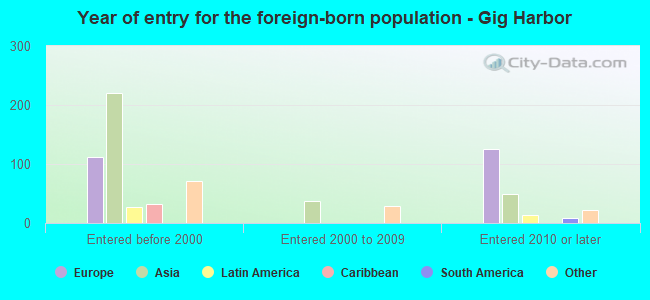
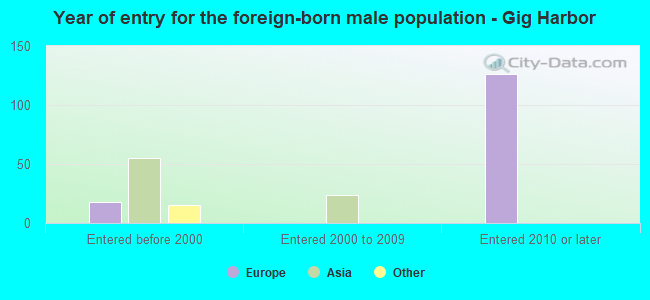
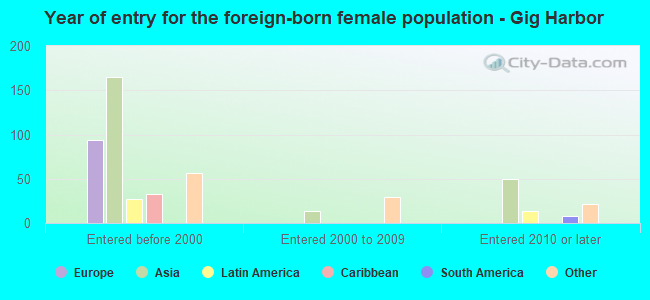
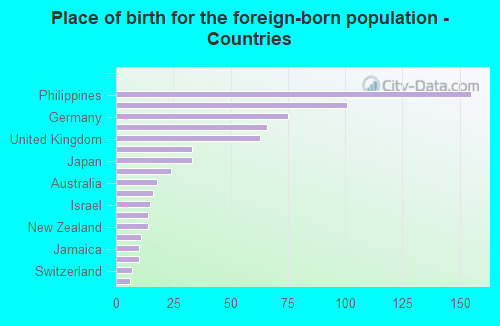
Foreign-born residents in Gig Harbor 686 residents are foreign born (2.4% Asia , 1.6% Europe , 0.8% North America ).
This city:
5.7%Washington:
14.9%
Marital status for residents in Gig Harbor Marital status - White (Caucasian) population 15 years and over
Males 17.1% Never married71.8% Now married0.7% Separated3.8% Widowed6.6% DivorcedFemales 18.0% Never married50.6% Now married0.2% Separated14.8% Widowed16.5% DivorcedWomen who gave birth in the past 12 months Now married:
100.0% (119)Unmarried:
0.0% (0)
Women who did not give birth in the past 12 months Now married:
49.9% (871)Unmarried:
50.1% (875)
Marital status - Black or African American population 15 years and over
Males 14.6% Never married85.4% Now married0.0% Separated0.0% Widowed0.0% DivorcedFemales 0.0% Never married43.5% Now married0.0% Separated0.0% Widowed56.5% DivorcedWomen who did not give birth in the past 12 months Now married:
100.0% (10)Unmarried:
0.0% (0)
Marital status - American Indian / Alaska Native population 15 years and over
Males 0.0% Never married0.0% Now married0.0% Separated0.0% Widowed100.0% DivorcedFemales 64.4% Never married17.8% Now married0.0% Separated0.0% Widowed17.8% DivorcedWomen who did not give birth in the past 12 months Now married:
0.0% (0)Unmarried:
100.0% (28)
Marital status - Asian population 15 years and over
Males 0.0% Never married59.0% Now married9.5% Separated0.0% Widowed31.4% DivorcedFemales 22.3% Never married51.9% Now married10.2% Separated13.3% Widowed2.3% DivorcedWomen who did not give birth in the past 12 months Now married:
86.4% (106)Unmarried:
13.6% (17)
Marital status - Other race population 15 years and over
Males 35.6% Never married35.6% Now married0.0% Separated0.0% Widowed28.9% DivorcedFemales 40.0% Never married44.0% Now married0.0% Separated16.0% Widowed0.0% DivorcedWomen who did not give birth in the past 12 months Now married:
0.0% (0)Unmarried:
100.0% (11)
Marital status - Two or more races population 15 years and over
Males 67.8% Never married32.2% Now married0.0% Separated0.0% Widowed0.0% DivorcedFemales 30.6% Never married57.0% Now married1.6% Separated3.9% Widowed6.9% DivorcedWomen who gave birth in the past 12 months Now married:
100.0% (53)Unmarried:
0.0% (0)
Women who did not give birth in the past 12 months Now married:
53.0% (212)Unmarried:
47.0% (188)
Marital status - White alone, not Hispanic / Latino population 15 years and over
Males 17.1% Never married71.8% Now married0.7% Separated3.8% Widowed6.6% DivorcedFemales 18.2% Never married50.4% Now married0.2% Separated15.0% Widowed16.3% DivorcedWomen who gave birth in the past 12 months Now married:
100.0% (123)Unmarried:
0.0% (0)
Women who did not give birth in the past 12 months Now married:
49.4% (879)Unmarried:
50.6% (899)
Marital status - Hispanic or Latino population 15 years and over
Males 20.7% Never married79.3% Now married0.0% Separated0.0% Widowed0.0% DivorcedFemales 5.4% Never married76.8% Now married0.0% Separated6.2% Widowed11.6% DivorcedWomen who gave birth in the past 12 months Now married:
100.0% (43)Unmarried:
0.0% (0)
Women who did not give birth in the past 12 months Now married:
85.0% (154)Unmarried:
15.0% (27)
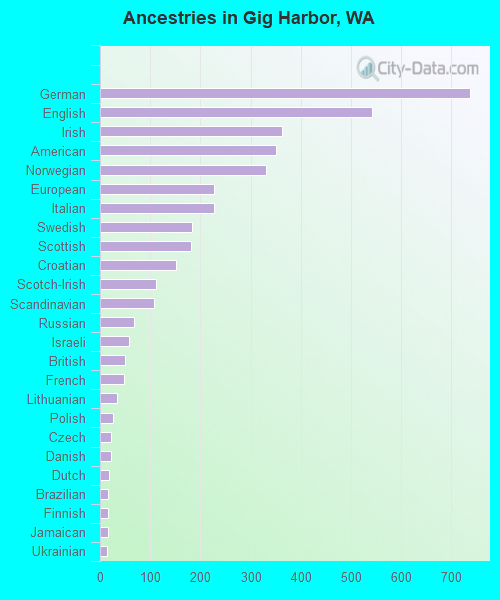
Ancestries in Gig Harbor
738 13.8% German542 10.2% English362 6.8% Irish351 6.6% American331 6.2% Norwegian228 4.3% European228 4.3% Italian183 3.4% Swedish182 3.4% Scottish151 2.8% Croatian112 2.1% Scotch-Irish107 2.0% Scandinavian68 1.3% Russian57 1.1% Israeli49 0.9% British48 0.9% French34 0.6% Lithuanian25 0.5% Polish21 0.4% Czech21 0.4% Danish18 0.3% Dutch16 0.3% Brazilian16 0.3% Finnish15 0.3% Jamaican14 0.3% Ukrainian12 0.2% Northern European8 0.1% French Canadian8 0.1% Slovak6 0.1% Swiss5 0.09% African
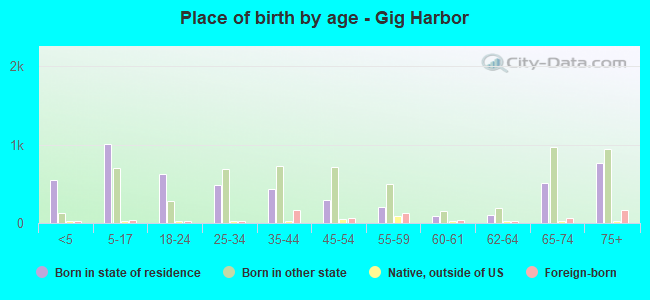
Children Nativity (place of birth) in Gig Harbor
Children under 6 years - Living with two parents Both parents native 538 100.0% NativeBoth parents foreign-born 64 100.0% NativeOne native, one foreign-born parent 68 100.0% NativeChildren under 6 years - Living with one parent Native parent 113 100.0% Native
Children 6 to 17 years - Living with two parents Both parents native 1,330 100.0% NativeBoth parents foreign-born 73 100.0% NativeOne native, one foreign-born parent 45 100.0% NativeChildren 6 to 17 years - Living with one parent Native parent 205 100.0% Native
Grandparents responsible for own grandchildren in Gig Harbor
Grandparents (30 to 59 years) Asian 52 100.0% Not responsible for grandchildren
Grandparents (60 years and over)