Races in Gladeview, Florida (FL) Detailed Stats
Data:
Races - White alone (%)
Races - White alone (% change since 2000)
Races - Black alone (%)
Races - Black alone (% change since 2000)
Races - American Indian alone (%)
Races - American Indian alone (% change since 2000)
Races - Asian alone (%)
Races - Asian alone (% change since 2000)
Races - Hispanic (%)
Races - Hispanic (% change since 2000)
Races - Native Hawaiian and Other Pacific Islander alone (%)
Races - Native Hawaiian and Other Pacific Islander alone (% change since 2000)
Races - Two or more races(%)
Races - Two or more races(% change since 2000)
Races - Other race alone (%)
Races - Other race alone (% change since 2000)
Racial diversity
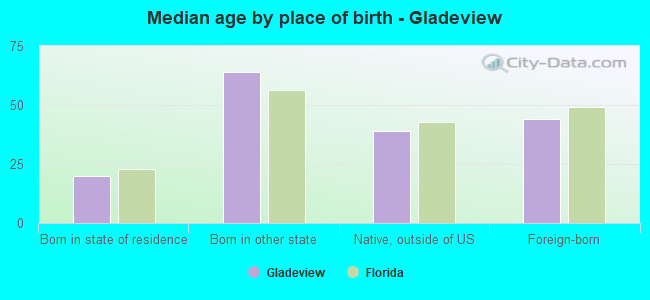
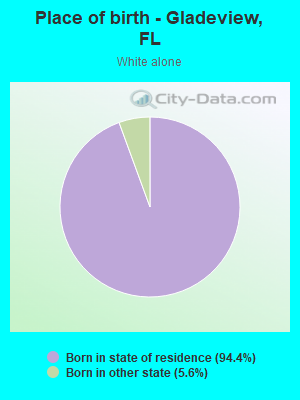
Place of birth - Born in state of residence (%)
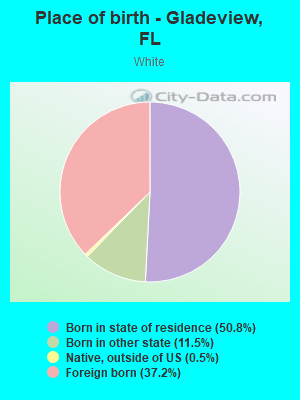
Place of birth - Born in state of residence (%) - White
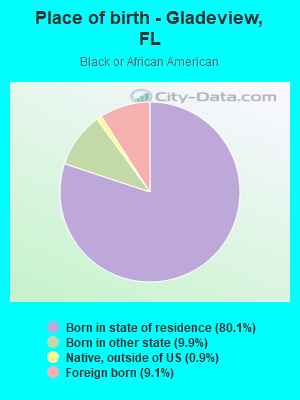
Place of birth - Born in state of residence (%) - Black or African American
Place of birth - Born in state of residence (%) - Asian
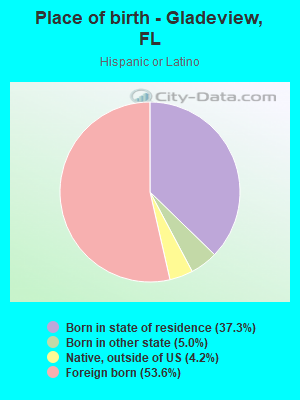
Place of birth - Born in state of residence (%) - Hispanic or Latino
Place of birth - Born in state of residence (%) - American Indian and Alaska Native
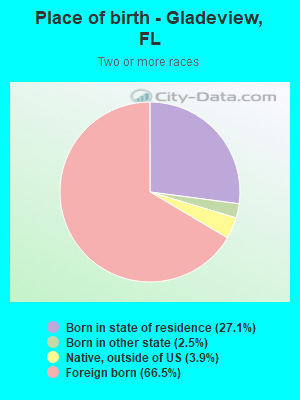
Place of birth - Born in state of residence (%) - Multirace
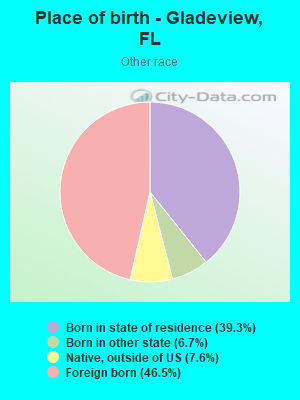
Place of birth - Born in state of residence (%) - Other Race
Place of birth - Born in other state (%)
Place of birth - Born in other state (%) - White
Place of birth - Born in other state (%) - Black or African American
Place of birth - Born in other state (%) - Asian
Place of birth - Born in other state (%) - Hispanic or Latino
Place of birth - Born in other state (%) - American Indian and Alaska Native
Place of birth - Born in other state (%) - Multirace
Place of birth - Born in other state (%) - Other Race
Place of birth - Native, outside of US (%)
Place of birth - Native, outside of US (%) - White
Place of birth - Native, outside of US (%) - Black or African American
Place of birth - Native, outside of US (%) - Asian
Place of birth - Native, outside of US (%) - Hispanic or Latino
Place of birth - Native, outside of US (%) - American Indian and Alaska Native
Place of birth - Native, outside of US (%) - Multirace
Place of birth - Native, outside of US (%) - Other Race
Place of birth - Foreign born (%)
Place of birth - Foreign born (%) - White
Place of birth - Foreign born (%) - Black or African American
Place of birth - Foreign born (%) - Asian
Place of birth - Foreign born (%) - Hispanic or Latino
Place of birth - Foreign born (%) - American Indian and Alaska Native
Place of birth - Foreign born (%) - Multirace
Place of birth - Foreign born (%) - Other Race
Residents speaking English at home (%)
Residents speaking English at home - Born in the United States (%)
Residents speaking English at home - Native, born elsewhere (%)
Residents speaking English at home - Foreign born (%)
Residents speaking Spanish at home (%)
Residents speaking Spanish at home - Born in the United States (%)
Residents speaking Spanish at home - Native, born elsewhere (%)
Residents speaking Spanish at home - Foreign born (%)
Residents speaking other language at home (%)
Residents speaking other language at home - Born in the United States (%)
Residents speaking other language at home - Native, born elsewhere (%)
Residents speaking other language at home - Foreign born (%)
Marital status - Never married (%)
Marital status - Now married (%)
Marital status - Separated (%)
Marital status - Widowed (%)
Marital status - Divorced (%)
Ancestries Reported - Arab (%)
Ancestries Reported - Czech (%)
Ancestries Reported - Danish (%)
Ancestries Reported - Dutch (%)
Ancestries Reported - English (%)
Ancestries Reported - French (%)
Ancestries Reported - French Canadian (%)
Ancestries Reported - German (%)
Ancestries Reported - Greek (%)
Ancestries Reported - Hungarian (%)
Ancestries Reported - Irish (%)
Ancestries Reported - Italian (%)
Ancestries Reported - Lithuanian (%)
Ancestries Reported - Norwegian (%)
Ancestries Reported - Polish (%)
Ancestries Reported - Portuguese (%)
Ancestries Reported - Russian (%)
Ancestries Reported - Scotch-Irish (%)
Ancestries Reported - Scottish (%)
Ancestries Reported - Slovak (%)
Ancestries Reported - Subsaharan African (%)
Ancestries Reported - Swedish (%)
Ancestries Reported - Swiss (%)
Ancestries Reported - Ukrainian (%)
Ancestries Reported - United States (%)
Ancestries Reported - Welsh (%)
Ancestries Reported - West Indian (%)
Ancestries Reported - Other (%)
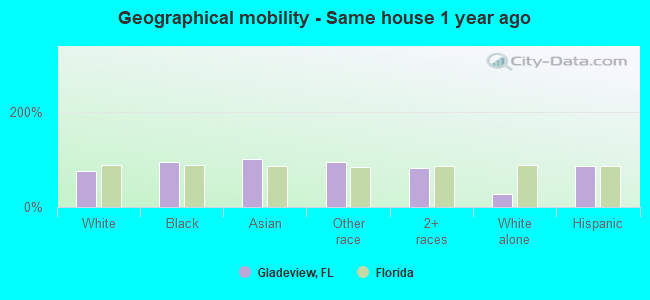
Geographical mobility - Same house 1 year ago (%)
Geographical mobility - Same house 1 year ago (%) - White
Geographical mobility - Same house 1 year ago (%) - Black or African American
Geographical mobility - Same house 1 year ago (%) - Asian
Geographical mobility - Same house 1 year ago (%) - Hispanic or Latino
Geographical mobility - Same house 1 year ago (%) - American Indian and Alaska Native
Geographical mobility - Same house 1 year ago (%) - Multirace
Geographical mobility - Same house 1 year ago (%) - Other Race
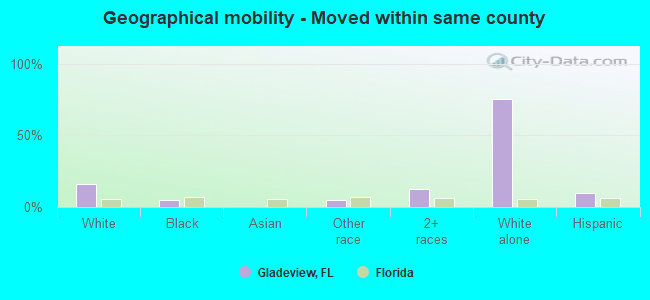
Geographical mobility - Moved within same county (%)
Geographical mobility - Moved within same county (%) - White
Geographical mobility - Moved within same county (%) - Black or African American
Geographical mobility - Moved within same county (%) - Asian
Geographical mobility - Moved within same county (%) - Hispanic or Latino
Geographical mobility - Moved within same county (%) - American Indian and Alaska Native
Geographical mobility - Moved within same county (%) - Multirace
Geographical mobility - Moved within same county (%) - Other Race
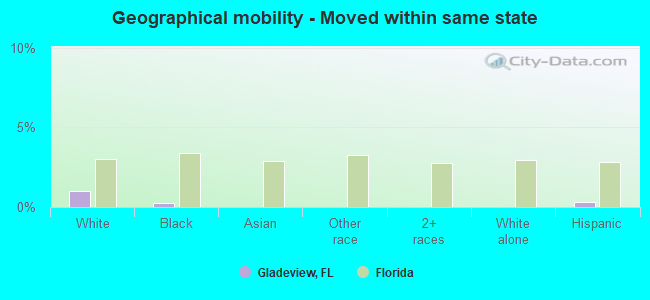
Geographical mobility - Moved from different county within same state (%)
Geographical mobility - Moved from different county within same state (%) - White
Geographical mobility - Moved from different county within same state (%) - Black or African American
Geographical mobility - Moved from different county within same state (%) - Asian
Geographical mobility - Moved from different county within same state (%) - Hispanic or Latino
Geographical mobility - Moved from different county within same state (%) - American Indian and Alaska Native
Geographical mobility - Moved from different county within same state (%) - Multirace
Geographical mobility - Moved from different county within same state (%) - Other Race
Geographical mobility - Moved from different state (%)
Geographical mobility - Moved from different state (%) - White
Geographical mobility - Moved from different state (%) - Black or African American
Geographical mobility - Moved from different state (%) - Asian
Geographical mobility - Moved from different state (%) - Hispanic or Latino
Geographical mobility - Moved from different state (%) - American Indian and Alaska Native
Geographical mobility - Moved from different state (%) - Multirace
Geographical mobility - Moved from different state (%) - Other Race
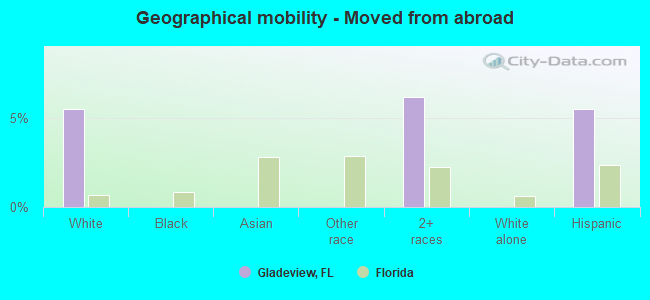
Geographical mobility - Moved from abroad (%)
Geographical mobility - Moved from abroad (%) - White
Geographical mobility - Moved from abroad (%) - Black or African American
Geographical mobility - Moved from abroad (%) - Asian
Geographical mobility - Moved from abroad (%) - Hispanic or Latino
Geographical mobility - Moved from abroad (%) - American Indian and Alaska Native
Geographical mobility - Moved from abroad (%) - Multirace
Geographical mobility - Moved from abroad (%) - Other Race
Place of birth for the foreign-born population - Ireland (%)
Place of birth for the foreign-born population - Denmark (%)
Place of birth for the foreign-born population - Norway (%)
Place of birth for the foreign-born population - Sweden (%)
Place of birth for the foreign-born population - United Kingdom (%)
Place of birth for the foreign-born population - England (%)
Place of birth for the foreign-born population - Scotland (%)
Place of birth for the foreign-born population - Other Northern Europe (%)
Place of birth for the foreign-born population - Austria (%)
Place of birth for the foreign-born population - Belgium (%)
Place of birth for the foreign-born population - France (%)
Place of birth for the foreign-born population - Germany (%)
Place of birth for the foreign-born population - Netherlands (%)
Place of birth for the foreign-born population - Switzerland (%)
Place of birth for the foreign-born population - Other Western Europe (%)
Place of birth for the foreign-born population - Greece (%)
Place of birth for the foreign-born population - Italy (%)
Place of birth for the foreign-born population - Portugal (%)
Place of birth for the foreign-born population - Spain (%)
Place of birth for the foreign-born population - Other Southern Europe (%)
Place of birth for the foreign-born population - Albania (%)
Place of birth for the foreign-born population - Belarus (%)
Place of birth for the foreign-born population - Bosnia and Herzegovina (%)
Place of birth for the foreign-born population - Bulgaria (%)
Place of birth for the foreign-born population - Croatia (%)
Place of birth for the foreign-born population - Czechoslovakia (%)
Place of birth for the foreign-born population - Hungary (%)
Place of birth for the foreign-born population - Latvia (%)
Place of birth for the foreign-born population - Lithuania (%)
Place of birth for the foreign-born population - North Macedonia (Macedonia) (%)
Place of birth for the foreign-born population - Moldova (%)
Place of birth for the foreign-born population - Poland (%)
Place of birth for the foreign-born population - Romania (%)
Place of birth for the foreign-born population - Russia (%)
Place of birth for the foreign-born population - Serbia (%)
Place of birth for the foreign-born population - Ukraine (%)
Place of birth for the foreign-born population - Other Eastern Europe (%)
Place of birth for the foreign-born population - China (%)
Place of birth for the foreign-born population - Hong Kong (%)
Place of birth for the foreign-born population - Taiwan (%)
Place of birth for the foreign-born population - Japan (%)
Place of birth for the foreign-born population - Korea (%)
Place of birth for the foreign-born population - Other Eastern Asia (%)
Place of birth for the foreign-born population - Afghanistan (%)
Place of birth for the foreign-born population - Bangladesh (%)
Place of birth for the foreign-born population - India (%)
Place of birth for the foreign-born population - Iran (%)
Place of birth for the foreign-born population - Kazakhstan (%)
Place of birth for the foreign-born population - Nepal (%)
Place of birth for the foreign-born population - Pakistan (%)
Place of birth for the foreign-born population - Sri Lanka (%)
Place of birth for the foreign-born population - Uzbekistan (%)
Place of birth for the foreign-born population - Other South Central Asia (%)
Place of birth for the foreign-born population - Burma (%)
Place of birth for the foreign-born population - Cambodia (%)
Place of birth for the foreign-born population - Indonesia (%)
Place of birth for the foreign-born population - Laos (%)
Place of birth for the foreign-born population - Malaysia (%)
Place of birth for the foreign-born population - Philippines (%)
Place of birth for the foreign-born population - Singapore (%)
Place of birth for the foreign-born population - Thailand (%)
Place of birth for the foreign-born population - Vietnam (%)
Place of birth for the foreign-born population - Other South Eastern Asia (%)
Place of birth for the foreign-born population - Armenia (%)
Place of birth for the foreign-born population - Iraq (%)
Place of birth for the foreign-born population - Israel (%)
Place of birth for the foreign-born population - Jordan (%)
Place of birth for the foreign-born population - Kuwait (%)
Place of birth for the foreign-born population - Lebanon (%)
Place of birth for the foreign-born population - Saudi Arabia (%)
Place of birth for the foreign-born population - Syria (%)
Place of birth for the foreign-born population - Turkey (%)
Place of birth for the foreign-born population - Yemen (%)
Place of birth for the foreign-born population - Other Western Asia (%)
Place of birth for the foreign-born population - Eritrea (%)
Place of birth for the foreign-born population - Ethiopia (%)
Place of birth for the foreign-born population - Kenya (%)
Place of birth for the foreign-born population - Somalia (%)
Place of birth for the foreign-born population - Uganda (%)
Place of birth for the foreign-born population - Zimbabwe (%)
Place of birth for the foreign-born population - Other Eastern Africa (%)
Place of birth for the foreign-born population - Cameroon (%)
Place of birth for the foreign-born population - Congo (%)
Place of birth for the foreign-born population - Democratic Republic of Congo (Zaire) (%)
Place of birth for the foreign-born population - Other Middle Africa (%)
Place of birth for the foreign-born population - Egypt (%)
Place of birth for the foreign-born population - Morocco (%)
Place of birth for the foreign-born population - Sudan (%)
Place of birth for the foreign-born population - Other Northern Africa (%)
Place of birth for the foreign-born population - South Africa (%)
Place of birth for the foreign-born population - Other Southern Africa (%)
Place of birth for the foreign-born population - Cabo Verde (%)
Place of birth for the foreign-born population - Ghana (%)
Place of birth for the foreign-born population - Liberia (%)
Place of birth for the foreign-born population - Nigeria (%)
Place of birth for the foreign-born population - Senegal (%)
Place of birth for the foreign-born population - Sierra Leone (%)
Place of birth for the foreign-born population - Other Western Africa (%)
Place of birth for the foreign-born population - Australia (%)
Place of birth for the foreign-born population - New Zealand (%)
Place of birth for the foreign-born population - Fiji (%)
Place of birth for the foreign-born population - Micronesia (%)
Place of birth for the foreign-born population - Bahamas (%)
Place of birth for the foreign-born population - Barbados (%)
Place of birth for the foreign-born population - Cuba (%)
Place of birth for the foreign-born population - Dominica (%)
Place of birth for the foreign-born population - Dominican Republic (%)
Place of birth for the foreign-born population - Grenada (%)
Place of birth for the foreign-born population - Haiti (%)
Place of birth for the foreign-born population - Jamaica (%)
Place of birth for the foreign-born population - St. Vincent and the Grenadines (%)
Place of birth for the foreign-born population - Trinidad and Tobago (%)
Place of birth for the foreign-born population - West Indies (%)
Place of birth for the foreign-born population - Other Caribbean (%)
Place of birth for the foreign-born population - Belize (%)
Place of birth for the foreign-born population - Costa Rica (%)
Place of birth for the foreign-born population - El Salvador (%)
Place of birth for the foreign-born population - Guatemala (%)
Place of birth for the foreign-born population - Honduras (%)
Place of birth for the foreign-born population - Mexico (%)
Place of birth for the foreign-born population - Nicaragua (%)
Place of birth for the foreign-born population - Panama (%)
Place of birth for the foreign-born population - Other Central America (%)
Place of birth for the foreign-born population - Argentina (%)
Place of birth for the foreign-born population - Bolivia (%)
Place of birth for the foreign-born population - Brazil (%)
Place of birth for the foreign-born population - Chile (%)
Place of birth for the foreign-born population - Colombia (%)
Place of birth for the foreign-born population - Ecuador (%)
Place of birth for the foreign-born population - Guyana (%)
Place of birth for the foreign-born population - Peru (%)
Place of birth for the foreign-born population - Uruguay (%)
Place of birth for the foreign-born population - Venezuela (%)
Place of birth for the foreign-born population - Other South America (%)
Place of birth for the foreign-born population - Canada (%)
Place of birth for the foreign-born population - Other Northern America (%)
Place of birth for the foreign-born population - Other (%)
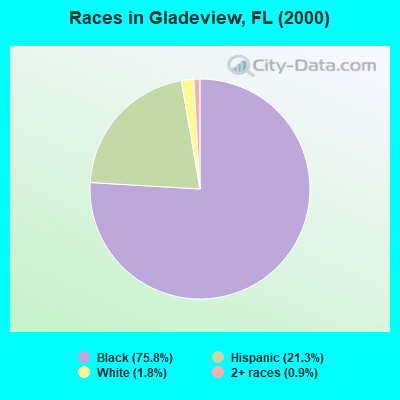
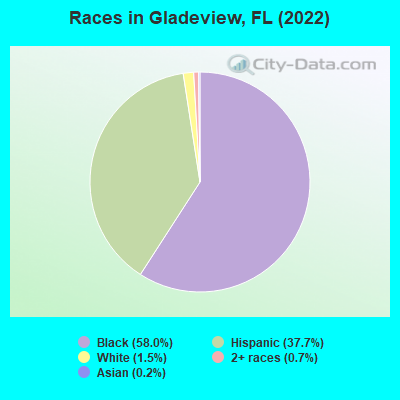
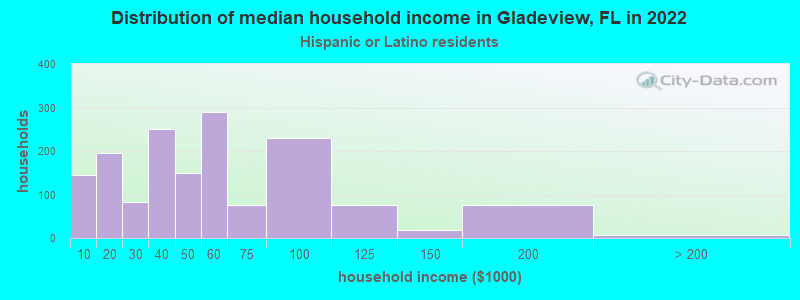
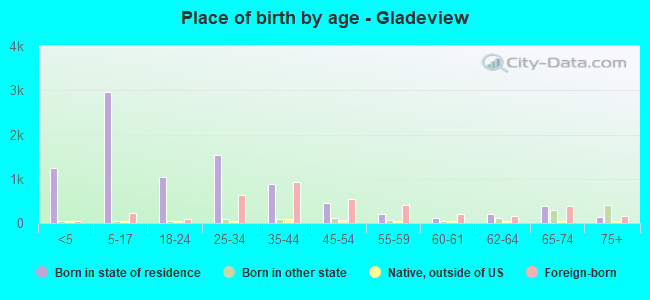
According to 2022 data, the most numerous races in Gladeview, FL are White alone (225 residents), Hispanic (5,508 residents), and Black alone (8,485 residents). 59.1% of Gladeview residents speak English at home. 25.7% of Gladeview, FL residents are foreign-born (25.4% born in Latin America), which is 18.2% greater than the foreign-born rate of 21.0% across the entire state of Florida.
Race distribution in Gladeview
2000 2022
10,458,509 65.4% White alone 2,682,715 16.8% Hispanic 2,264,268 14.2% Black alone 261,693 1.6% Asian alone 236,954 1.5% Two or more races 42,358 0.3% American Indian alone 28,994 0.2% Other race alone 6,887 0.04% Native Hawaiian and Other
11,309,403 50.8% White alone 6,025,039 27.1% Hispanic 3,241,015 14.6% Black alone 861,630 3.9% Two or more races 623,692 2.8% Asian alone 152,054 0.7% Other race alone 22,504 0.1% American Indian alone 9,486 0.04% Native Hawaiian and Other
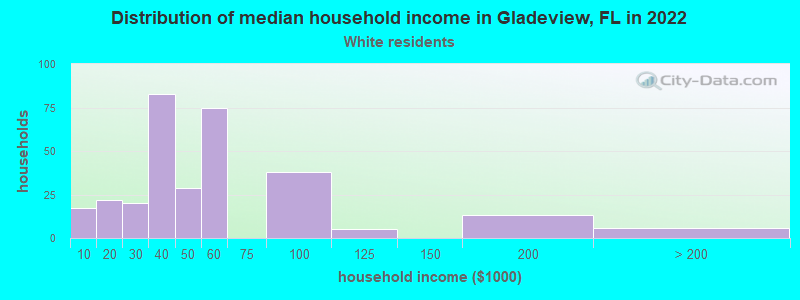
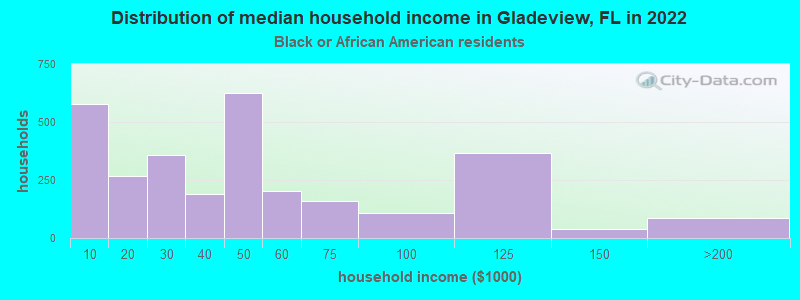
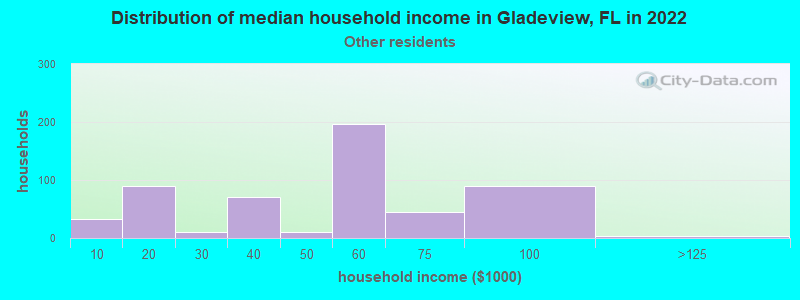
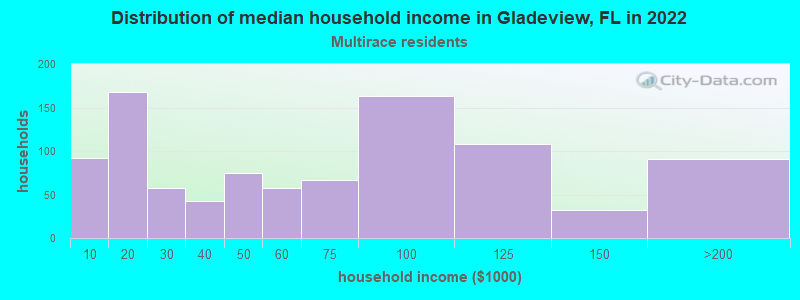
Income and house value in Gladeview Median household income in 2022 $2,650 White non-Hispanic householders$44,186 Black householders$56,208 Some other race householders$56,430 Two or more races householders$50,089 Hispanic or Latino race householdersMedian 2022 house value over $1,000,000 White Non-Hispanic householders$291,878 Black or African American householders$863,206 American Indian or Alaska Native householders $437,357 Asian householders$207,169 Two or more races householders$320,422 Hispanic or Latino householders
Median age by race in Gladeview
26.1 Median age for White residents22.0 30.8 29.9 Median age for Black or African American residents25.4 34.9 -653,446,647.1 Median age for American Indian / Alaska Native residents-543,352,600.6 -762,696,213.5 -673,333,332.7 Median age for Asian residents-697,674,417.9 -653,626,731.2 -679,849,340.2 Median age for Native Hawaiian / Pacific Islander residents-858,307,848.3 -443,298,968.6 31.2 Median age for Other race residents30.0 30.9 39.1 Median age for Two or more races residents40.5 37.1 14.9 Median age for White alone residents14.8 19.1 34.1 Median age for Hispanic or Latino residents32.9 34.6
Owner/renter occupied households by race in Gladeview
House owners and renters - White residents 136 41.2% Owner occupied195 58.8% Renter occupiedHouse owners and renters - Black or African American residents 818 26.2% Owner occupied2,299 73.8% Renter occupiedHouse owners and renters - Asian residents 14 100.0% Owner occupiedHouse owners and renters - Other race residents 110 19.7% Owner occupied450 80.3% Renter occupiedHouse owners and renters - Two or more races residents 454 47.3% Owner occupied505 52.7% Renter occupiedHouse owners and renters - White alone residents 46 100.0% Renter occupiedHouse owners and renters - Hispanic or Latino residents 623 39.1% Owner occupied972 60.9% Renter occupied
Language usage in Gladeview
English speakers - Total 59.1% of residents of Gladeview speak English at home.
36.4% of residents speak Spanish at home 2,497 51.6% Speak English very well2,339 48.4% Speak English less than very well4.8% of residents speak other language at home 500 78.7% Speak English very well135 21.3% Speak English less than very well
English speakers - Born in the United States 73.5% of residents of Gladeview speak English at home.
24.0% of residents speak Spanish at home 269 89.1% Speak English very well33 10.9% Speak English less than very well2.1% of residents speak other language at home 27 100.0% Speak English very well
English speakers - Native, born elsewhere 31.5% of residents of Gladeview speak English at home.
69.5% of residents speak Spanish at home 140 66.7% Speak English very well70 33.3% Speak English less than very well
English speakers - Foreign-born 18.8% of residents of Gladeview speak English at home.
75.8% of residents speak Spanish at home 968 34.3% Speak English very well1,855 65.7% Speak English less than very well5.9% of residents speak other language at home 129 58.9% Speak English very well90 41.1% Speak English less than very well
White (Caucasian) - Speak only English Native:
15.1% (100)Foreign-born:
1.9% (8)
White (Caucasian) - Speak another language Native:
70.9% (471)Foreign-born:
95.3% (404)
Black or African American - Speak only English Native:
92.7% (6,560)Foreign-born:
69.0% (537)
Black or African American - Speak another language Native:
7.3% (517)Foreign-born:
35.2% (275)
Other race - Speak another language Native:
99.8% (845)Foreign-born:
96.8% (828)
Two or more races - Speak only English Native:
14.7% (127)Foreign-born:
6.9% (140)
Two or more races - Speak another language Native:
85.5% (742)Foreign-born:
93.4% (1,889)
Hispanic or Latino - Speak only English Native:
16.2% (357)Foreign-born:
3.4% (98)
Hispanic or Latino - Speak another language Native:
83.7% (1,842)Foreign-born:
96.6% (2,825)
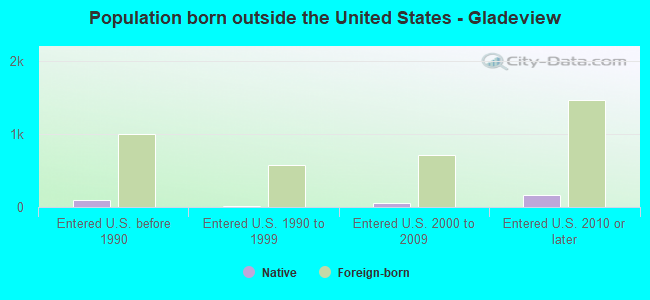
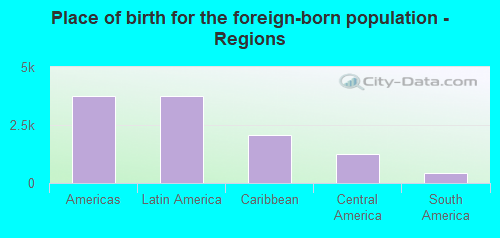
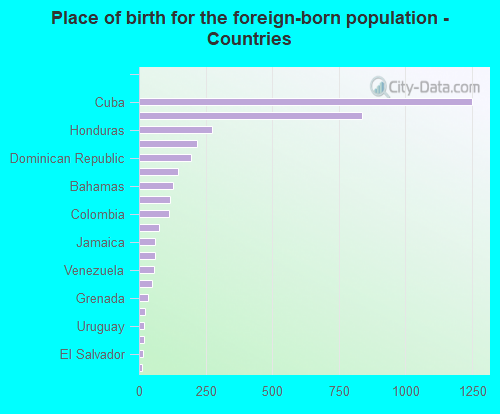
Foreign-born residents in Gladeview 3,751 residents are foreign born (25.4% Latin America ).
This city:
25.7%Florida:
21.1%
Marital status for residents in Gladeview Marital status - White (Caucasian) population 15 years and over
Males 25.1% Never married59.6% Now married6.2% Separated1.9% Widowed7.2% DivorcedFemales 31.5% Never married46.8% Now married1.3% Separated2.6% Widowed17.8% DivorcedWomen who did not give birth in the past 12 months Now married:
51.5% (154)Unmarried:
48.5% (146)
Marital status - Black or African American population 15 years and over
Males 69.9% Never married16.1% Now married2.7% Separated9.5% Widowed1.8% DivorcedFemales 65.2% Never married12.3% Now married3.4% Separated6.1% Widowed13.0% DivorcedWomen who gave birth in the past 12 months Now married:
22.6% (60)Unmarried:
77.4% (206)
Women who did not give birth in the past 12 months Now married:
13.1% (253)Unmarried:
86.9% (1,672)
Marital status - Asian population 15 years and over
Males 0.0% Never married100.0% Now married0.0% Separated0.0% Widowed0.0% DivorcedFemales 0.0% Never married100.0% Now married0.0% Separated0.0% Widowed0.0% DivorcedMarital status - Other race population 15 years and over
Males 7.4% Never married74.6% Now married3.3% Separated8.9% Widowed5.8% DivorcedFemales 36.5% Never married50.5% Now married0.0% Separated2.3% Widowed10.7% DivorcedWomen who did not give birth in the past 12 months Now married:
50.3% (265)Unmarried:
49.7% (262)
Marital status - Two or more races population 15 years and over
Males 41.7% Never married28.0% Now married14.5% Separated11.0% Widowed4.7% DivorcedFemales 44.2% Never married25.3% Now married0.9% Separated6.5% Widowed23.1% DivorcedWomen who gave birth in the past 12 months Now married:
66.0% (56)Unmarried:
34.0% (29)
Women who did not give birth in the past 12 months Now married:
14.2% (81)Unmarried:
85.8% (490)
Marital status - White alone, not Hispanic / Latino population 15 years and over
Males 100.0% Never married0.0% Now married0.0% Separated0.0% Widowed0.0% DivorcedFemales 100.0% Never married0.0% Now married0.0% Separated0.0% Widowed0.0% DivorcedWomen who did not give birth in the past 12 months Now married:
0.0% (0)Unmarried:
100.0% (43)
Marital status - Hispanic or Latino population 15 years and over
Males 27.2% Never married51.1% Now married8.8% Separated7.0% Widowed5.8% DivorcedFemales 37.2% Never married41.1% Now married0.8% Separated4.0% Widowed16.9% DivorcedWomen who gave birth in the past 12 months Now married:
66.0% (34)Unmarried:
34.0% (18)
Women who did not give birth in the past 12 months Now married:
44.2% (568)Unmarried:
55.8% (718)
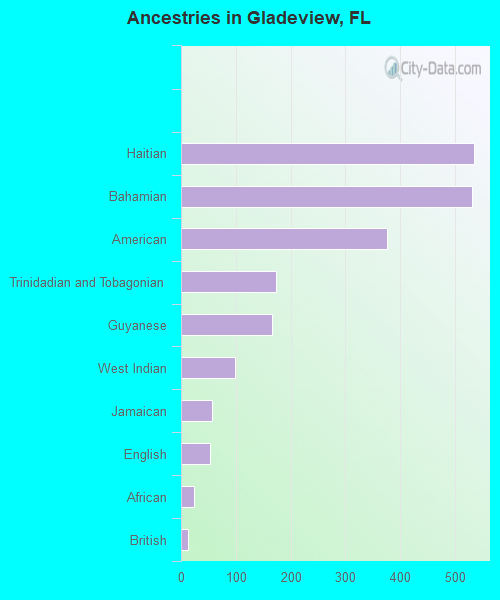
Ancestries in Gladeview
535 4.9% Haitian530 4.9% Bahamian376 3.5% American174 1.6% Trinidadian and Tobagonian166 1.5% Guyanese98 0.9% West Indian57 0.5% Jamaican53 0.5% English24 0.2% African13 0.1% British
Children Nativity (place of birth) in Gladeview
Children under 6 years - Living with two parents Both parents foreign-born 122 100.0% NativeOne native, one foreign-born parent 654 100.0% NativeChildren under 6 years - Living with one parent Native parent 783 99.8% Native1 0.2% Foreign-bornForeign-born parent 174 84.4% Native32 15.6% Foreign-bornChildren 6 to 17 years - Living with two parents Both parents native 142 100.0% NativeBoth parents foreign-born 199 77.4% Native58 22.6% Foreign-bornOne native, one foreign-born parent 161 80.2% Native40 19.8% Foreign-bornChildren 6 to 17 years - Living with one parent Native parent 900 100.0% NativeForeign-born parent 1,057 54.2% Native894 45.8% Foreign-born
Grandparents responsible for own grandchildren in Gladeview
Grandparents (30 to 59 years) White / Caucasian 15 100.0% Not responsible for grandchildrenBlack or African American 52 55.7% Responsible for grandchildren41 44.3% Not responsible for grandchildrenTwo or more races 123 69.4% Responsible for grandchildren54 30.6% Not responsible for grandchildrenHispanic or Latino 65 55.7% Responsible for grandchildren52 44.3% Not responsible for grandchildrenGrandparents (60 years and over) White / Caucasian 13 100.0% Not responsible for grandchildrenBlack or African American 151 54.3% Responsible for grandchildren127 45.7% Not responsible for grandchildrenTwo or more races 16 100.0% Not responsible for grandchildrenHispanic or Latino 26 100.0% Not responsible for grandchildren