Races in Glen Ellyn, Illinois (IL) Detailed Stats
Data:
Races - White alone (%)
Races - White alone (% change since 2000)
Races - Black alone (%)
Races - Black alone (% change since 2000)
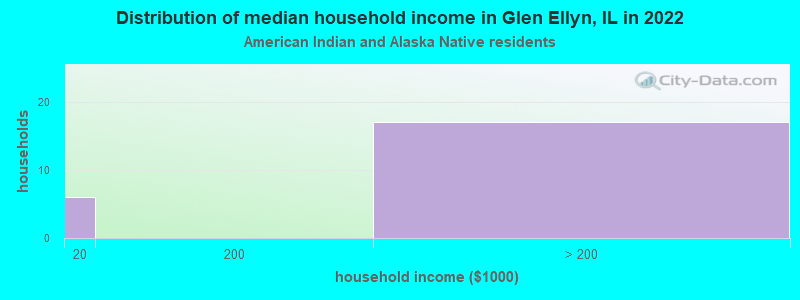
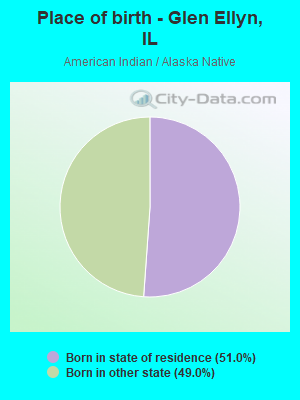
Races - American Indian alone (%)
Races - American Indian alone (% change since 2000)
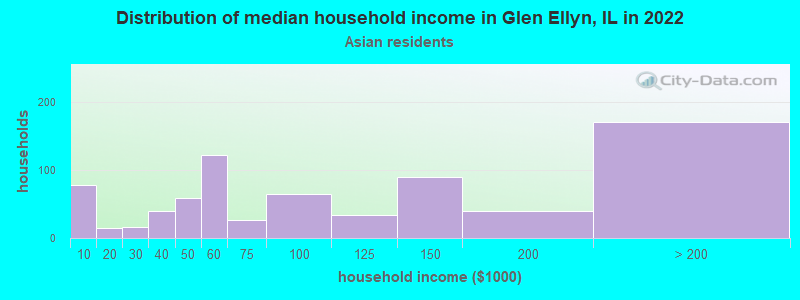
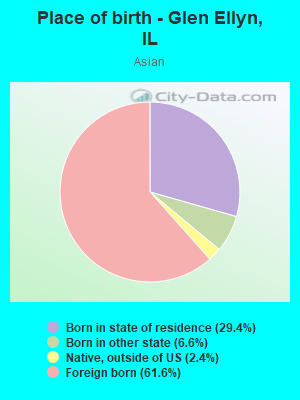
Races - Asian alone (%)
Races - Asian alone (% change since 2000)
Races - Hispanic (%)
Races - Hispanic (% change since 2000)
Races - Native Hawaiian and Other Pacific Islander alone (%)
Races - Native Hawaiian and Other Pacific Islander alone (% change since 2000)
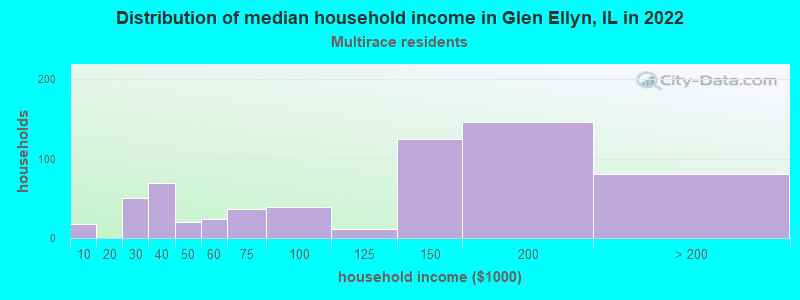
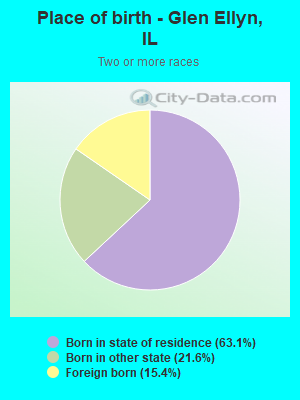
Races - Two or more races(%)
Races - Two or more races(% change since 2000)
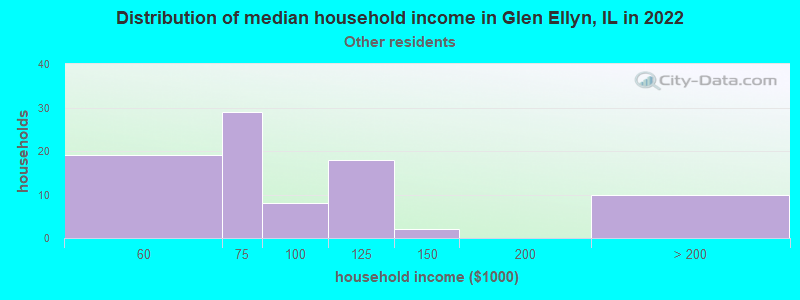
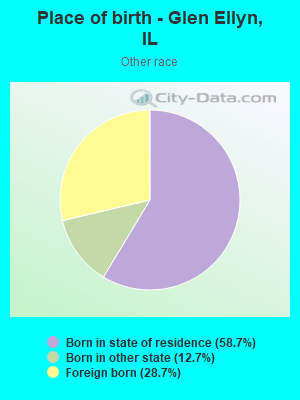
Races - Other race alone (%)
Races - Other race alone (% change since 2000)
Racial diversity
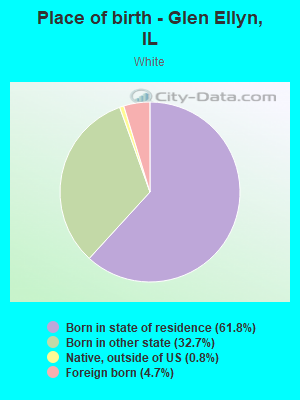
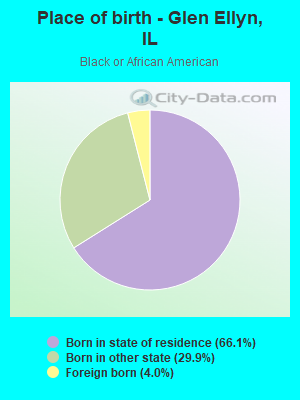
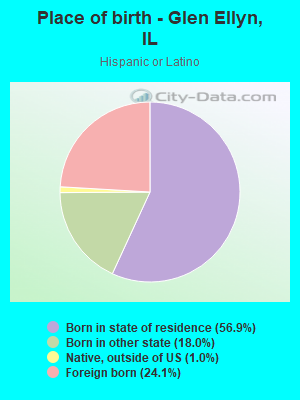
Place of birth - Born in state of residence (%)
Place of birth - Born in state of residence (%) - White
Place of birth - Born in state of residence (%) - Black or African American
Place of birth - Born in state of residence (%) - Asian
Place of birth - Born in state of residence (%) - Hispanic or Latino
Place of birth - Born in state of residence (%) - American Indian and Alaska Native
Place of birth - Born in state of residence (%) - Multirace
Place of birth - Born in state of residence (%) - Other Race
Place of birth - Born in other state (%)
Place of birth - Born in other state (%) - White
Place of birth - Born in other state (%) - Black or African American
Place of birth - Born in other state (%) - Asian
Place of birth - Born in other state (%) - Hispanic or Latino
Place of birth - Born in other state (%) - American Indian and Alaska Native
Place of birth - Born in other state (%) - Multirace
Place of birth - Born in other state (%) - Other Race
Place of birth - Native, outside of US (%)
Place of birth - Native, outside of US (%) - White
Place of birth - Native, outside of US (%) - Black or African American
Place of birth - Native, outside of US (%) - Asian
Place of birth - Native, outside of US (%) - Hispanic or Latino
Place of birth - Native, outside of US (%) - American Indian and Alaska Native
Place of birth - Native, outside of US (%) - Multirace
Place of birth - Native, outside of US (%) - Other Race
Place of birth - Foreign born (%)
Place of birth - Foreign born (%) - White
Place of birth - Foreign born (%) - Black or African American
Place of birth - Foreign born (%) - Asian
Place of birth - Foreign born (%) - Hispanic or Latino
Place of birth - Foreign born (%) - American Indian and Alaska Native
Place of birth - Foreign born (%) - Multirace
Place of birth - Foreign born (%) - Other Race
Residents speaking English at home (%)
Residents speaking English at home - Born in the United States (%)
Residents speaking English at home - Native, born elsewhere (%)
Residents speaking English at home - Foreign born (%)
Residents speaking Spanish at home (%)
Residents speaking Spanish at home - Born in the United States (%)
Residents speaking Spanish at home - Native, born elsewhere (%)
Residents speaking Spanish at home - Foreign born (%)
Residents speaking other language at home (%)
Residents speaking other language at home - Born in the United States (%)
Residents speaking other language at home - Native, born elsewhere (%)
Residents speaking other language at home - Foreign born (%)
Marital status - Never married (%)
Marital status - Now married (%)
Marital status - Separated (%)
Marital status - Widowed (%)
Marital status - Divorced (%)
Ancestries Reported - Arab (%)
Ancestries Reported - Czech (%)
Ancestries Reported - Danish (%)
Ancestries Reported - Dutch (%)
Ancestries Reported - English (%)
Ancestries Reported - French (%)
Ancestries Reported - French Canadian (%)
Ancestries Reported - German (%)
Ancestries Reported - Greek (%)
Ancestries Reported - Hungarian (%)
Ancestries Reported - Irish (%)
Ancestries Reported - Italian (%)
Ancestries Reported - Lithuanian (%)
Ancestries Reported - Norwegian (%)
Ancestries Reported - Polish (%)
Ancestries Reported - Portuguese (%)
Ancestries Reported - Russian (%)
Ancestries Reported - Scotch-Irish (%)
Ancestries Reported - Scottish (%)
Ancestries Reported - Slovak (%)
Ancestries Reported - Subsaharan African (%)
Ancestries Reported - Swedish (%)
Ancestries Reported - Swiss (%)
Ancestries Reported - Ukrainian (%)
Ancestries Reported - United States (%)
Ancestries Reported - Welsh (%)
Ancestries Reported - West Indian (%)
Ancestries Reported - Other (%)
Geographical mobility - Same house 1 year ago (%)
Geographical mobility - Same house 1 year ago (%) - White
Geographical mobility - Same house 1 year ago (%) - Black or African American
Geographical mobility - Same house 1 year ago (%) - Asian
Geographical mobility - Same house 1 year ago (%) - Hispanic or Latino
Geographical mobility - Same house 1 year ago (%) - American Indian and Alaska Native
Geographical mobility - Same house 1 year ago (%) - Multirace
Geographical mobility - Same house 1 year ago (%) - Other Race
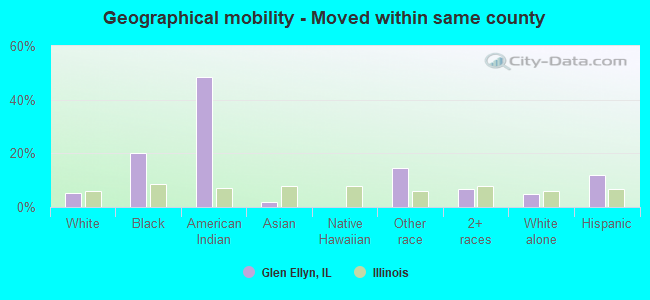
Geographical mobility - Moved within same county (%)
Geographical mobility - Moved within same county (%) - White
Geographical mobility - Moved within same county (%) - Black or African American
Geographical mobility - Moved within same county (%) - Asian
Geographical mobility - Moved within same county (%) - Hispanic or Latino
Geographical mobility - Moved within same county (%) - American Indian and Alaska Native
Geographical mobility - Moved within same county (%) - Multirace
Geographical mobility - Moved within same county (%) - Other Race
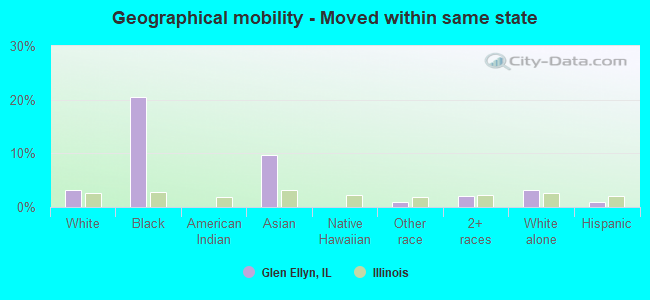
Geographical mobility - Moved from different county within same state (%)
Geographical mobility - Moved from different county within same state (%) - White
Geographical mobility - Moved from different county within same state (%) - Black or African American
Geographical mobility - Moved from different county within same state (%) - Asian
Geographical mobility - Moved from different county within same state (%) - Hispanic or Latino
Geographical mobility - Moved from different county within same state (%) - American Indian and Alaska Native
Geographical mobility - Moved from different county within same state (%) - Multirace
Geographical mobility - Moved from different county within same state (%) - Other Race
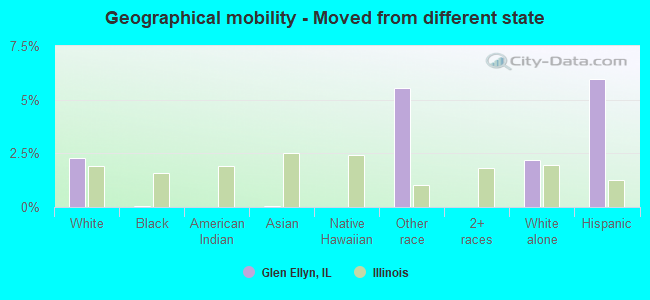
Geographical mobility - Moved from different state (%)
Geographical mobility - Moved from different state (%) - White
Geographical mobility - Moved from different state (%) - Black or African American
Geographical mobility - Moved from different state (%) - Asian
Geographical mobility - Moved from different state (%) - Hispanic or Latino
Geographical mobility - Moved from different state (%) - American Indian and Alaska Native
Geographical mobility - Moved from different state (%) - Multirace
Geographical mobility - Moved from different state (%) - Other Race
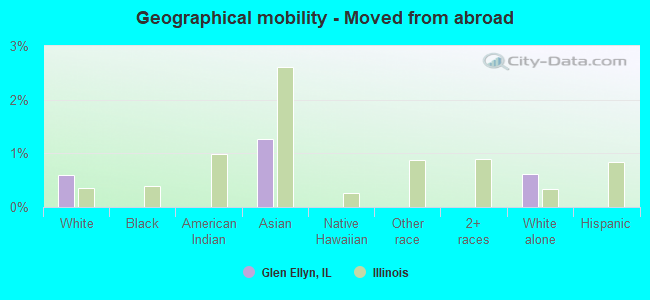
Geographical mobility - Moved from abroad (%)
Geographical mobility - Moved from abroad (%) - White
Geographical mobility - Moved from abroad (%) - Black or African American
Geographical mobility - Moved from abroad (%) - Asian
Geographical mobility - Moved from abroad (%) - Hispanic or Latino
Geographical mobility - Moved from abroad (%) - American Indian and Alaska Native
Geographical mobility - Moved from abroad (%) - Multirace
Geographical mobility - Moved from abroad (%) - Other Race
Place of birth for the foreign-born population - Ireland (%)
Place of birth for the foreign-born population - Denmark (%)
Place of birth for the foreign-born population - Norway (%)
Place of birth for the foreign-born population - Sweden (%)
Place of birth for the foreign-born population - United Kingdom (%)
Place of birth for the foreign-born population - England (%)
Place of birth for the foreign-born population - Scotland (%)
Place of birth for the foreign-born population - Other Northern Europe (%)
Place of birth for the foreign-born population - Austria (%)
Place of birth for the foreign-born population - Belgium (%)
Place of birth for the foreign-born population - France (%)
Place of birth for the foreign-born population - Germany (%)
Place of birth for the foreign-born population - Netherlands (%)
Place of birth for the foreign-born population - Switzerland (%)
Place of birth for the foreign-born population - Other Western Europe (%)
Place of birth for the foreign-born population - Greece (%)
Place of birth for the foreign-born population - Italy (%)
Place of birth for the foreign-born population - Portugal (%)
Place of birth for the foreign-born population - Spain (%)
Place of birth for the foreign-born population - Other Southern Europe (%)
Place of birth for the foreign-born population - Albania (%)
Place of birth for the foreign-born population - Belarus (%)
Place of birth for the foreign-born population - Bosnia and Herzegovina (%)
Place of birth for the foreign-born population - Bulgaria (%)
Place of birth for the foreign-born population - Croatia (%)
Place of birth for the foreign-born population - Czechoslovakia (%)
Place of birth for the foreign-born population - Hungary (%)
Place of birth for the foreign-born population - Latvia (%)
Place of birth for the foreign-born population - Lithuania (%)
Place of birth for the foreign-born population - North Macedonia (Macedonia) (%)
Place of birth for the foreign-born population - Moldova (%)
Place of birth for the foreign-born population - Poland (%)
Place of birth for the foreign-born population - Romania (%)
Place of birth for the foreign-born population - Russia (%)
Place of birth for the foreign-born population - Serbia (%)
Place of birth for the foreign-born population - Ukraine (%)
Place of birth for the foreign-born population - Other Eastern Europe (%)
Place of birth for the foreign-born population - China (%)
Place of birth for the foreign-born population - Hong Kong (%)
Place of birth for the foreign-born population - Taiwan (%)
Place of birth for the foreign-born population - Japan (%)
Place of birth for the foreign-born population - Korea (%)
Place of birth for the foreign-born population - Other Eastern Asia (%)
Place of birth for the foreign-born population - Afghanistan (%)
Place of birth for the foreign-born population - Bangladesh (%)
Place of birth for the foreign-born population - India (%)
Place of birth for the foreign-born population - Iran (%)
Place of birth for the foreign-born population - Kazakhstan (%)
Place of birth for the foreign-born population - Nepal (%)
Place of birth for the foreign-born population - Pakistan (%)
Place of birth for the foreign-born population - Sri Lanka (%)
Place of birth for the foreign-born population - Uzbekistan (%)
Place of birth for the foreign-born population - Other South Central Asia (%)
Place of birth for the foreign-born population - Burma (%)
Place of birth for the foreign-born population - Cambodia (%)
Place of birth for the foreign-born population - Indonesia (%)
Place of birth for the foreign-born population - Laos (%)
Place of birth for the foreign-born population - Malaysia (%)
Place of birth for the foreign-born population - Philippines (%)
Place of birth for the foreign-born population - Singapore (%)
Place of birth for the foreign-born population - Thailand (%)
Place of birth for the foreign-born population - Vietnam (%)
Place of birth for the foreign-born population - Other South Eastern Asia (%)
Place of birth for the foreign-born population - Armenia (%)
Place of birth for the foreign-born population - Iraq (%)
Place of birth for the foreign-born population - Israel (%)
Place of birth for the foreign-born population - Jordan (%)
Place of birth for the foreign-born population - Kuwait (%)
Place of birth for the foreign-born population - Lebanon (%)
Place of birth for the foreign-born population - Saudi Arabia (%)
Place of birth for the foreign-born population - Syria (%)
Place of birth for the foreign-born population - Turkey (%)
Place of birth for the foreign-born population - Yemen (%)
Place of birth for the foreign-born population - Other Western Asia (%)
Place of birth for the foreign-born population - Eritrea (%)
Place of birth for the foreign-born population - Ethiopia (%)
Place of birth for the foreign-born population - Kenya (%)
Place of birth for the foreign-born population - Somalia (%)
Place of birth for the foreign-born population - Uganda (%)
Place of birth for the foreign-born population - Zimbabwe (%)
Place of birth for the foreign-born population - Other Eastern Africa (%)
Place of birth for the foreign-born population - Cameroon (%)
Place of birth for the foreign-born population - Congo (%)
Place of birth for the foreign-born population - Democratic Republic of Congo (Zaire) (%)
Place of birth for the foreign-born population - Other Middle Africa (%)
Place of birth for the foreign-born population - Egypt (%)
Place of birth for the foreign-born population - Morocco (%)
Place of birth for the foreign-born population - Sudan (%)
Place of birth for the foreign-born population - Other Northern Africa (%)
Place of birth for the foreign-born population - South Africa (%)
Place of birth for the foreign-born population - Other Southern Africa (%)
Place of birth for the foreign-born population - Cabo Verde (%)
Place of birth for the foreign-born population - Ghana (%)
Place of birth for the foreign-born population - Liberia (%)
Place of birth for the foreign-born population - Nigeria (%)
Place of birth for the foreign-born population - Senegal (%)
Place of birth for the foreign-born population - Sierra Leone (%)
Place of birth for the foreign-born population - Other Western Africa (%)
Place of birth for the foreign-born population - Australia (%)
Place of birth for the foreign-born population - New Zealand (%)
Place of birth for the foreign-born population - Fiji (%)
Place of birth for the foreign-born population - Micronesia (%)
Place of birth for the foreign-born population - Bahamas (%)
Place of birth for the foreign-born population - Barbados (%)
Place of birth for the foreign-born population - Cuba (%)
Place of birth for the foreign-born population - Dominica (%)
Place of birth for the foreign-born population - Dominican Republic (%)
Place of birth for the foreign-born population - Grenada (%)
Place of birth for the foreign-born population - Haiti (%)
Place of birth for the foreign-born population - Jamaica (%)
Place of birth for the foreign-born population - St. Vincent and the Grenadines (%)
Place of birth for the foreign-born population - Trinidad and Tobago (%)
Place of birth for the foreign-born population - West Indies (%)
Place of birth for the foreign-born population - Other Caribbean (%)
Place of birth for the foreign-born population - Belize (%)
Place of birth for the foreign-born population - Costa Rica (%)
Place of birth for the foreign-born population - El Salvador (%)
Place of birth for the foreign-born population - Guatemala (%)
Place of birth for the foreign-born population - Honduras (%)
Place of birth for the foreign-born population - Mexico (%)
Place of birth for the foreign-born population - Nicaragua (%)
Place of birth for the foreign-born population - Panama (%)
Place of birth for the foreign-born population - Other Central America (%)
Place of birth for the foreign-born population - Argentina (%)
Place of birth for the foreign-born population - Bolivia (%)
Place of birth for the foreign-born population - Brazil (%)
Place of birth for the foreign-born population - Chile (%)
Place of birth for the foreign-born population - Colombia (%)
Place of birth for the foreign-born population - Ecuador (%)
Place of birth for the foreign-born population - Guyana (%)
Place of birth for the foreign-born population - Peru (%)
Place of birth for the foreign-born population - Uruguay (%)
Place of birth for the foreign-born population - Venezuela (%)
Place of birth for the foreign-born population - Other South America (%)
Place of birth for the foreign-born population - Canada (%)
Place of birth for the foreign-born population - Other Northern America (%)
Place of birth for the foreign-born population - Other (%)
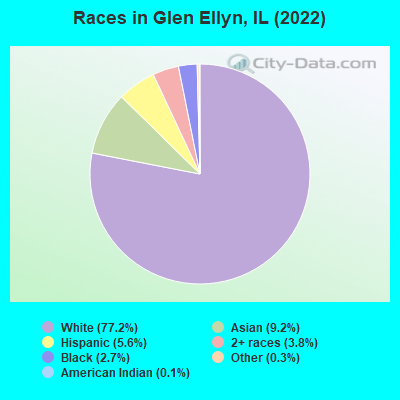
According to 2022 data, the most numerous races in Glen Ellyn, IL are White alone (21,630 residents), Hispanic (1,582 residents), and Black alone (761 residents). 85.0% of Glen Ellyn residents speak English at home. 11.3% of Glen Ellyn, IL residents are foreign-born (6.4% born in Asia, 2.2% born in Europe, 1.7% born in Latin America), which is 24.0% less than the foreign-born rate of 14.0% across the entire state of Illinois.
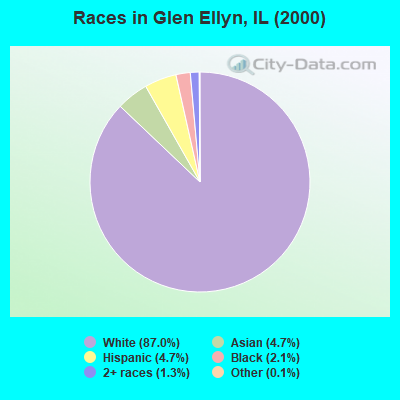
Race distribution in Glen Ellyn
2000 2022
8,424,140 67.8% White alone 1,856,152 14.9% Black alone 1,530,262 12.3% Hispanic 419,916 3.4% Asian alone 153,996 1.2% Two or more races 13,479 0.1% Other race alone 18,232 0.1% American Indian alone 3,116 0.03% Native Hawaiian and Other
7,356,301 58.5% White alone 2,299,726 18.3% Hispanic 1,660,423 13.2% Black alone 747,296 5.9% Asian alone 458,599 3.6% Two or more races 45,386 0.4% Other race alone 10,405 0.08% American Indian alone 3,896 0.03% Native Hawaiian and Other
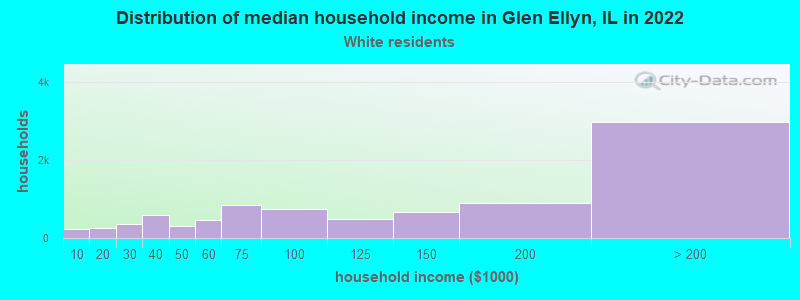
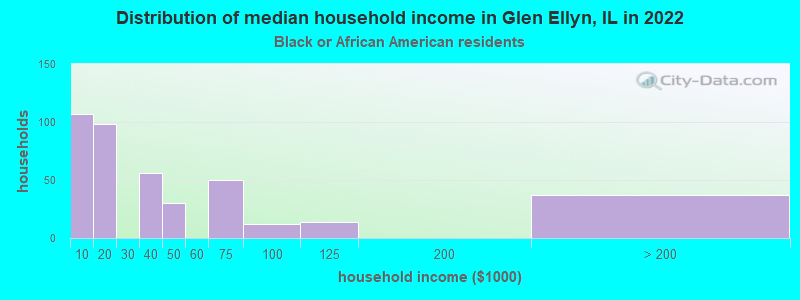
Income and house value in Glen Ellyn Median household income in 2022 $131,154 White non-Hispanic householders$88,581 Asian householders$69,278 Some other race householders$138,647 Two or more races householders$83,251 Hispanic or Latino race householdersMedian 2022 house value $571,871 White Non-Hispanic householders$374,610 Black or African American householders$185,971 American Indian or Alaska Native householders $325,962 Asian householders$392,263 Two or more races householders$601,224 Hispanic or Latino householders
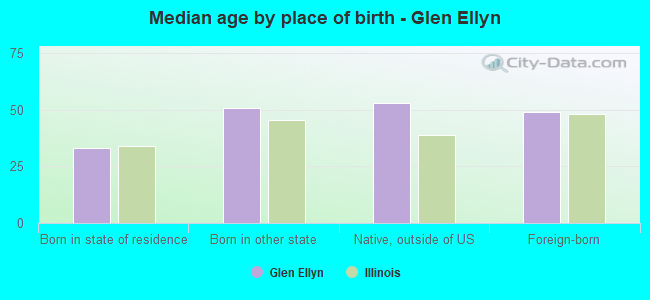
Median age by race in Glen Ellyn
45.3 Median age for White residents44.2 46.2 27.9 Median age for Black or African American residents34.8 25.2 39.6 Median age for American Indian / Alaska Native residents-721,943,047.9 11.9 39.7 Median age for Asian residents37.9 40.3 -593,236,714.4 Median age for Native Hawaiian / Pacific Islander residents-658,536,584.7 -576,015,108.0 27.0 Median age for Other race residents22.8 28.8 31.7 Median age for Two or more races residents23.4 40.0 45.1 Median age for White alone residents44.5 46.4 29.6 Median age for Hispanic or Latino residents25.0 33.5
Owner/renter occupied households by race in Glen Ellyn
House owners and renters - White residents 7,377 83.0% Owner occupied1,514 17.0% Renter occupiedHouse owners and renters - Black or African American residents 93 22.9% Owner occupied313 77.1% Renter occupiedHouse owners and renters - American Indian / Alaska Native residents 19 100.0% Owner occupiedHouse owners and renters - Asian residents 595 75.8% Owner occupied190 24.2% Renter occupiedHouse owners and renters - Other race residents 72 62.4% Owner occupied44 37.6% Renter occupiedHouse owners and renters - Two or more races residents 494 83.0% Owner occupied101 17.0% Renter occupiedHouse owners and renters - White alone residents 7,428 83.0% Owner occupied1,523 17.0% Renter occupiedHouse owners and renters - Hispanic or Latino residents 304 64.2% Owner occupied170 35.8% Renter occupied
Language usage in Glen Ellyn
English speakers - Total 85.0% of residents of Glen Ellyn speak English at home.
3.9% of residents speak Spanish at home 656 63.6% Speak English very well376 36.4% Speak English less than very well10.9% of residents speak other language at home 1,721 60.5% Speak English very well1,123 39.5% Speak English less than very well
English speakers - Born in the United States 95.9% of residents of Glen Ellyn speak English at home.
1.1% of residents speak Spanish at home 88 100.0% Speak English very well3.5% of residents speak other language at home 165 60.0% Speak English very well110 40.0% Speak English less than very well
English speakers - Native, born elsewhere 75.6% of residents of Glen Ellyn speak English at home.
17.5% of residents speak Spanish at home 37 72.5% Speak English very well14 27.5% Speak English less than very well7.6% of residents speak other language at home 22 100.0% Speak English very well
English speakers - Foreign-born 14.8% of residents of Glen Ellyn speak English at home.
12.5% of residents speak Spanish at home 184 47.4% Speak English very well204 52.6% Speak English less than very well71.3% of residents speak other language at home 1,210 54.6% Speak English very well1,006 45.4% Speak English less than very well
White (Caucasian) - Speak only English Native:
97.9% (18,839)Foreign-born:
32.0% (315)
White (Caucasian) - Speak another language Native:
3.1% (600)Foreign-born:
70.0% (689)
Black or African American - Speak another language Native:
3.6% (25)Foreign-born:
100.0% (31)
Asian - Speak only English Native:
77.9% (653)Foreign-born:
6.0% (96)
Asian - Speak another language Native:
26.1% (219)Foreign-born:
94.5% (1,500)
Other race - Speak only English Native:
63.3% (131)Foreign-born:
5.7% (6)
Other race - Speak another language Native:
43.8% (91)Foreign-born:
94.3% (97)
Two or more races - Speak only English Native:
86.1% (1,172)Foreign-born:
20.5% (58)
Two or more races - Speak another language Native:
10.1% (137)Foreign-born:
77.5% (220)
White alone - Speak only English Native:
97.4% (18,782)Foreign-born:
33.6% (348)
White alone - Speak another language Native:
2.8% (538)Foreign-born:
67.0% (694)
Hispanic or Latino - Speak only English Native:
58.4% (610)Foreign-born:
12.0% (44)
Hispanic or Latino - Speak another language Native:
40.7% (425)Foreign-born:
87.3% (317)
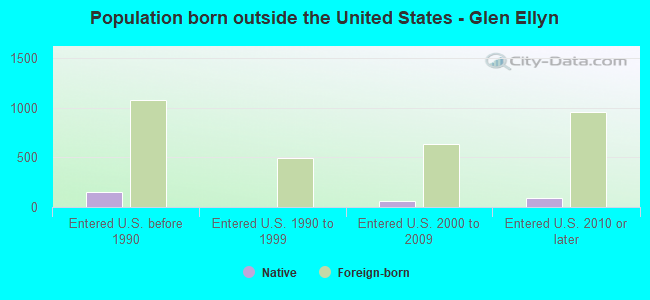
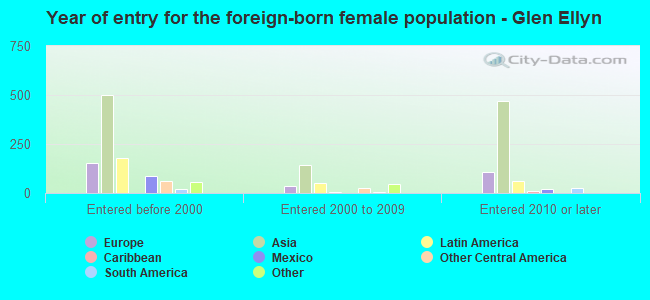
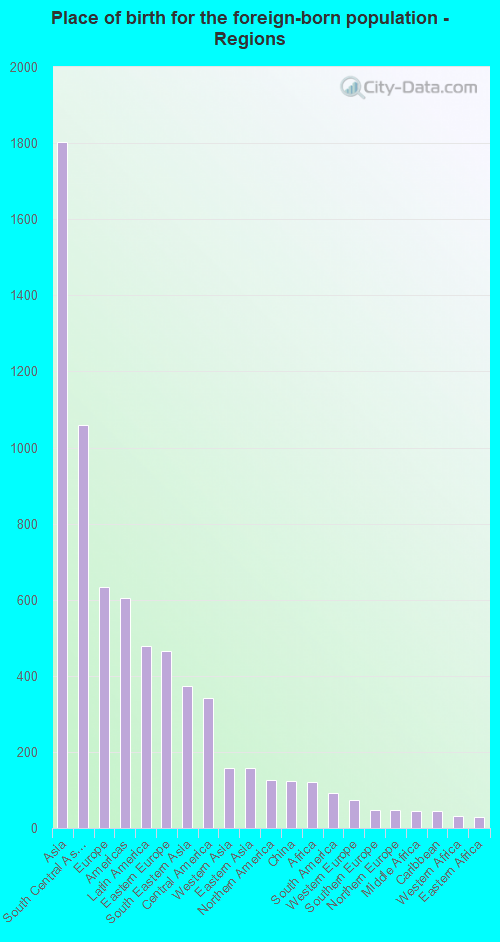
Foreign-born residents in Glen Ellyn 3,163 residents are foreign born (6.4% Asia , 2.2% Europe , 1.7% Latin America ).
This city:
11.3%Illinois:
14.1%
Marital status for residents in Glen Ellyn Marital status - White (Caucasian) population 15 years and over
Males 27.0% Never married63.3% Now married0.9% Separated2.9% Widowed6.0% DivorcedFemales 22.4% Never married59.1% Now married0.7% Separated10.5% Widowed7.2% DivorcedWomen who gave birth in the past 12 months Now married:
94.0% (251)Unmarried:
6.0% (16)
Women who did not give birth in the past 12 months Now married:
54.6% (2,082)Unmarried:
45.4% (1,730)
Marital status - Black or African American population 15 years and over
Males 61.7% Never married26.6% Now married0.0% Separated0.0% Widowed11.7% DivorcedFemales 54.3% Never married34.4% Now married5.7% Separated5.7% Widowed0.0% DivorcedWomen who gave birth in the past 12 months Now married:
100.0% (1)Unmarried:
0.0% (0)
Women who did not give birth in the past 12 months Now married:
34.3% (71)Unmarried:
65.7% (136)
Marital status - American Indian / Alaska Native population 15 years and over
Males 0.0% Never married100.0% Now married0.0% Separated0.0% Widowed0.0% DivorcedFemales 66.7% Never married0.0% Now married0.0% Separated0.0% Widowed33.3% DivorcedWomen who did not give birth in the past 12 months Now married:
0.0% (0)Unmarried:
100.0% (15)
Marital status - Asian population 15 years and over
Males 28.4% Never married67.7% Now married0.0% Separated1.4% Widowed2.6% DivorcedFemales 20.4% Never married60.8% Now married0.0% Separated13.2% Widowed5.6% DivorcedWomen who gave birth in the past 12 months Now married:
100.0% (25)Unmarried:
0.0% (0)
Women who did not give birth in the past 12 months Now married:
62.5% (461)Unmarried:
37.5% (277)
Marital status - Other race population 15 years and over
Males 37.4% Never married51.5% Now married0.0% Separated0.0% Widowed11.1% DivorcedFemales 15.4% Never married84.6% Now married0.0% Separated0.0% Widowed0.0% DivorcedWomen who did not give birth in the past 12 months Now married:
75.6% (43)Unmarried:
24.4% (14)
Marital status - Two or more races population 15 years and over
Males 36.6% Never married60.4% Now married0.0% Separated1.5% Widowed1.5% DivorcedFemales 31.5% Never married63.9% Now married0.0% Separated0.3% Widowed4.2% DivorcedWomen who did not give birth in the past 12 months Now married:
51.2% (155)Unmarried:
48.8% (148)
Marital status - White alone, not Hispanic / Latino population 15 years and over
Males 26.1% Never married64.0% Now married0.8% Separated3.0% Widowed6.2% DivorcedFemales 21.6% Never married60.1% Now married0.2% Separated10.7% Widowed7.4% DivorcedWomen who gave birth in the past 12 months Now married:
94.0% (268)Unmarried:
6.0% (17)
Women who did not give birth in the past 12 months Now married:
55.5% (2,141)Unmarried:
44.5% (1,718)
Marital status - Hispanic or Latino population 15 years and over
Males 47.0% Never married49.3% Now married1.8% Separated0.0% Widowed1.8% DivorcedFemales 39.1% Never married48.6% Now married9.7% Separated2.5% Widowed0.0% DivorcedWomen who gave birth in the past 12 months Now married:
100.0% (1)Unmarried:
0.0% (0)
Women who did not give birth in the past 12 months Now married:
46.8% (169)Unmarried:
53.2% (192)
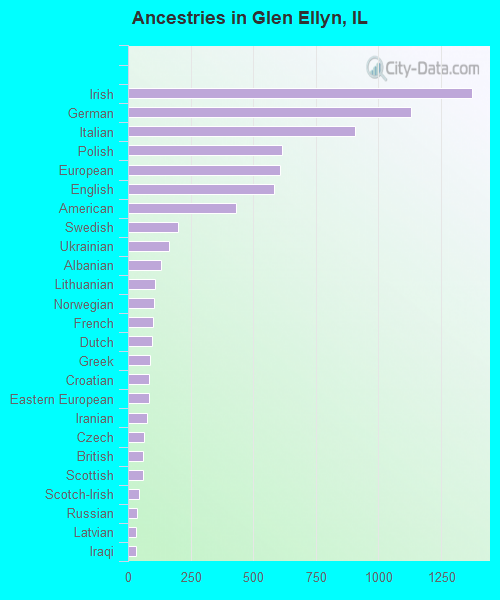
Ancestries in Glen Ellyn
1,373 12.6% Irish1,130 10.4% German907 8.3% Italian616 5.6% Polish608 5.6% European583 5.3% English433 4.0% American200 1.8% Swedish163 1.5% Ukrainian130 1.2% Albanian107 1.0% Lithuanian104 1.0% Norwegian98 0.9% French97 0.9% Dutch87 0.8% Greek85 0.8% Croatian83 0.8% Eastern European77 0.7% Iranian64 0.6% Czech58 0.5% British58 0.5% Scottish45 0.4% Scotch-Irish35 0.3% Russian33 0.3% Latvian33 0.3% Iraqi31 0.3% Palestinian28 0.3% Danish26 0.2% Slovak24 0.2% Yugoslavian22 0.2% Slovene19 0.2% Brazilian16 0.1% Scandinavian14 0.1% Canadian14 0.1% Lebanese12 0.1% Nigerian12 0.1% Swiss10 0.09% Czechoslovakian10 0.09% Bulgarian9 0.08% Estonian8 0.07% Northern European8 0.07% French Canadian7 0.06% Hungarian
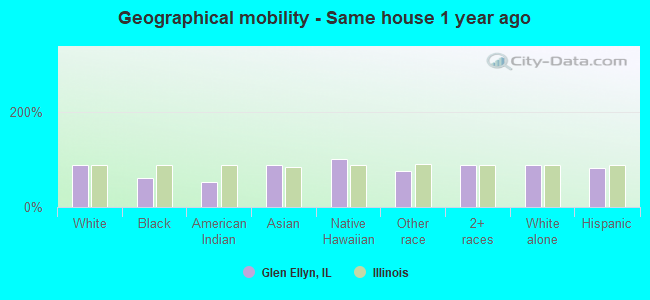
Geographical mobility in Glen Ellyn Same house 1 year ago 18,551 88.4% White (Caucasian)456 59.7% Black or African American33 52.3% American Indian / Alaska Native2,299 89.2% Asian15 100.0% Native Hawaiian / Pacific Islander305 76.0% Other race1,598 89.4% Two or more races18,882 88.9% White alone, not Hispanic / Latino1,274 81.2% Hispanic or LatinoMoved within same county 1,126 5.4% White / Caucasian154 20.1% Black or African American30 48.5% American Indian / Alaska Native47 1.8% Asian58 14.6% Other race123 6.9% Two or more races1,032 4.9% White alone, not Hispanic / Latino185 11.8% Hispanic or LatinoMoved within same state 652 3.1% White / Caucasian156 20.5% Black or African American251 9.7% Asian4 0.9% Other race38 2.1% Two or more races679 3.2% White alone, not Hispanic / Latino13 0.8% Hispanic or LatinoMoved from different state 479 2.3% White / Caucasian0 0.1% Black or African American2 0.1% Asian22 5.5% Other race467 2.2% White alone, not Hispanic / Latino94 6.0% Hispanic or LatinoMoved from abroad 123 0.6% White33 1.3% Asian132 0.6% White alone, not Hispanic / Latino
Children Nativity (place of birth) in Glen Ellyn
Children under 6 years - Living with two parents Both parents native 1,542 100.0% Native0 0.0% Foreign-bornBoth parents foreign-born 93 92.7% Native7 7.3% Foreign-bornOne native, one foreign-born parent 373 100.0% NativeChildren under 6 years - Living with one parent Native parent 80 100.0% NativeForeign-born parent 41 100.0% Foreign-bornChildren 6 to 17 years - Living with two parents Both parents native 3,443 98.5% Native53 1.5% Foreign-bornBoth parents foreign-born 303 86.5% Native47 13.5% Foreign-bornOne native, one foreign-born parent 362 100.0% NativeChildren 6 to 17 years - Living with one parent Native parent 386 100.0% NativeForeign-born parent 130 58.5% Native92 41.5% Foreign-born
Grandparents responsible for own grandchildren in Glen Ellyn
Grandparents (30 to 59 years) White / Caucasian 3 80.9% Responsible for grandchildren1 19.1% Not responsible for grandchildrenBlack or African American 13 100.0% Responsible for grandchildrenAsian 51 100.0% Not responsible for grandchildrenWhite alone, not Hispanic / Latino 4 80.6% Responsible for grandchildren1 19.4% Not responsible for grandchildrenGrandparents (60 years and over) White / Caucasian 2 3.7% Responsible for grandchildren50 96.3% Not responsible for grandchildrenBlack or African American 10 100.0% Not responsible for grandchildrenAsian 6 5.5% Responsible for grandchildren111 94.5% Not responsible for grandchildrenWhite alone, not Hispanic / Latino 2 4.1% Responsible for grandchildren50 95.9% Not responsible for grandchildren