Races in Glenarden, Maryland (MD) Detailed Stats
Data:
Races - White alone (%)
Races - White alone (% change since 2000)
Races - Black alone (%)
Races - Black alone (% change since 2000)
Races - American Indian alone (%)
Races - American Indian alone (% change since 2000)
Races - Asian alone (%)
Races - Asian alone (% change since 2000)
Races - Hispanic (%)
Races - Hispanic (% change since 2000)
Races - Native Hawaiian and Other Pacific Islander alone (%)
Races - Native Hawaiian and Other Pacific Islander alone (% change since 2000)
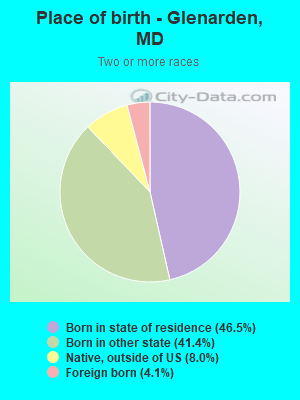
Races - Two or more races(%)
Races - Two or more races(% change since 2000)
Races - Other race alone (%)
Races - Other race alone (% change since 2000)
Racial diversity
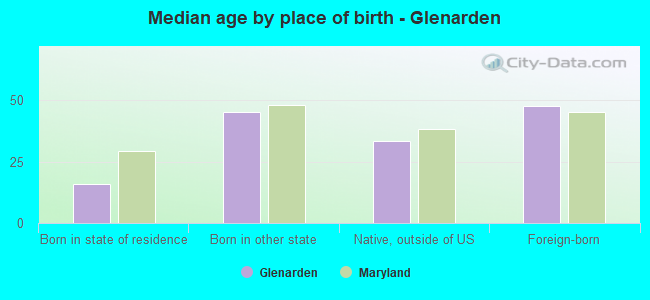
Place of birth - Born in state of residence (%)
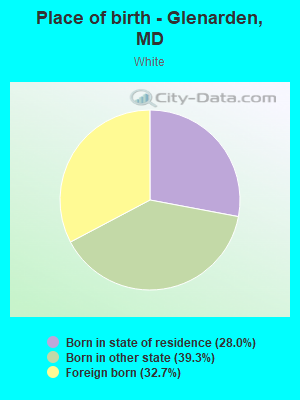
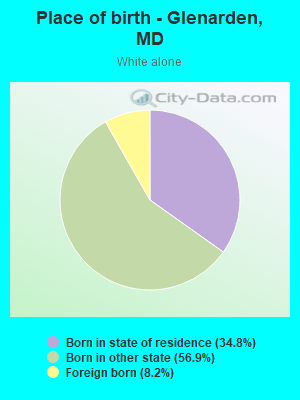
Place of birth - Born in state of residence (%) - White
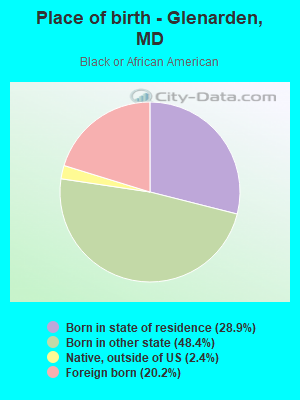
Place of birth - Born in state of residence (%) - Black or African American
Place of birth - Born in state of residence (%) - Asian
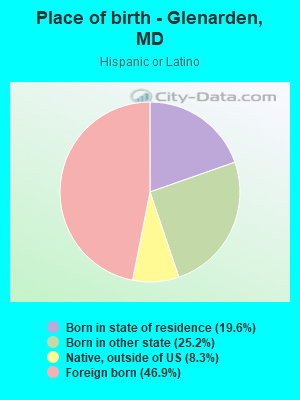
Place of birth - Born in state of residence (%) - Hispanic or Latino
Place of birth - Born in state of residence (%) - American Indian and Alaska Native
Place of birth - Born in state of residence (%) - Multirace
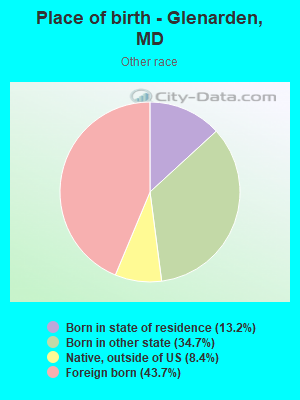
Place of birth - Born in state of residence (%) - Other Race
Place of birth - Born in other state (%)
Place of birth - Born in other state (%) - White
Place of birth - Born in other state (%) - Black or African American
Place of birth - Born in other state (%) - Asian
Place of birth - Born in other state (%) - Hispanic or Latino
Place of birth - Born in other state (%) - American Indian and Alaska Native
Place of birth - Born in other state (%) - Multirace
Place of birth - Born in other state (%) - Other Race
Place of birth - Native, outside of US (%)
Place of birth - Native, outside of US (%) - White
Place of birth - Native, outside of US (%) - Black or African American
Place of birth - Native, outside of US (%) - Asian
Place of birth - Native, outside of US (%) - Hispanic or Latino
Place of birth - Native, outside of US (%) - American Indian and Alaska Native
Place of birth - Native, outside of US (%) - Multirace
Place of birth - Native, outside of US (%) - Other Race
Place of birth - Foreign born (%)
Place of birth - Foreign born (%) - White
Place of birth - Foreign born (%) - Black or African American
Place of birth - Foreign born (%) - Asian
Place of birth - Foreign born (%) - Hispanic or Latino
Place of birth - Foreign born (%) - American Indian and Alaska Native
Place of birth - Foreign born (%) - Multirace
Place of birth - Foreign born (%) - Other Race
Residents speaking English at home (%)
Residents speaking English at home - Born in the United States (%)
Residents speaking English at home - Native, born elsewhere (%)
Residents speaking English at home - Foreign born (%)
Residents speaking Spanish at home (%)
Residents speaking Spanish at home - Born in the United States (%)
Residents speaking Spanish at home - Native, born elsewhere (%)
Residents speaking Spanish at home - Foreign born (%)
Residents speaking other language at home (%)
Residents speaking other language at home - Born in the United States (%)
Residents speaking other language at home - Native, born elsewhere (%)
Residents speaking other language at home - Foreign born (%)
Marital status - Never married (%)
Marital status - Now married (%)
Marital status - Separated (%)
Marital status - Widowed (%)
Marital status - Divorced (%)
Ancestries Reported - Arab (%)
Ancestries Reported - Czech (%)
Ancestries Reported - Danish (%)
Ancestries Reported - Dutch (%)
Ancestries Reported - English (%)
Ancestries Reported - French (%)
Ancestries Reported - French Canadian (%)
Ancestries Reported - German (%)
Ancestries Reported - Greek (%)
Ancestries Reported - Hungarian (%)
Ancestries Reported - Irish (%)
Ancestries Reported - Italian (%)
Ancestries Reported - Lithuanian (%)
Ancestries Reported - Norwegian (%)
Ancestries Reported - Polish (%)
Ancestries Reported - Portuguese (%)
Ancestries Reported - Russian (%)
Ancestries Reported - Scotch-Irish (%)
Ancestries Reported - Scottish (%)
Ancestries Reported - Slovak (%)
Ancestries Reported - Subsaharan African (%)
Ancestries Reported - Swedish (%)
Ancestries Reported - Swiss (%)
Ancestries Reported - Ukrainian (%)
Ancestries Reported - United States (%)
Ancestries Reported - Welsh (%)
Ancestries Reported - West Indian (%)
Ancestries Reported - Other (%)
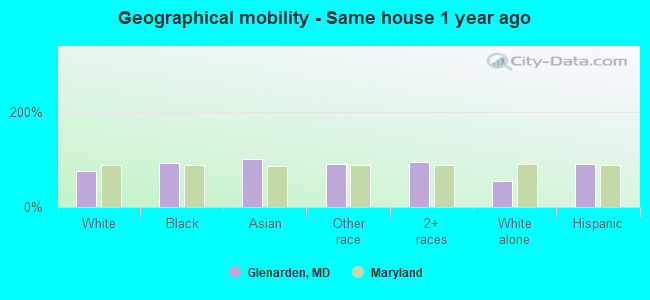
Geographical mobility - Same house 1 year ago (%)
Geographical mobility - Same house 1 year ago (%) - White
Geographical mobility - Same house 1 year ago (%) - Black or African American
Geographical mobility - Same house 1 year ago (%) - Asian
Geographical mobility - Same house 1 year ago (%) - Hispanic or Latino
Geographical mobility - Same house 1 year ago (%) - American Indian and Alaska Native
Geographical mobility - Same house 1 year ago (%) - Multirace
Geographical mobility - Same house 1 year ago (%) - Other Race
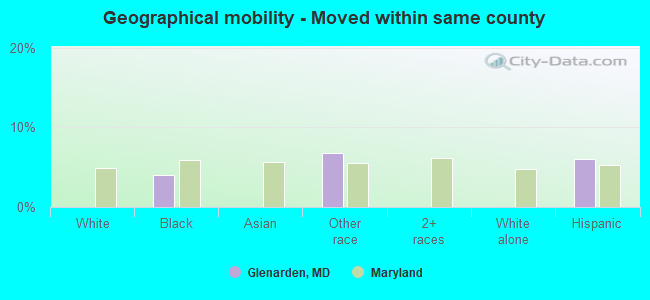
Geographical mobility - Moved within same county (%)
Geographical mobility - Moved within same county (%) - White
Geographical mobility - Moved within same county (%) - Black or African American
Geographical mobility - Moved within same county (%) - Asian
Geographical mobility - Moved within same county (%) - Hispanic or Latino
Geographical mobility - Moved within same county (%) - American Indian and Alaska Native
Geographical mobility - Moved within same county (%) - Multirace
Geographical mobility - Moved within same county (%) - Other Race
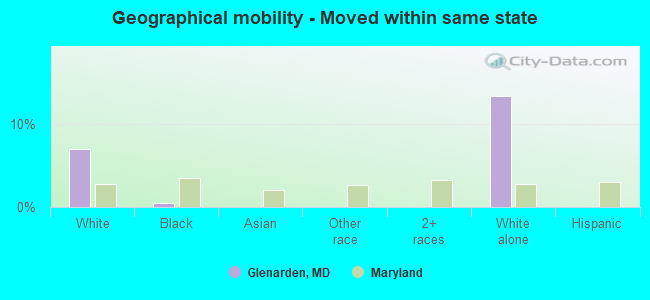
Geographical mobility - Moved from different county within same state (%)
Geographical mobility - Moved from different county within same state (%) - White
Geographical mobility - Moved from different county within same state (%) - Black or African American
Geographical mobility - Moved from different county within same state (%) - Asian
Geographical mobility - Moved from different county within same state (%) - Hispanic or Latino
Geographical mobility - Moved from different county within same state (%) - American Indian and Alaska Native
Geographical mobility - Moved from different county within same state (%) - Multirace
Geographical mobility - Moved from different county within same state (%) - Other Race
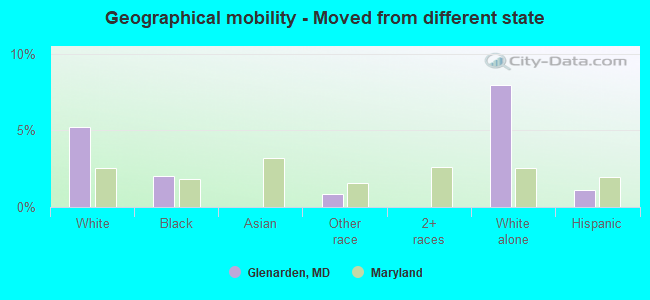
Geographical mobility - Moved from different state (%)
Geographical mobility - Moved from different state (%) - White
Geographical mobility - Moved from different state (%) - Black or African American
Geographical mobility - Moved from different state (%) - Asian
Geographical mobility - Moved from different state (%) - Hispanic or Latino
Geographical mobility - Moved from different state (%) - American Indian and Alaska Native
Geographical mobility - Moved from different state (%) - Multirace
Geographical mobility - Moved from different state (%) - Other Race
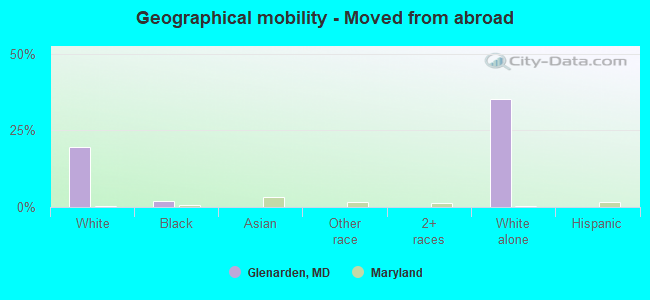
Geographical mobility - Moved from abroad (%)
Geographical mobility - Moved from abroad (%) - White
Geographical mobility - Moved from abroad (%) - Black or African American
Geographical mobility - Moved from abroad (%) - Asian
Geographical mobility - Moved from abroad (%) - Hispanic or Latino
Geographical mobility - Moved from abroad (%) - American Indian and Alaska Native
Geographical mobility - Moved from abroad (%) - Multirace
Geographical mobility - Moved from abroad (%) - Other Race
Place of birth for the foreign-born population - Ireland (%)
Place of birth for the foreign-born population - Denmark (%)
Place of birth for the foreign-born population - Norway (%)
Place of birth for the foreign-born population - Sweden (%)
Place of birth for the foreign-born population - United Kingdom (%)
Place of birth for the foreign-born population - England (%)
Place of birth for the foreign-born population - Scotland (%)
Place of birth for the foreign-born population - Other Northern Europe (%)
Place of birth for the foreign-born population - Austria (%)
Place of birth for the foreign-born population - Belgium (%)
Place of birth for the foreign-born population - France (%)
Place of birth for the foreign-born population - Germany (%)
Place of birth for the foreign-born population - Netherlands (%)
Place of birth for the foreign-born population - Switzerland (%)
Place of birth for the foreign-born population - Other Western Europe (%)
Place of birth for the foreign-born population - Greece (%)
Place of birth for the foreign-born population - Italy (%)
Place of birth for the foreign-born population - Portugal (%)
Place of birth for the foreign-born population - Spain (%)
Place of birth for the foreign-born population - Other Southern Europe (%)
Place of birth for the foreign-born population - Albania (%)
Place of birth for the foreign-born population - Belarus (%)
Place of birth for the foreign-born population - Bosnia and Herzegovina (%)
Place of birth for the foreign-born population - Bulgaria (%)
Place of birth for the foreign-born population - Croatia (%)
Place of birth for the foreign-born population - Czechoslovakia (%)
Place of birth for the foreign-born population - Hungary (%)
Place of birth for the foreign-born population - Latvia (%)
Place of birth for the foreign-born population - Lithuania (%)
Place of birth for the foreign-born population - North Macedonia (Macedonia) (%)
Place of birth for the foreign-born population - Moldova (%)
Place of birth for the foreign-born population - Poland (%)
Place of birth for the foreign-born population - Romania (%)
Place of birth for the foreign-born population - Russia (%)
Place of birth for the foreign-born population - Serbia (%)
Place of birth for the foreign-born population - Ukraine (%)
Place of birth for the foreign-born population - Other Eastern Europe (%)
Place of birth for the foreign-born population - China (%)
Place of birth for the foreign-born population - Hong Kong (%)
Place of birth for the foreign-born population - Taiwan (%)
Place of birth for the foreign-born population - Japan (%)
Place of birth for the foreign-born population - Korea (%)
Place of birth for the foreign-born population - Other Eastern Asia (%)
Place of birth for the foreign-born population - Afghanistan (%)
Place of birth for the foreign-born population - Bangladesh (%)
Place of birth for the foreign-born population - India (%)
Place of birth for the foreign-born population - Iran (%)
Place of birth for the foreign-born population - Kazakhstan (%)
Place of birth for the foreign-born population - Nepal (%)
Place of birth for the foreign-born population - Pakistan (%)
Place of birth for the foreign-born population - Sri Lanka (%)
Place of birth for the foreign-born population - Uzbekistan (%)
Place of birth for the foreign-born population - Other South Central Asia (%)
Place of birth for the foreign-born population - Burma (%)
Place of birth for the foreign-born population - Cambodia (%)
Place of birth for the foreign-born population - Indonesia (%)
Place of birth for the foreign-born population - Laos (%)
Place of birth for the foreign-born population - Malaysia (%)
Place of birth for the foreign-born population - Philippines (%)
Place of birth for the foreign-born population - Singapore (%)
Place of birth for the foreign-born population - Thailand (%)
Place of birth for the foreign-born population - Vietnam (%)
Place of birth for the foreign-born population - Other South Eastern Asia (%)
Place of birth for the foreign-born population - Armenia (%)
Place of birth for the foreign-born population - Iraq (%)
Place of birth for the foreign-born population - Israel (%)
Place of birth for the foreign-born population - Jordan (%)
Place of birth for the foreign-born population - Kuwait (%)
Place of birth for the foreign-born population - Lebanon (%)
Place of birth for the foreign-born population - Saudi Arabia (%)
Place of birth for the foreign-born population - Syria (%)
Place of birth for the foreign-born population - Turkey (%)
Place of birth for the foreign-born population - Yemen (%)
Place of birth for the foreign-born population - Other Western Asia (%)
Place of birth for the foreign-born population - Eritrea (%)
Place of birth for the foreign-born population - Ethiopia (%)
Place of birth for the foreign-born population - Kenya (%)
Place of birth for the foreign-born population - Somalia (%)
Place of birth for the foreign-born population - Uganda (%)
Place of birth for the foreign-born population - Zimbabwe (%)
Place of birth for the foreign-born population - Other Eastern Africa (%)
Place of birth for the foreign-born population - Cameroon (%)
Place of birth for the foreign-born population - Congo (%)
Place of birth for the foreign-born population - Democratic Republic of Congo (Zaire) (%)
Place of birth for the foreign-born population - Other Middle Africa (%)
Place of birth for the foreign-born population - Egypt (%)
Place of birth for the foreign-born population - Morocco (%)
Place of birth for the foreign-born population - Sudan (%)
Place of birth for the foreign-born population - Other Northern Africa (%)
Place of birth for the foreign-born population - South Africa (%)
Place of birth for the foreign-born population - Other Southern Africa (%)
Place of birth for the foreign-born population - Cabo Verde (%)
Place of birth for the foreign-born population - Ghana (%)
Place of birth for the foreign-born population - Liberia (%)
Place of birth for the foreign-born population - Nigeria (%)
Place of birth for the foreign-born population - Senegal (%)
Place of birth for the foreign-born population - Sierra Leone (%)
Place of birth for the foreign-born population - Other Western Africa (%)
Place of birth for the foreign-born population - Australia (%)
Place of birth for the foreign-born population - New Zealand (%)
Place of birth for the foreign-born population - Fiji (%)
Place of birth for the foreign-born population - Micronesia (%)
Place of birth for the foreign-born population - Bahamas (%)
Place of birth for the foreign-born population - Barbados (%)
Place of birth for the foreign-born population - Cuba (%)
Place of birth for the foreign-born population - Dominica (%)
Place of birth for the foreign-born population - Dominican Republic (%)
Place of birth for the foreign-born population - Grenada (%)
Place of birth for the foreign-born population - Haiti (%)
Place of birth for the foreign-born population - Jamaica (%)
Place of birth for the foreign-born population - St. Vincent and the Grenadines (%)
Place of birth for the foreign-born population - Trinidad and Tobago (%)
Place of birth for the foreign-born population - West Indies (%)
Place of birth for the foreign-born population - Other Caribbean (%)
Place of birth for the foreign-born population - Belize (%)
Place of birth for the foreign-born population - Costa Rica (%)
Place of birth for the foreign-born population - El Salvador (%)
Place of birth for the foreign-born population - Guatemala (%)
Place of birth for the foreign-born population - Honduras (%)
Place of birth for the foreign-born population - Mexico (%)
Place of birth for the foreign-born population - Nicaragua (%)
Place of birth for the foreign-born population - Panama (%)
Place of birth for the foreign-born population - Other Central America (%)
Place of birth for the foreign-born population - Argentina (%)
Place of birth for the foreign-born population - Bolivia (%)
Place of birth for the foreign-born population - Brazil (%)
Place of birth for the foreign-born population - Chile (%)
Place of birth for the foreign-born population - Colombia (%)
Place of birth for the foreign-born population - Ecuador (%)
Place of birth for the foreign-born population - Guyana (%)
Place of birth for the foreign-born population - Peru (%)
Place of birth for the foreign-born population - Uruguay (%)
Place of birth for the foreign-born population - Venezuela (%)
Place of birth for the foreign-born population - Other South America (%)
Place of birth for the foreign-born population - Canada (%)
Place of birth for the foreign-born population - Other Northern America (%)
Place of birth for the foreign-born population - Other (%)
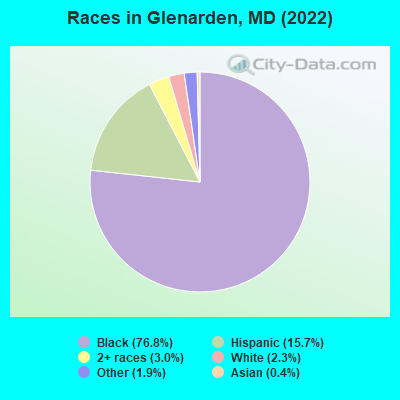
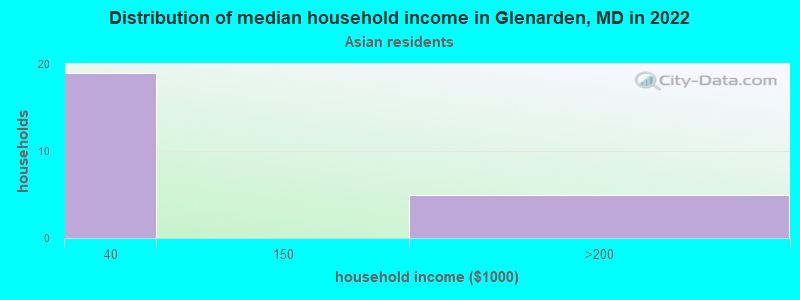
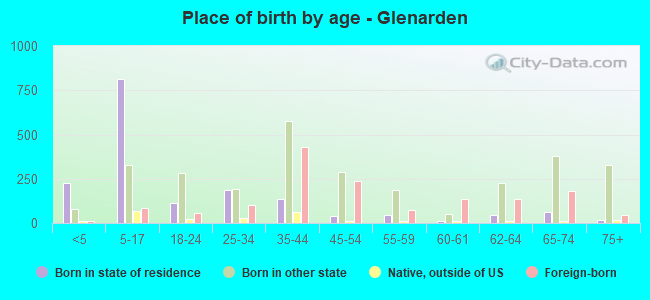
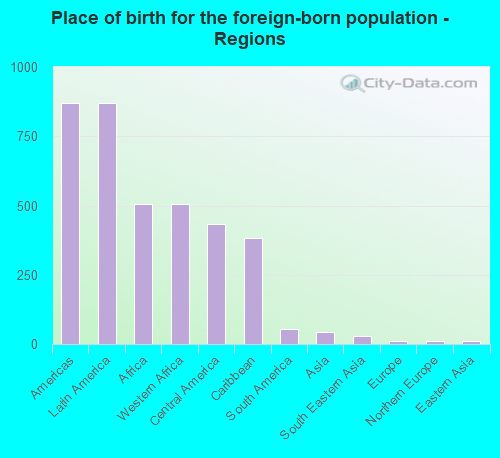
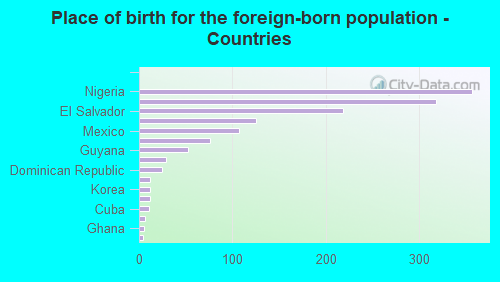
According to 2022 data, the most numerous races in Glenarden, MD are White alone (146 residents), Black alone (4,810 residents), and Hispanic (982 residents). 76.5% of Glenarden residents speak English at home. 22.9% of Glenarden, MD residents are foreign-born (12.9% born in Latin America, 7.5% born in Africa), which is 30.1% greater than the foreign-born rate of 16.0% across the entire state of Maryland.
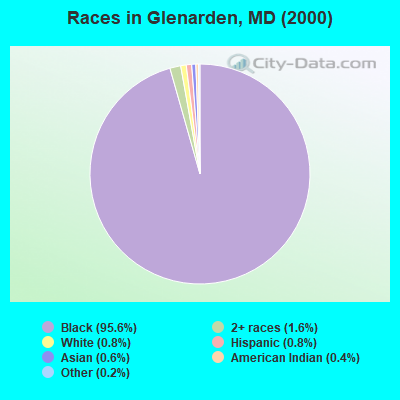
Race distribution in Glenarden
2000 2022
3,286,547 62.1% White alone 1,464,735 27.7% Black alone 227,916 4.3% Hispanic 209,738 4.0% Asian alone 82,946 1.6% Two or more races 13,312 0.3% American Indian alone 9,379 0.2% Other race alone 1,913 0.04% Native Hawaiian and Other
2,906,492 47.1% White alone 1,800,914 29.2% Black alone 705,842 11.4% Hispanic 401,818 6.5% Asian alone 291,317 4.7% Two or more races 46,930 0.8% Other race alone 8,930 0.1% American Indian alone 2,417 0.04% Native Hawaiian and Other
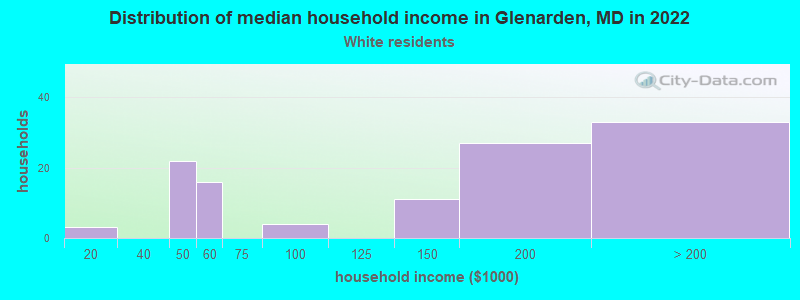
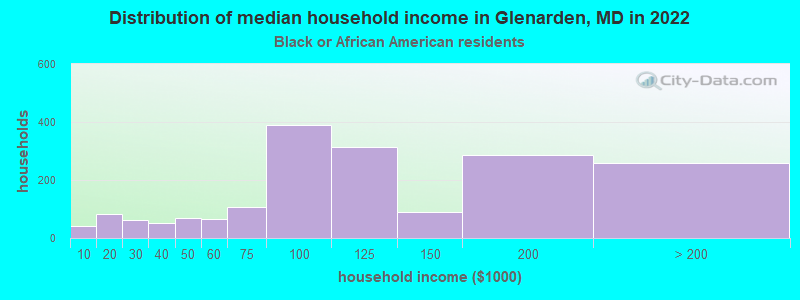
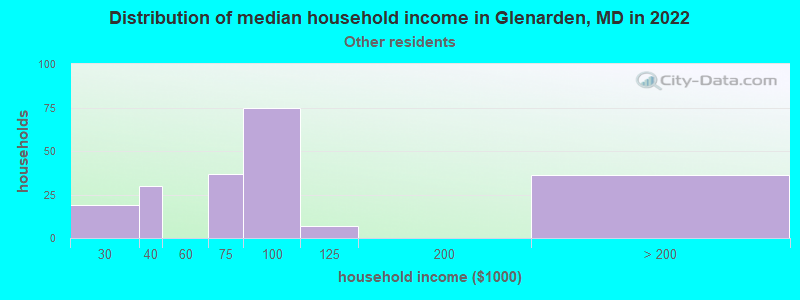
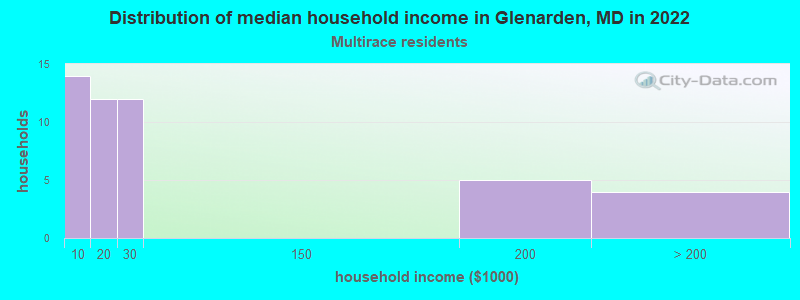
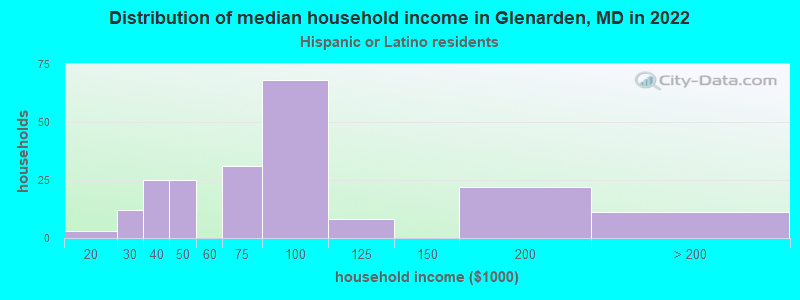
Income and house value in Glenarden Median household income in 2022 $165,139 White non-Hispanic householders$102,579 Black householders$69,511 Some other race householders$71,280 Hispanic or Latino race householdersMedian 2022 house value $470,161 White Non-Hispanic householders$415,211 Black or African American householders$365,789 American Indian or Alaska Native householders$609,648 Some other race householders$581,361 Two or more races householders$609,648 Hispanic or Latino householders
Median age by race in Glenarden
49.5 Median age for White residents52.7 41.5 43.6 Median age for Black or African American residents41.5 45.1 -780,410,741.7 Median age for American Indian / Alaska Native residents-888,297,871.5 -689,905,591.2 56.4 Median age for Asian residents-668,430,334.4 92.5 -571,600,480.8 Median age for Native Hawaiian / Pacific Islander residents-720,061,021.4 -760,942,760.2 31.8 Median age for Other race residents29.3 33.5 7.9 Median age for Two or more races residents7.2 39.2 49.0 Median age for White alone residents49.1 40.5 30.4 Median age for Hispanic or Latino residents30.5 30.6
Owner/renter occupied households by race in Glenarden
House owners and renters - White residents 104 100.0% Owner occupiedHouse owners and renters - Black or African American residents 1,468 80.0% Owner occupied367 20.0% Renter occupiedHouse owners and renters - Asian residents 18 100.0% Owner occupiedHouse owners and renters - Other race residents 155 87.1% Owner occupied23 12.9% Renter occupiedHouse owners and renters - Two or more races residents 36 82.6% Owner occupied8 17.4% Renter occupiedHouse owners and renters - White alone residents 77 100.0% Owner occupiedHouse owners and renters - Hispanic or Latino residents 162 87.9% Owner occupied22 12.1% Renter occupied
Language usage in Glenarden
English speakers - Total 76.5% of residents of Glenarden speak English at home.
15.6% of residents speak Spanish at home 330 35.4% Speak English very well601 64.6% Speak English less than very well7.0% of residents speak other language at home 404 96.2% Speak English very well16 3.8% Speak English less than very well
English speakers - Born in the United States 89.4% of residents of Glenarden speak English at home.
9.2% of residents speak Spanish at home 223 86.4% Speak English very well35 13.6% Speak English less than very well1.0% of residents speak other language at home 29 100.0% Speak English very well
English speakers - Native, born elsewhere 64.9% of residents of Glenarden speak English at home.
39.8% of residents speak Spanish at home 38 45.2% Speak English very well46 54.8% Speak English less than very well
English speakers - Foreign-born 45.5% of residents of Glenarden speak English at home.
30.5% of residents speak Spanish at home 37 8.4% Speak English very well406 91.6% Speak English less than very well25.4% of residents speak other language at home 353 95.7% Speak English very well16 4.3% Speak English less than very well
White (Caucasian) - Speak only English Native:
81.2% (135)Foreign-born:
27.4% (21)
White (Caucasian) - Speak another language Native:
18.0% (30)Foreign-born:
73.7% (56)
Black or African American - Speak only English Native:
96.0% (3,509)Foreign-born:
58.5% (576)
Black or African American - Speak another language Native:
4.0% (145)Foreign-born:
38.8% (382)
Other race - Speak only English Native:
16.1% (65)Foreign-born:
9.6% (33)
Other race - Speak another language Native:
83.8% (337)Foreign-born:
89.2% (305)
Two or more races - Speak another language Native:
10.6% (28)Foreign-born:
100.0% (15)
White alone - Speak only English Native:
99.0% (135)Foreign-born:
100.0% (12)
Hispanic or Latino - Speak only English Native:
11.6% (51)Foreign-born:
8.9% (41)
Hispanic or Latino - Speak another language Native:
87.5% (388)Foreign-born:
90.0% (415)
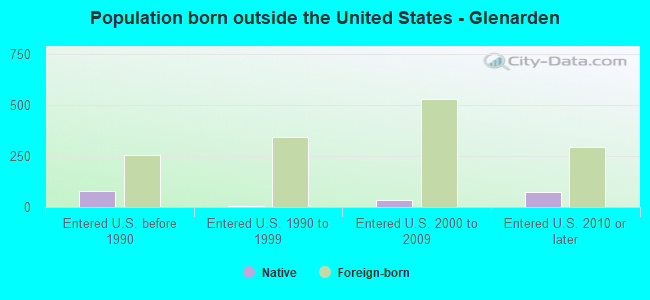
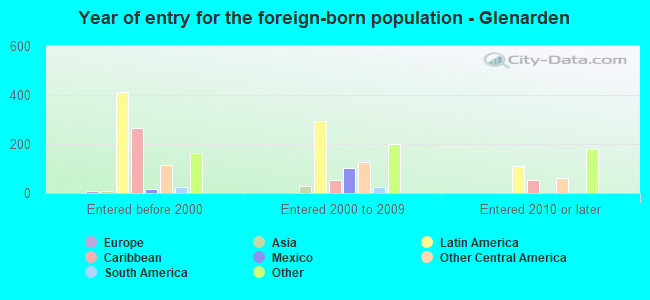
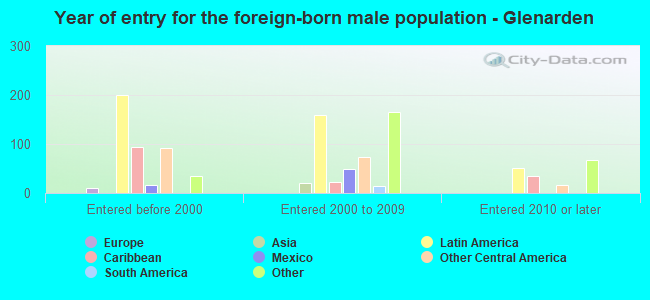
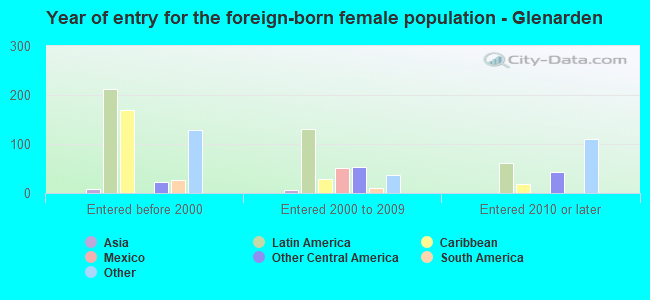
Foreign-born residents in Glenarden 1,434 residents are foreign born (12.9% Latin America , 7.5% Africa ).
This city:
22.9%Maryland:
15.7%
Marital status for residents in Glenarden Marital status - White (Caucasian) population 15 years and over
Males 3.4% Never married63.7% Now married17.1% Separated0.0% Widowed15.8% DivorcedFemales 30.7% Never married52.5% Now married16.8% Separated0.0% Widowed0.0% DivorcedWomen who gave birth in the past 12 months Now married:
100.0% (9)Unmarried:
0.0% (0)
Women who did not give birth in the past 12 months Now married:
36.7% (15)Unmarried:
63.3% (27)
Marital status - Black or African American population 15 years and over
Males 52.0% Never married32.6% Now married0.5% Separated8.0% Widowed6.9% DivorcedFemales 37.4% Never married28.7% Now married3.6% Separated16.3% Widowed14.0% DivorcedWomen who gave birth in the past 12 months Now married:
15.3% (12)Unmarried:
84.7% (68)
Women who did not give birth in the past 12 months Now married:
30.4% (337)Unmarried:
69.6% (769)
Marital status - Asian population 15 years and over
Males 0.0% Never married100.0% Now married0.0% Separated0.0% Widowed0.0% DivorcedFemales 16.7% Never married27.8% Now married0.0% Separated55.6% Widowed0.0% DivorcedWomen who did not give birth in the past 12 months Now married:
62.5% (5)Unmarried:
37.5% (3)
Marital status - Other race population 15 years and over
Males 21.8% Never married78.2% Now married0.0% Separated0.0% Widowed0.0% DivorcedFemales 20.6% Never married79.4% Now married0.0% Separated0.0% Widowed0.0% DivorcedWomen who gave birth in the past 12 months Now married:
0.0% (0)Unmarried:
100.0% (17)
Women who did not give birth in the past 12 months Now married:
86.9% (154)Unmarried:
13.1% (23)
Marital status - Two or more races population 15 years and over
Males 62.5% Never married0.0% Now married0.0% Separated37.5% Widowed0.0% DivorcedFemales 12.4% Never married76.4% Now married0.0% Separated0.0% Widowed11.2% DivorcedWomen who did not give birth in the past 12 months Now married:
80.7% (50)Unmarried:
19.3% (12)
Marital status - White alone, not Hispanic / Latino population 15 years and over
Males 5.1% Never married76.5% Now married0.0% Separated0.0% Widowed18.4% DivorcedFemales 0.0% Never married100.0% Now married0.0% Separated0.0% Widowed0.0% DivorcedWomen who did not give birth in the past 12 months Now married:
100.0% (17)Unmarried:
0.0% (0)
Marital status - Hispanic or Latino population 15 years and over
Males 19.0% Never married73.1% Now married6.6% Separated0.0% Widowed1.3% DivorcedFemales 32.7% Never married59.0% Now married8.3% Separated0.0% Widowed0.0% DivorcedWomen who gave birth in the past 12 months Now married:
42.3% (11)Unmarried:
57.7% (15)
Women who did not give birth in the past 12 months Now married:
63.1% (92)Unmarried:
36.9% (54)
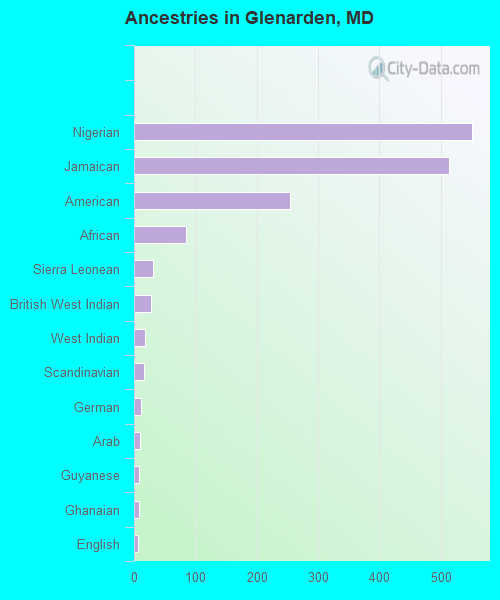
Ancestries in Glenarden
551 12.8% Nigerian514 11.9% Jamaican255 5.9% American84 1.9% African31 0.7% Sierra Leonean27 0.6% British West Indian18 0.4% West Indian16 0.4% Scandinavian12 0.3% German9 0.2% Arab8 0.2% Guyanese8 0.2% Ghanaian6 0.1% English5 0.1% Senegalese
Children Nativity (place of birth) in Glenarden
Children under 6 years - Living with two parents Both parents native 97 100.0% NativeBoth parents foreign-born 52 100.0% NativeChildren under 6 years - Living with one parent Native parent 108 100.0% NativeForeign-born parent 38 100.0% NativeChildren 6 to 17 years - Living with two parents Both parents native 116 99.9% Native0 0.1% Foreign-bornBoth parents foreign-born 386 92.5% Native31 7.5% Foreign-bornOne native, one foreign-born parent 212 100.0% NativeChildren 6 to 17 years - Living with one parent Native parent 278 100.0% NativeForeign-born parent 131 54.6% Native109 45.4% Foreign-born
Grandparents responsible for own grandchildren in Glenarden
Grandparents (30 to 59 years) Black or African American 33 44.0% Responsible for grandchildren42 56.0% Not responsible for grandchildrenOther race 19 100.0% Responsible for grandchildrenHispanic or Latino 18 100.0% Responsible for grandchildrenGrandparents (60 years and over) Black or African American 24 10.7% Responsible for grandchildren202 89.3% Not responsible for grandchildrenHispanic or Latino 29 100.0% Not responsible for grandchildren