Races in Glendale Heights, Illinois (IL) Detailed Stats
Data:
Races - White alone (%)
Races - White alone (% change since 2000)
Races - Black alone (%)
Races - Black alone (% change since 2000)
Races - American Indian alone (%)
Races - American Indian alone (% change since 2000)
Races - Asian alone (%)
Races - Asian alone (% change since 2000)
Races - Hispanic (%)
Races - Hispanic (% change since 2000)
Races - Native Hawaiian and Other Pacific Islander alone (%)
Races - Native Hawaiian and Other Pacific Islander alone (% change since 2000)
Races - Two or more races(%)
Races - Two or more races(% change since 2000)
Races - Other race alone (%)
Races - Other race alone (% change since 2000)
Racial diversity
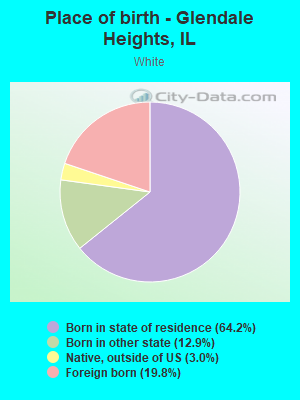
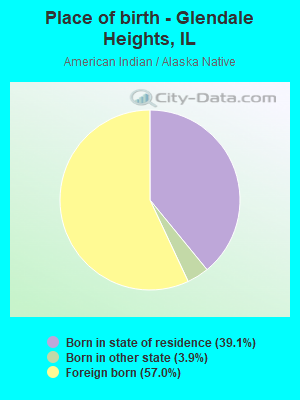
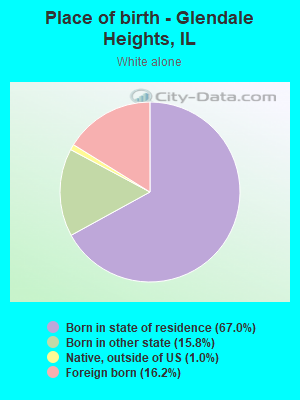
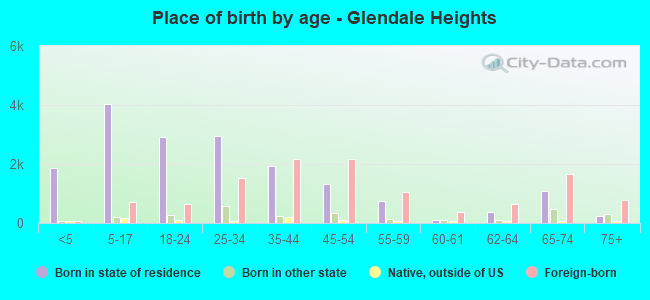
Place of birth - Born in state of residence (%)
Place of birth - Born in state of residence (%) - White
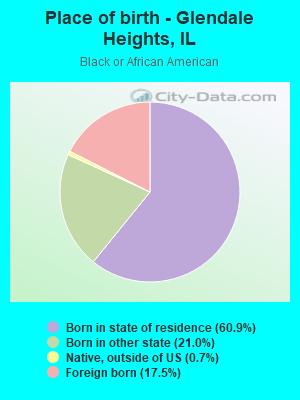
Place of birth - Born in state of residence (%) - Black or African American
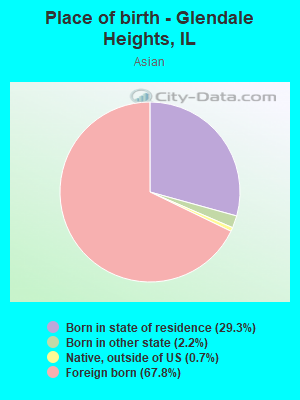
Place of birth - Born in state of residence (%) - Asian
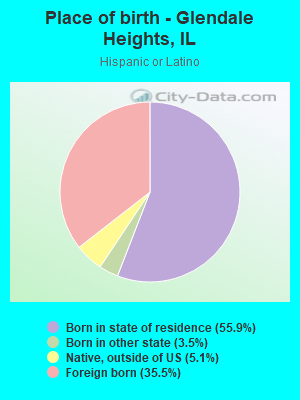
Place of birth - Born in state of residence (%) - Hispanic or Latino
Place of birth - Born in state of residence (%) - American Indian and Alaska Native
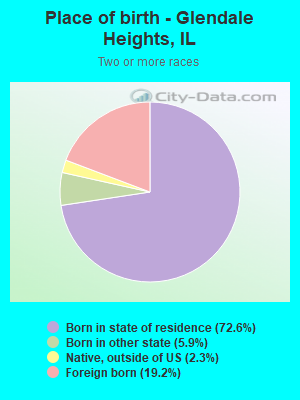
Place of birth - Born in state of residence (%) - Multirace
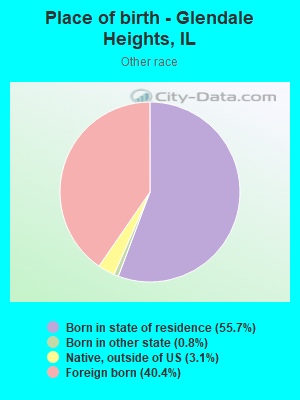
Place of birth - Born in state of residence (%) - Other Race
Place of birth - Born in other state (%)
Place of birth - Born in other state (%) - White
Place of birth - Born in other state (%) - Black or African American
Place of birth - Born in other state (%) - Asian
Place of birth - Born in other state (%) - Hispanic or Latino
Place of birth - Born in other state (%) - American Indian and Alaska Native
Place of birth - Born in other state (%) - Multirace
Place of birth - Born in other state (%) - Other Race
Place of birth - Native, outside of US (%)
Place of birth - Native, outside of US (%) - White
Place of birth - Native, outside of US (%) - Black or African American
Place of birth - Native, outside of US (%) - Asian
Place of birth - Native, outside of US (%) - Hispanic or Latino
Place of birth - Native, outside of US (%) - American Indian and Alaska Native
Place of birth - Native, outside of US (%) - Multirace
Place of birth - Native, outside of US (%) - Other Race
Place of birth - Foreign born (%)
Place of birth - Foreign born (%) - White
Place of birth - Foreign born (%) - Black or African American
Place of birth - Foreign born (%) - Asian
Place of birth - Foreign born (%) - Hispanic or Latino
Place of birth - Foreign born (%) - American Indian and Alaska Native
Place of birth - Foreign born (%) - Multirace
Place of birth - Foreign born (%) - Other Race
Residents speaking English at home (%)
Residents speaking English at home - Born in the United States (%)
Residents speaking English at home - Native, born elsewhere (%)
Residents speaking English at home - Foreign born (%)
Residents speaking Spanish at home (%)
Residents speaking Spanish at home - Born in the United States (%)
Residents speaking Spanish at home - Native, born elsewhere (%)
Residents speaking Spanish at home - Foreign born (%)
Residents speaking other language at home (%)
Residents speaking other language at home - Born in the United States (%)
Residents speaking other language at home - Native, born elsewhere (%)
Residents speaking other language at home - Foreign born (%)
Marital status - Never married (%)
Marital status - Now married (%)
Marital status - Separated (%)
Marital status - Widowed (%)
Marital status - Divorced (%)
Ancestries Reported - Arab (%)
Ancestries Reported - Czech (%)
Ancestries Reported - Danish (%)
Ancestries Reported - Dutch (%)
Ancestries Reported - English (%)
Ancestries Reported - French (%)
Ancestries Reported - French Canadian (%)
Ancestries Reported - German (%)
Ancestries Reported - Greek (%)
Ancestries Reported - Hungarian (%)
Ancestries Reported - Irish (%)
Ancestries Reported - Italian (%)
Ancestries Reported - Lithuanian (%)
Ancestries Reported - Norwegian (%)
Ancestries Reported - Polish (%)
Ancestries Reported - Portuguese (%)
Ancestries Reported - Russian (%)
Ancestries Reported - Scotch-Irish (%)
Ancestries Reported - Scottish (%)
Ancestries Reported - Slovak (%)
Ancestries Reported - Subsaharan African (%)
Ancestries Reported - Swedish (%)
Ancestries Reported - Swiss (%)
Ancestries Reported - Ukrainian (%)
Ancestries Reported - United States (%)
Ancestries Reported - Welsh (%)
Ancestries Reported - West Indian (%)
Ancestries Reported - Other (%)
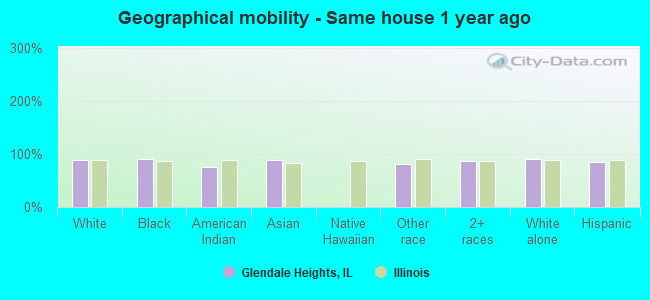
Geographical mobility - Same house 1 year ago (%)
Geographical mobility - Same house 1 year ago (%) - White
Geographical mobility - Same house 1 year ago (%) - Black or African American
Geographical mobility - Same house 1 year ago (%) - Asian
Geographical mobility - Same house 1 year ago (%) - Hispanic or Latino
Geographical mobility - Same house 1 year ago (%) - American Indian and Alaska Native
Geographical mobility - Same house 1 year ago (%) - Multirace
Geographical mobility - Same house 1 year ago (%) - Other Race
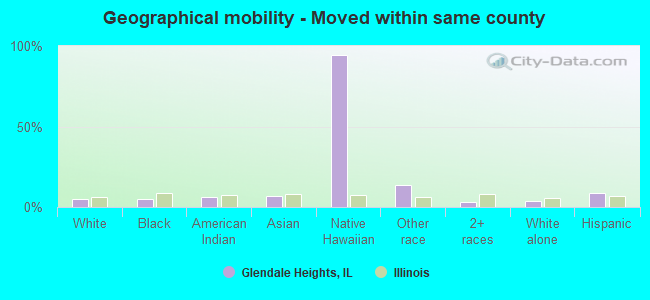
Geographical mobility - Moved within same county (%)
Geographical mobility - Moved within same county (%) - White
Geographical mobility - Moved within same county (%) - Black or African American
Geographical mobility - Moved within same county (%) - Asian
Geographical mobility - Moved within same county (%) - Hispanic or Latino
Geographical mobility - Moved within same county (%) - American Indian and Alaska Native
Geographical mobility - Moved within same county (%) - Multirace
Geographical mobility - Moved within same county (%) - Other Race
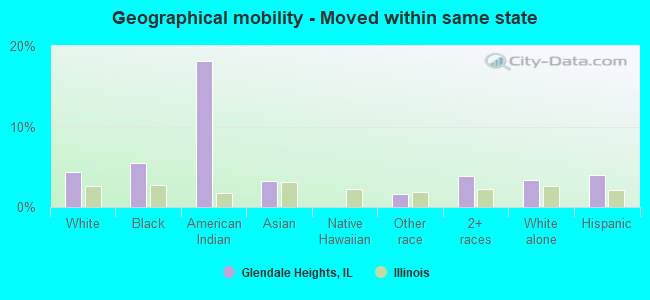
Geographical mobility - Moved from different county within same state (%)
Geographical mobility - Moved from different county within same state (%) - White
Geographical mobility - Moved from different county within same state (%) - Black or African American
Geographical mobility - Moved from different county within same state (%) - Asian
Geographical mobility - Moved from different county within same state (%) - Hispanic or Latino
Geographical mobility - Moved from different county within same state (%) - American Indian and Alaska Native
Geographical mobility - Moved from different county within same state (%) - Multirace
Geographical mobility - Moved from different county within same state (%) - Other Race
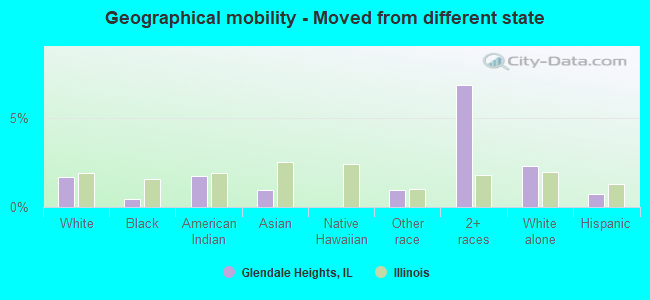
Geographical mobility - Moved from different state (%)
Geographical mobility - Moved from different state (%) - White
Geographical mobility - Moved from different state (%) - Black or African American
Geographical mobility - Moved from different state (%) - Asian
Geographical mobility - Moved from different state (%) - Hispanic or Latino
Geographical mobility - Moved from different state (%) - American Indian and Alaska Native
Geographical mobility - Moved from different state (%) - Multirace
Geographical mobility - Moved from different state (%) - Other Race
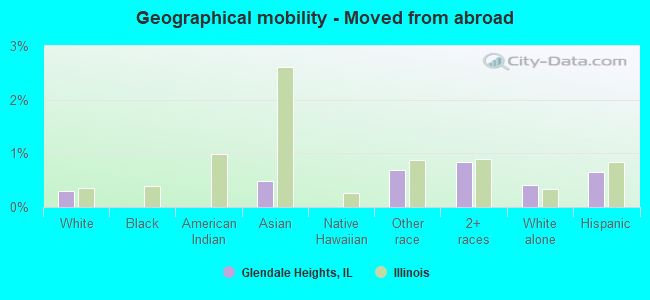
Geographical mobility - Moved from abroad (%)
Geographical mobility - Moved from abroad (%) - White
Geographical mobility - Moved from abroad (%) - Black or African American
Geographical mobility - Moved from abroad (%) - Asian
Geographical mobility - Moved from abroad (%) - Hispanic or Latino
Geographical mobility - Moved from abroad (%) - American Indian and Alaska Native
Geographical mobility - Moved from abroad (%) - Multirace
Geographical mobility - Moved from abroad (%) - Other Race
Place of birth for the foreign-born population - Ireland (%)
Place of birth for the foreign-born population - Denmark (%)
Place of birth for the foreign-born population - Norway (%)
Place of birth for the foreign-born population - Sweden (%)
Place of birth for the foreign-born population - United Kingdom (%)
Place of birth for the foreign-born population - England (%)
Place of birth for the foreign-born population - Scotland (%)
Place of birth for the foreign-born population - Other Northern Europe (%)
Place of birth for the foreign-born population - Austria (%)
Place of birth for the foreign-born population - Belgium (%)
Place of birth for the foreign-born population - France (%)
Place of birth for the foreign-born population - Germany (%)
Place of birth for the foreign-born population - Netherlands (%)
Place of birth for the foreign-born population - Switzerland (%)
Place of birth for the foreign-born population - Other Western Europe (%)
Place of birth for the foreign-born population - Greece (%)
Place of birth for the foreign-born population - Italy (%)
Place of birth for the foreign-born population - Portugal (%)
Place of birth for the foreign-born population - Spain (%)
Place of birth for the foreign-born population - Other Southern Europe (%)
Place of birth for the foreign-born population - Albania (%)
Place of birth for the foreign-born population - Belarus (%)
Place of birth for the foreign-born population - Bosnia and Herzegovina (%)
Place of birth for the foreign-born population - Bulgaria (%)
Place of birth for the foreign-born population - Croatia (%)
Place of birth for the foreign-born population - Czechoslovakia (%)
Place of birth for the foreign-born population - Hungary (%)
Place of birth for the foreign-born population - Latvia (%)
Place of birth for the foreign-born population - Lithuania (%)
Place of birth for the foreign-born population - North Macedonia (Macedonia) (%)
Place of birth for the foreign-born population - Moldova (%)
Place of birth for the foreign-born population - Poland (%)
Place of birth for the foreign-born population - Romania (%)
Place of birth for the foreign-born population - Russia (%)
Place of birth for the foreign-born population - Serbia (%)
Place of birth for the foreign-born population - Ukraine (%)
Place of birth for the foreign-born population - Other Eastern Europe (%)
Place of birth for the foreign-born population - China (%)
Place of birth for the foreign-born population - Hong Kong (%)
Place of birth for the foreign-born population - Taiwan (%)
Place of birth for the foreign-born population - Japan (%)
Place of birth for the foreign-born population - Korea (%)
Place of birth for the foreign-born population - Other Eastern Asia (%)
Place of birth for the foreign-born population - Afghanistan (%)
Place of birth for the foreign-born population - Bangladesh (%)
Place of birth for the foreign-born population - India (%)
Place of birth for the foreign-born population - Iran (%)
Place of birth for the foreign-born population - Kazakhstan (%)
Place of birth for the foreign-born population - Nepal (%)
Place of birth for the foreign-born population - Pakistan (%)
Place of birth for the foreign-born population - Sri Lanka (%)
Place of birth for the foreign-born population - Uzbekistan (%)
Place of birth for the foreign-born population - Other South Central Asia (%)
Place of birth for the foreign-born population - Burma (%)
Place of birth for the foreign-born population - Cambodia (%)
Place of birth for the foreign-born population - Indonesia (%)
Place of birth for the foreign-born population - Laos (%)
Place of birth for the foreign-born population - Malaysia (%)
Place of birth for the foreign-born population - Philippines (%)
Place of birth for the foreign-born population - Singapore (%)
Place of birth for the foreign-born population - Thailand (%)
Place of birth for the foreign-born population - Vietnam (%)
Place of birth for the foreign-born population - Other South Eastern Asia (%)
Place of birth for the foreign-born population - Armenia (%)
Place of birth for the foreign-born population - Iraq (%)
Place of birth for the foreign-born population - Israel (%)
Place of birth for the foreign-born population - Jordan (%)
Place of birth for the foreign-born population - Kuwait (%)
Place of birth for the foreign-born population - Lebanon (%)
Place of birth for the foreign-born population - Saudi Arabia (%)
Place of birth for the foreign-born population - Syria (%)
Place of birth for the foreign-born population - Turkey (%)
Place of birth for the foreign-born population - Yemen (%)
Place of birth for the foreign-born population - Other Western Asia (%)
Place of birth for the foreign-born population - Eritrea (%)
Place of birth for the foreign-born population - Ethiopia (%)
Place of birth for the foreign-born population - Kenya (%)
Place of birth for the foreign-born population - Somalia (%)
Place of birth for the foreign-born population - Uganda (%)
Place of birth for the foreign-born population - Zimbabwe (%)
Place of birth for the foreign-born population - Other Eastern Africa (%)
Place of birth for the foreign-born population - Cameroon (%)
Place of birth for the foreign-born population - Congo (%)
Place of birth for the foreign-born population - Democratic Republic of Congo (Zaire) (%)
Place of birth for the foreign-born population - Other Middle Africa (%)
Place of birth for the foreign-born population - Egypt (%)
Place of birth for the foreign-born population - Morocco (%)
Place of birth for the foreign-born population - Sudan (%)
Place of birth for the foreign-born population - Other Northern Africa (%)
Place of birth for the foreign-born population - South Africa (%)
Place of birth for the foreign-born population - Other Southern Africa (%)
Place of birth for the foreign-born population - Cabo Verde (%)
Place of birth for the foreign-born population - Ghana (%)
Place of birth for the foreign-born population - Liberia (%)
Place of birth for the foreign-born population - Nigeria (%)
Place of birth for the foreign-born population - Senegal (%)
Place of birth for the foreign-born population - Sierra Leone (%)
Place of birth for the foreign-born population - Other Western Africa (%)
Place of birth for the foreign-born population - Australia (%)
Place of birth for the foreign-born population - New Zealand (%)
Place of birth for the foreign-born population - Fiji (%)
Place of birth for the foreign-born population - Micronesia (%)
Place of birth for the foreign-born population - Bahamas (%)
Place of birth for the foreign-born population - Barbados (%)
Place of birth for the foreign-born population - Cuba (%)
Place of birth for the foreign-born population - Dominica (%)
Place of birth for the foreign-born population - Dominican Republic (%)
Place of birth for the foreign-born population - Grenada (%)
Place of birth for the foreign-born population - Haiti (%)
Place of birth for the foreign-born population - Jamaica (%)
Place of birth for the foreign-born population - St. Vincent and the Grenadines (%)
Place of birth for the foreign-born population - Trinidad and Tobago (%)
Place of birth for the foreign-born population - West Indies (%)
Place of birth for the foreign-born population - Other Caribbean (%)
Place of birth for the foreign-born population - Belize (%)
Place of birth for the foreign-born population - Costa Rica (%)
Place of birth for the foreign-born population - El Salvador (%)
Place of birth for the foreign-born population - Guatemala (%)
Place of birth for the foreign-born population - Honduras (%)
Place of birth for the foreign-born population - Mexico (%)
Place of birth for the foreign-born population - Nicaragua (%)
Place of birth for the foreign-born population - Panama (%)
Place of birth for the foreign-born population - Other Central America (%)
Place of birth for the foreign-born population - Argentina (%)
Place of birth for the foreign-born population - Bolivia (%)
Place of birth for the foreign-born population - Brazil (%)
Place of birth for the foreign-born population - Chile (%)
Place of birth for the foreign-born population - Colombia (%)
Place of birth for the foreign-born population - Ecuador (%)
Place of birth for the foreign-born population - Guyana (%)
Place of birth for the foreign-born population - Peru (%)
Place of birth for the foreign-born population - Uruguay (%)
Place of birth for the foreign-born population - Venezuela (%)
Place of birth for the foreign-born population - Other South America (%)
Place of birth for the foreign-born population - Canada (%)
Place of birth for the foreign-born population - Other Northern America (%)
Place of birth for the foreign-born population - Other (%)
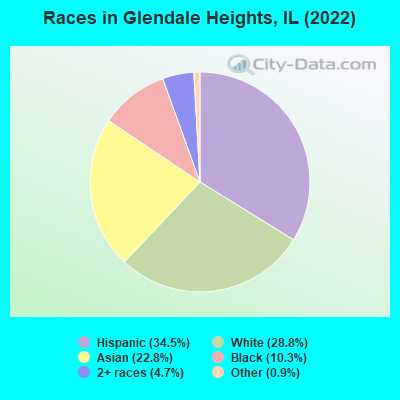
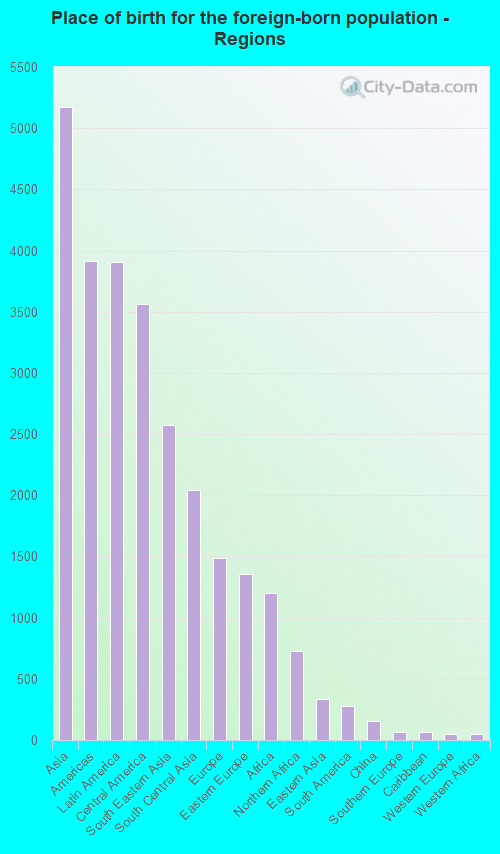
According to 2022 data, the most numerous races in Glendale Heights, IL are White alone (9,429 residents), Hispanic (11,303 residents), and Black alone (3,364 residents). 43.0% of Glendale Heights residents speak English at home. 36.0% of Glendale Heights, IL residents are foreign-born (15.6% born in Asia, 11.8% born in Latin America, 4.5% born in Europe, 3.6% born in Africa), which is 61.1% greater than the foreign-born rate of 14.0% across the entire state of Illinois.
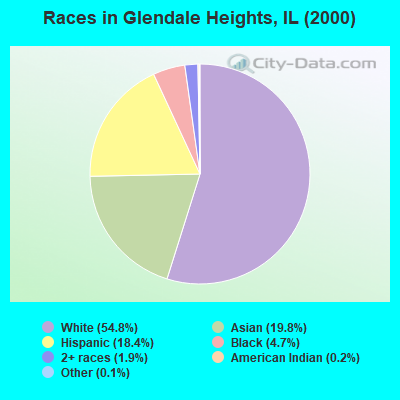
Race distribution in Glendale Heights
2000 2022
8,424,140 67.8% White alone 1,856,152 14.9% Black alone 1,530,262 12.3% Hispanic 419,916 3.4% Asian alone 153,996 1.2% Two or more races 13,479 0.1% Other race alone 18,232 0.1% American Indian alone 3,116 0.03% Native Hawaiian and Other
7,356,301 58.5% White alone 2,299,726 18.3% Hispanic 1,660,423 13.2% Black alone 747,296 5.9% Asian alone 458,599 3.6% Two or more races 45,386 0.4% Other race alone 10,405 0.08% American Indian alone 3,896 0.03% Native Hawaiian and Other
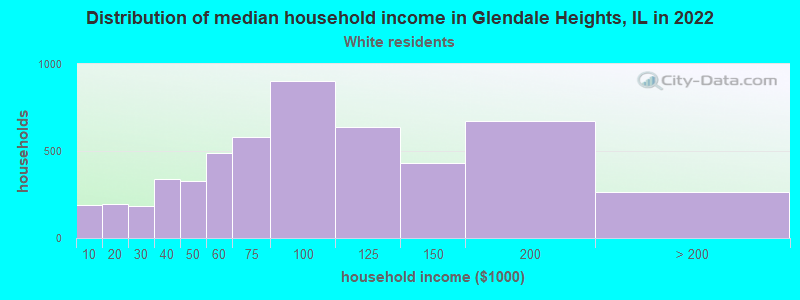
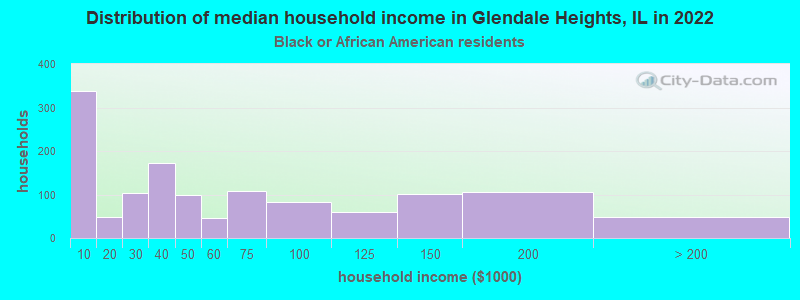
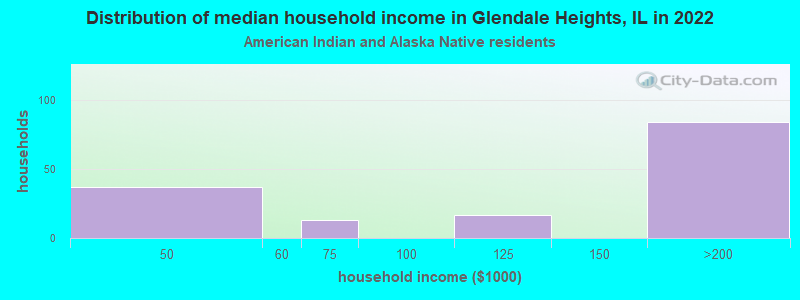
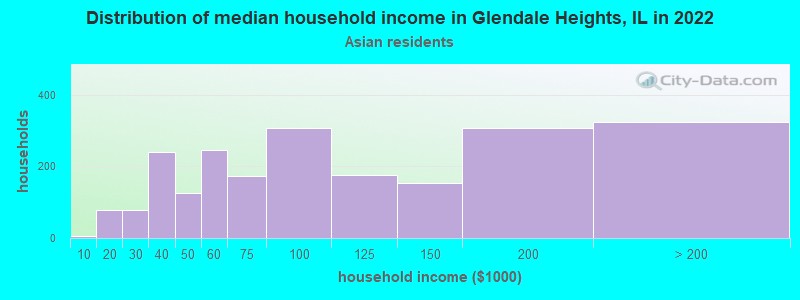
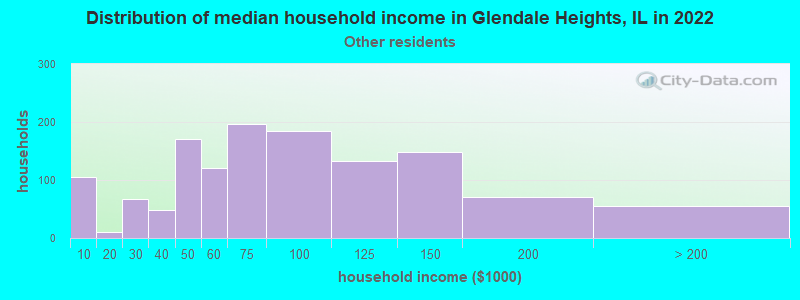
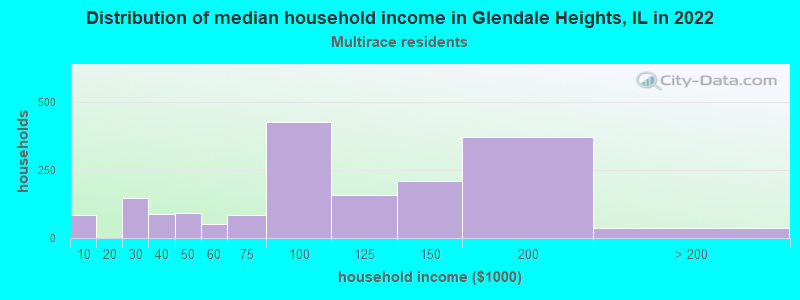
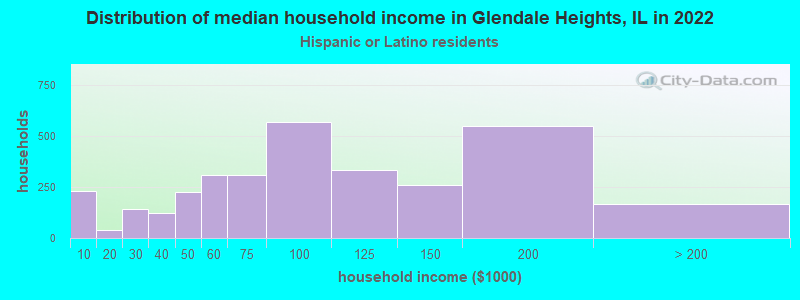
Income and house value in Glendale Heights Median household income in 2022 $80,826 White non-Hispanic householders$57,028 Black householders$138,417 American Indian and Alaska Native householders$86,339 Asian householders$66,711 Some other race householders$91,952 Two or more races householders$82,148 Hispanic or Latino race householdersMedian 2022 house value $238,984 White Non-Hispanic householders$240,683 Black or African American householders$267,519 American Indian or Alaska Native householders $257,328 Asian householders$594,488 Native Hawaiian and other Pacific Islander householders$258,008 Some other race householders$239,663 Two or more races householders$249,005 Hispanic or Latino householders
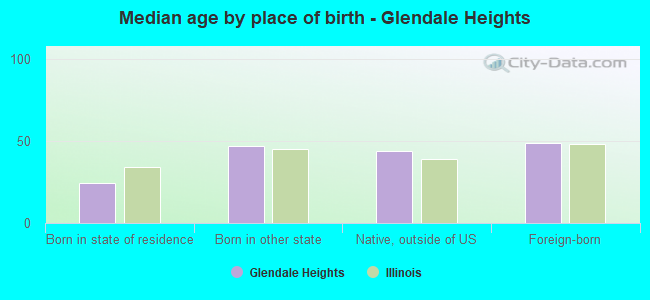
Median age by race in Glendale Heights
39.3 Median age for White residents39.2 39.4 29.1 Median age for Black or African American residents29.6 29.2 35.8 Median age for American Indian / Alaska Native residents37.9 18.6 40.2 Median age for Asian residents35.1 44.0 -593,236,714.4 Median age for Native Hawaiian / Pacific Islander residents-658,536,584.7 -576,015,108.0 31.6 Median age for Other race residents30.5 34.1 33.3 Median age for Two or more races residents29.3 31.1 43.3 Median age for White alone residents42.4 44.2 31.2 Median age for Hispanic or Latino residents31.9 31.0
Owner/renter occupied households by race in Glendale Heights
House owners and renters - White residents 3,650 72.0% Owner occupied1,420 28.0% Renter occupiedHouse owners and renters - Black or African American residents 321 24.1% Owner occupied1,010 75.9% Renter occupiedHouse owners and renters - American Indian / Alaska Native residents 15 12.5% Owner occupied102 87.5% Renter occupiedHouse owners and renters - Asian residents 1,917 80.7% Owner occupied458 19.3% Renter occupiedHouse owners and renters - Other race residents 900 63.6% Owner occupied514 36.4% Renter occupiedHouse owners and renters - Two or more races residents 1,362 76.6% Owner occupied415 23.4% Renter occupiedHouse owners and renters - White alone residents 3,089 70.8% Owner occupied1,271 29.2% Renter occupiedHouse owners and renters - Hispanic or Latino residents 2,167 66.9% Owner occupied1,075 33.1% Renter occupied
Language usage in Glendale Heights
English speakers - Total 43.0% of residents of Glendale Heights speak English at home.
29.5% of residents speak Spanish at home 5,145 56.5% Speak English very well3,954 43.5% Speak English less than very well28.5% of residents speak other language at home 4,991 56.8% Speak English very well3,798 43.2% Speak English less than very well
English speakers - Born in the United States 81.1% of residents of Glendale Heights speak English at home.
9.4% of residents speak Spanish at home 243 94.6% Speak English very well14 5.4% Speak English less than very well8.3% of residents speak other language at home 202 88.2% Speak English very well27 11.8% Speak English less than very well
English speakers - Native, born elsewhere 29.7% of residents of Glendale Heights speak English at home.
64.1% of residents speak Spanish at home 265 54.6% Speak English very well220 45.4% Speak English less than very well11.4% of residents speak other language at home 81 94.2% Speak English very well5 5.8% Speak English less than very well
English speakers - Foreign-born 6.2% of residents of Glendale Heights speak English at home.
33.4% of residents speak Spanish at home 828 21.1% Speak English very well3,093 78.9% Speak English less than very well62.4% of residents speak other language at home 3,673 50.2% Speak English very well3,640 49.8% Speak English less than very well
White (Caucasian) - Speak only English Native:
82.2% (7,629)Foreign-born:
9.2% (225)
White (Caucasian) - Speak another language Native:
14.5% (1,348)Foreign-born:
89.5% (2,182)
Black or African American - Speak only English Native:
92.2% (2,029)Foreign-born:
6.0% (31)
Black or African American - Speak another language Native:
6.6% (145)Foreign-born:
100.0% (520)
American Indian / Alaska Native - Speak only English Native:
16.4% (38)Foreign-born:
2.8% (8)
American Indian / Alaska Native - Speak another language Native:
87.9% (205)Foreign-born:
100.0% (306)
Asian - Speak only English Native:
52.4% (1,069)Foreign-born:
6.1% (313)
Asian - Speak another language Native:
46.0% (940)Foreign-born:
94.4% (4,833)
Other race - Speak only English Native:
21.4% (519)Foreign-born:
0.4% (8)
Other race - Speak another language Native:
75.9% (1,839)Foreign-born:
100.0% (1,901)
Two or more races - Speak only English Native:
39.7% (1,835)Foreign-born:
11.7% (144)
Two or more races - Speak another language Native:
65.0% (3,004)Foreign-born:
88.1% (1,079)
White alone - Speak only English Native:
93.8% (7,128)Foreign-born:
8.7% (132)
White alone - Speak another language Native:
6.0% (460)Foreign-born:
90.9% (1,385)
Hispanic or Latino - Speak only English Native:
21.8% (1,424)Foreign-born:
5.7% (230)
Hispanic or Latino - Speak another language Native:
79.1% (5,164)Foreign-born:
94.5% (3,809)
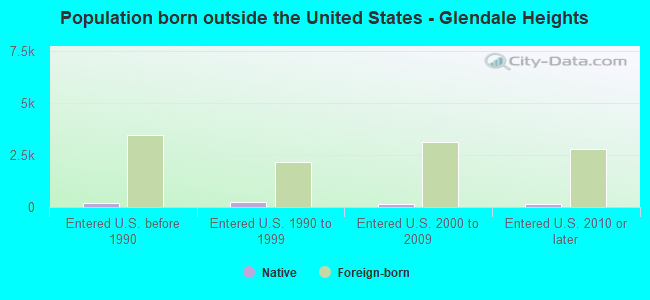
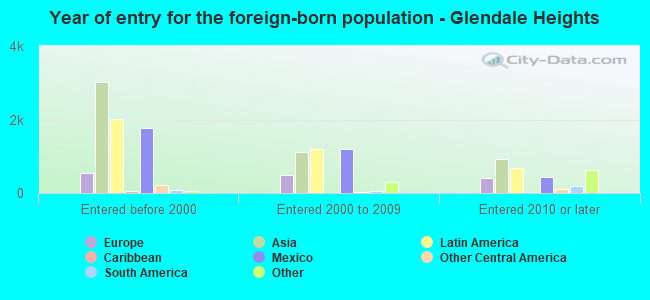
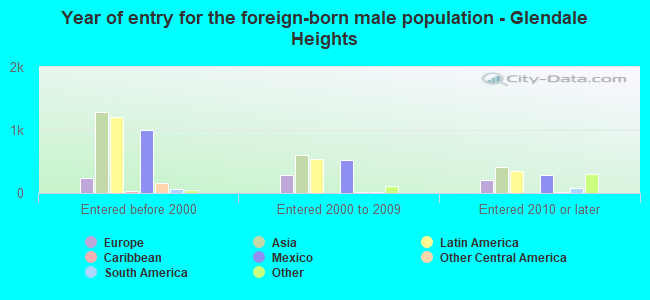
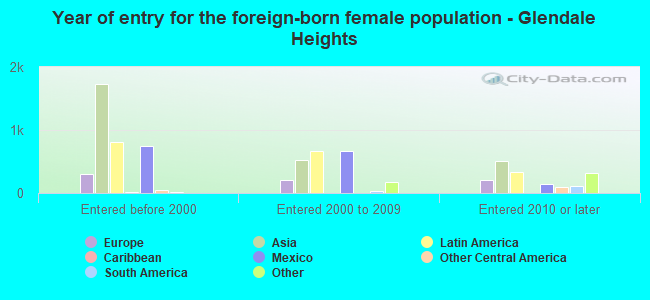
Foreign-born residents in Glendale Heights 11,782 residents are foreign born (15.6% Asia , 11.8% Latin America , 4.5% Europe , 3.6% Africa ).
This city:
36.0%Illinois:
14.1%
Marital status for residents in Glendale Heights Marital status - White (Caucasian) population 15 years and over
Males 38.5% Never married49.1% Now married0.9% Separated2.8% Widowed8.8% DivorcedFemales 30.9% Never married49.4% Now married2.1% Separated6.2% Widowed11.4% DivorcedWomen who gave birth in the past 12 months Now married:
45.7% (47)Unmarried:
54.3% (56)
Women who did not give birth in the past 12 months Now married:
40.7% (1,161)Unmarried:
59.3% (1,688)
Marital status - Black or African American population 15 years and over
Males 47.1% Never married38.5% Now married3.8% Separated0.0% Widowed10.7% DivorcedFemales 39.3% Never married34.5% Now married0.9% Separated8.2% Widowed17.1% DivorcedWomen who gave birth in the past 12 months Now married:
6.2% (4)Unmarried:
93.8% (61)
Women who did not give birth in the past 12 months Now married:
48.9% (336)Unmarried:
51.1% (351)
Marital status - American Indian / Alaska Native population 15 years and over
Males 50.4% Never married49.6% Now married0.0% Separated0.0% Widowed0.0% DivorcedFemales 54.6% Never married45.4% Now married0.0% Separated0.0% Widowed0.0% DivorcedWomen who did not give birth in the past 12 months Now married:
43.8% (123)Unmarried:
56.2% (158)
Marital status - Asian population 15 years and over
Males 35.3% Never married55.8% Now married1.5% Separated1.2% Widowed6.3% DivorcedFemales 27.8% Never married49.6% Now married6.2% Separated4.4% Widowed12.1% DivorcedWomen who gave birth in the past 12 months Now married:
100.0% (98)Unmarried:
0.0% (0)
Women who did not give birth in the past 12 months Now married:
47.3% (840)Unmarried:
52.7% (937)
Marital status - Other race population 15 years and over
Males 49.6% Never married44.2% Now married1.0% Separated0.7% Widowed4.5% DivorcedFemales 24.3% Never married64.4% Now married0.0% Separated0.0% Widowed11.3% DivorcedWomen who gave birth in the past 12 months Now married:
100.0% (74)Unmarried:
0.0% (0)
Women who did not give birth in the past 12 months Now married:
53.4% (587)Unmarried:
46.6% (513)
Marital status - Two or more races population 15 years and over
Males 55.4% Never married33.5% Now married0.0% Separated3.8% Widowed7.3% DivorcedFemales 44.6% Never married34.7% Now married7.7% Separated8.1% Widowed4.8% DivorcedWomen who gave birth in the past 12 months Now married:
24.0% (17)Unmarried:
76.0% (54)
Women who did not give birth in the past 12 months Now married:
30.2% (534)Unmarried:
69.8% (1,236)
Marital status - White alone, not Hispanic / Latino population 15 years and over
Males 38.6% Never married47.7% Now married0.8% Separated3.7% Widowed9.2% DivorcedFemales 31.3% Never married47.2% Now married1.4% Separated7.0% Widowed13.1% DivorcedWomen who gave birth in the past 12 months Now married:
18.2% (13)Unmarried:
81.8% (60)
Women who did not give birth in the past 12 months Now married:
36.2% (790)Unmarried:
63.8% (1,393)
Marital status - Hispanic or Latino population 15 years and over
Males 48.4% Never married43.5% Now married0.7% Separated1.6% Widowed5.8% DivorcedFemales 35.2% Never married50.1% Now married4.4% Separated4.0% Widowed6.2% DivorcedWomen who gave birth in the past 12 months Now married:
73.2% (108)Unmarried:
26.8% (39)
Women who did not give birth in the past 12 months Now married:
45.0% (1,359)Unmarried:
55.0% (1,658)
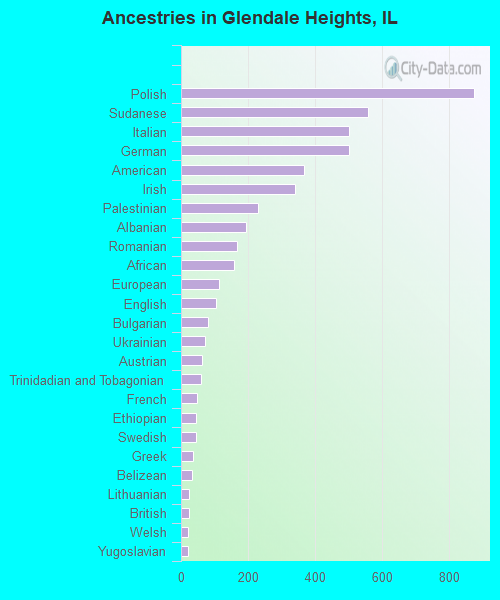
Ancestries in Glendale Heights
875 4.3% Polish559 2.8% Sudanese501 2.5% Italian500 2.5% German368 1.8% American339 1.7% Irish230 1.1% Palestinian193 1.0% Albanian168 0.8% Romanian157 0.8% African114 0.6% European105 0.5% English82 0.4% Bulgarian71 0.4% Ukrainian64 0.3% Austrian59 0.3% Trinidadian and Tobagonian47 0.2% French44 0.2% Ethiopian44 0.2% Swedish37 0.2% Greek33 0.2% Belizean24 0.1% Lithuanian23 0.1% British20 0.10% Welsh20 0.10% Yugoslavian18 0.09% Eastern European18 0.09% Norwegian17 0.08% Russian16 0.08% Turkish14 0.07% Scotch-Irish13 0.06% French Canadian13 0.06% Hungarian13 0.06% Scottish12 0.06% Northern European11 0.05% Danish10 0.05% Brazilian10 0.05% Dutch9 0.04% Czech3 0.01% Finnish
Geographical mobility in Glendale Heights Same house 1 year ago 10,987 88.6% White (Caucasian)3,157 90.8% Black or African American527 75.5% American Indian / Alaska Native6,539 87.8% Asian3,736 80.7% Other race5,366 86.3% Two or more races8,503 90.6% White alone, not Hispanic / Latino9,479 84.7% Hispanic or LatinoMoved within same county 621 5.0% White / Caucasian166 4.8% Black or African American43 6.1% American Indian / Alaska Native511 6.9% Asian35 94.6% Native Hawaiian / Pacific Islander627 13.5% Other race187 3.0% Two or more races325 3.5% White alone, not Hispanic / Latino943 8.4% Hispanic or LatinoMoved within same state 534 4.3% White / Caucasian188 5.4% Black or African American126 18.1% American Indian / Alaska Native242 3.2% Asian76 1.7% Other race239 3.8% Two or more races313 3.3% White alone, not Hispanic / Latino439 3.9% Hispanic or LatinoMoved from different state 207 1.7% White / Caucasian15 0.4% Black or African American12 1.8% American Indian / Alaska Native72 1.0% Asian44 1.0% Other race424 6.8% Two or more races215 2.3% White alone, not Hispanic / Latino84 0.7% Hispanic or LatinoMoved from abroad 36 0.3% White37 0.5% Asian32 0.7% Other race52 0.8% Two or more races39 0.4% White alone, not Hispanic / Latino74 0.7% Hispanic or Latino
Children Nativity (place of birth) in Glendale Heights
Children under 6 years - Living with two parents Both parents native 640 100.0% NativeBoth parents foreign-born 681 100.0% NativeOne native, one foreign-born parent 194 100.0% NativeChildren under 6 years - Living with one parent Native parent 537 100.0% NativeForeign-born parent 160 91.5% Native15 8.5% Foreign-bornChildren 6 to 17 years - Living with two parents Both parents native 918 100.0% NativeBoth parents foreign-born 987 56.9% Native748 43.1% Foreign-bornOne native, one foreign-born parent 492 100.0% NativeChildren 6 to 17 years - Living with one parent Native parent 788 100.0% NativeForeign-born parent 624 50.9% Native602 49.1% Foreign-born
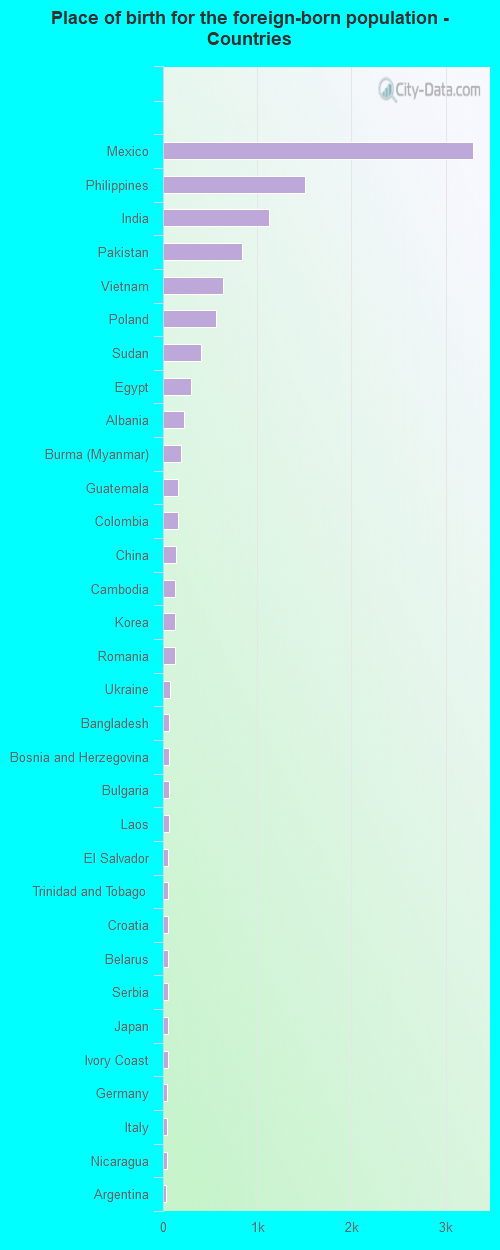
Place of birth for residents in Glendale Heights 5,176 Asia3,914 Americas3,907 Latin America3,564 Central America2,575 South Eastern Asia2,042 South Central Asia1,491 Europe1,353 Eastern Europe1,199 Africa724 Northern Africa332 Eastern Asia276 South America153 China69 Southern Europe66 Caribbean53 Western Europe48 Western Africa41 Western Asia21 Eastern Africa16 Northern Europe7 Northern America3,296 Mexico1,504 Philippines1,122 India838 Pakistan632 Vietnam563 Poland408 Sudan297 Egypt227 Albania187 Burma (Myanmar)161 Guatemala157 Colombia133 China132 Cambodia131 Korea128 Romania76 Ukraine68 Bangladesh68 Bosnia and Herzegovina66 Bulgaria64 Laos58 El Salvador56 Trinidad and Tobago54 Croatia53 Belarus52 Serbia48 Japan48 Ivory Coast47 Germany45 Italy40 Nicaragua33 Argentina29 Thailand28 Jordan28 Peru24 Spain24 Lithuania20 Taiwan18 Morocco18 Ecuador16 England15 Indonesia14 Moldova14 Eritrea13 Russia12 Latvia12 Venezuela10 Malaysia10 Saudi Arabia10 Cuba10 Brazil9 Kazakhstan8 Chile7 Costa Rica7 Canada7 Kenya6 Belgium4 Uzbekistan3 Turkey1 Honduras
Grandparents responsible for own grandchildren in Glendale Heights
Grandparents (30 to 59 years) White / Caucasian 21 24.1% Responsible for grandchildren66 75.9% Not responsible for grandchildrenBlack or African American 47 100.0% Not responsible for grandchildrenAsian 60 100.0% Not responsible for grandchildrenTwo or more races 171 100.0% Not responsible for grandchildrenWhite alone, not Hispanic / Latino 18 42.6% Responsible for grandchildren24 57.4% Not responsible for grandchildrenHispanic or Latino 3 1.5% Responsible for grandchildren164 98.5% Not responsible for grandchildrenGrandparents (60 years and over) White / Caucasian 23 8.1% Responsible for grandchildren258 91.9% Not responsible for grandchildrenAsian 5 1.6% Responsible for grandchildren297 98.4% Not responsible for grandchildrenTwo or more races 244 95.6% Responsible for grandchildren11 4.4% Not responsible for grandchildrenWhite alone, not Hispanic / Latino 10 4.1% Responsible for grandchildren225 95.9% Not responsible for grandchildrenHispanic or Latino 239 47.3% Responsible for grandchildren267 52.7% Not responsible for grandchildren