Races in Goose Creek, South Carolina (SC) Detailed Stats
Data:
Races - White alone (%)
Races - White alone (% change since 2000)
Races - Black alone (%)
Races - Black alone (% change since 2000)
Races - American Indian alone (%)
Races - American Indian alone (% change since 2000)
Races - Asian alone (%)
Races - Asian alone (% change since 2000)
Races - Hispanic (%)
Races - Hispanic (% change since 2000)
Races - Native Hawaiian and Other Pacific Islander alone (%)
Races - Native Hawaiian and Other Pacific Islander alone (% change since 2000)
Races - Two or more races(%)
Races - Two or more races(% change since 2000)
Races - Other race alone (%)
Races - Other race alone (% change since 2000)
Racial diversity
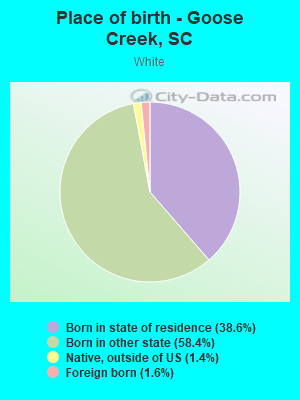
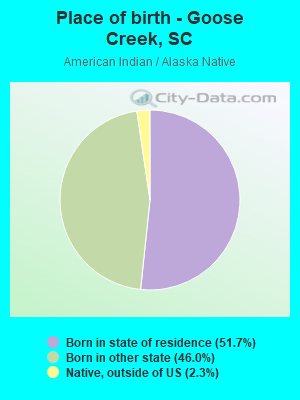
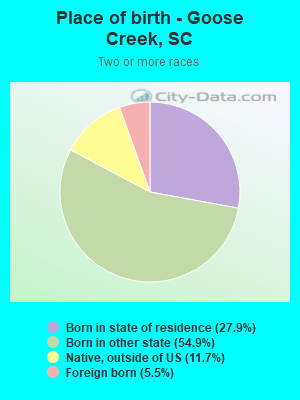
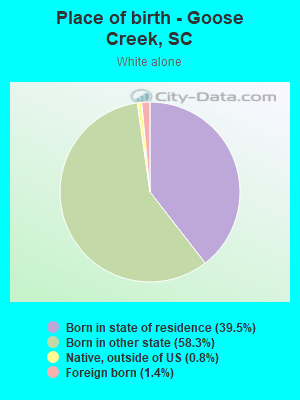
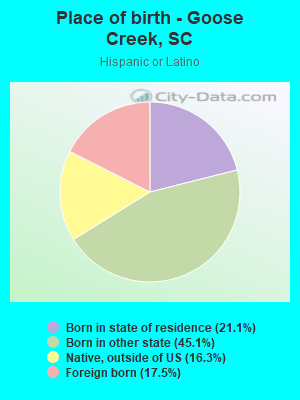
Place of birth - Born in state of residence (%)
Place of birth - Born in state of residence (%) - White
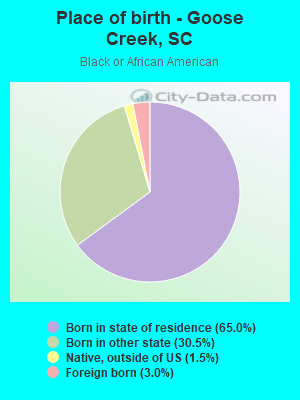
Place of birth - Born in state of residence (%) - Black or African American
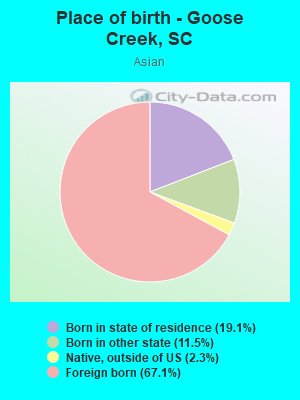
Place of birth - Born in state of residence (%) - Asian
Place of birth - Born in state of residence (%) - Hispanic or Latino
Place of birth - Born in state of residence (%) - American Indian and Alaska Native
Place of birth - Born in state of residence (%) - Multirace
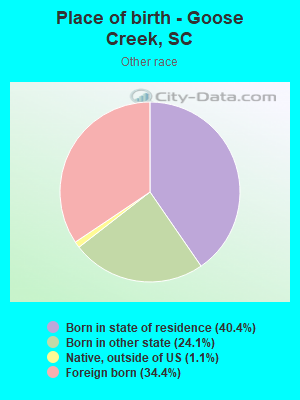
Place of birth - Born in state of residence (%) - Other Race
Place of birth - Born in other state (%)
Place of birth - Born in other state (%) - White
Place of birth - Born in other state (%) - Black or African American
Place of birth - Born in other state (%) - Asian
Place of birth - Born in other state (%) - Hispanic or Latino
Place of birth - Born in other state (%) - American Indian and Alaska Native
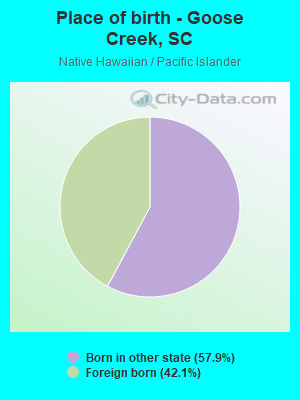
Place of birth - Born in other state (%) - Multirace
Place of birth - Born in other state (%) - Other Race
Place of birth - Native, outside of US (%)
Place of birth - Native, outside of US (%) - White
Place of birth - Native, outside of US (%) - Black or African American
Place of birth - Native, outside of US (%) - Asian
Place of birth - Native, outside of US (%) - Hispanic or Latino
Place of birth - Native, outside of US (%) - American Indian and Alaska Native
Place of birth - Native, outside of US (%) - Multirace
Place of birth - Native, outside of US (%) - Other Race
Place of birth - Foreign born (%)
Place of birth - Foreign born (%) - White
Place of birth - Foreign born (%) - Black or African American
Place of birth - Foreign born (%) - Asian
Place of birth - Foreign born (%) - Hispanic or Latino
Place of birth - Foreign born (%) - American Indian and Alaska Native
Place of birth - Foreign born (%) - Multirace
Place of birth - Foreign born (%) - Other Race
Residents speaking English at home (%)
Residents speaking English at home - Born in the United States (%)
Residents speaking English at home - Native, born elsewhere (%)
Residents speaking English at home - Foreign born (%)
Residents speaking Spanish at home (%)
Residents speaking Spanish at home - Born in the United States (%)
Residents speaking Spanish at home - Native, born elsewhere (%)
Residents speaking Spanish at home - Foreign born (%)
Residents speaking other language at home (%)
Residents speaking other language at home - Born in the United States (%)
Residents speaking other language at home - Native, born elsewhere (%)
Residents speaking other language at home - Foreign born (%)
Marital status - Never married (%)
Marital status - Now married (%)
Marital status - Separated (%)
Marital status - Widowed (%)
Marital status - Divorced (%)
Ancestries Reported - Arab (%)
Ancestries Reported - Czech (%)
Ancestries Reported - Danish (%)
Ancestries Reported - Dutch (%)
Ancestries Reported - English (%)
Ancestries Reported - French (%)
Ancestries Reported - French Canadian (%)
Ancestries Reported - German (%)
Ancestries Reported - Greek (%)
Ancestries Reported - Hungarian (%)
Ancestries Reported - Irish (%)
Ancestries Reported - Italian (%)
Ancestries Reported - Lithuanian (%)
Ancestries Reported - Norwegian (%)
Ancestries Reported - Polish (%)
Ancestries Reported - Portuguese (%)
Ancestries Reported - Russian (%)
Ancestries Reported - Scotch-Irish (%)
Ancestries Reported - Scottish (%)
Ancestries Reported - Slovak (%)
Ancestries Reported - Subsaharan African (%)
Ancestries Reported - Swedish (%)
Ancestries Reported - Swiss (%)
Ancestries Reported - Ukrainian (%)
Ancestries Reported - United States (%)
Ancestries Reported - Welsh (%)
Ancestries Reported - West Indian (%)
Ancestries Reported - Other (%)
Geographical mobility - Same house 1 year ago (%)
Geographical mobility - Same house 1 year ago (%) - White
Geographical mobility - Same house 1 year ago (%) - Black or African American
Geographical mobility - Same house 1 year ago (%) - Asian
Geographical mobility - Same house 1 year ago (%) - Hispanic or Latino
Geographical mobility - Same house 1 year ago (%) - American Indian and Alaska Native
Geographical mobility - Same house 1 year ago (%) - Multirace
Geographical mobility - Same house 1 year ago (%) - Other Race
Geographical mobility - Moved within same county (%)
Geographical mobility - Moved within same county (%) - White
Geographical mobility - Moved within same county (%) - Black or African American
Geographical mobility - Moved within same county (%) - Asian
Geographical mobility - Moved within same county (%) - Hispanic or Latino
Geographical mobility - Moved within same county (%) - American Indian and Alaska Native
Geographical mobility - Moved within same county (%) - Multirace
Geographical mobility - Moved within same county (%) - Other Race
Geographical mobility - Moved from different county within same state (%)
Geographical mobility - Moved from different county within same state (%) - White
Geographical mobility - Moved from different county within same state (%) - Black or African American
Geographical mobility - Moved from different county within same state (%) - Asian
Geographical mobility - Moved from different county within same state (%) - Hispanic or Latino
Geographical mobility - Moved from different county within same state (%) - American Indian and Alaska Native
Geographical mobility - Moved from different county within same state (%) - Multirace
Geographical mobility - Moved from different county within same state (%) - Other Race
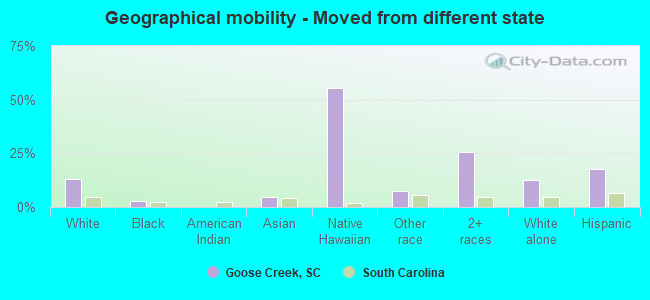
Geographical mobility - Moved from different state (%)
Geographical mobility - Moved from different state (%) - White
Geographical mobility - Moved from different state (%) - Black or African American
Geographical mobility - Moved from different state (%) - Asian
Geographical mobility - Moved from different state (%) - Hispanic or Latino
Geographical mobility - Moved from different state (%) - American Indian and Alaska Native
Geographical mobility - Moved from different state (%) - Multirace
Geographical mobility - Moved from different state (%) - Other Race
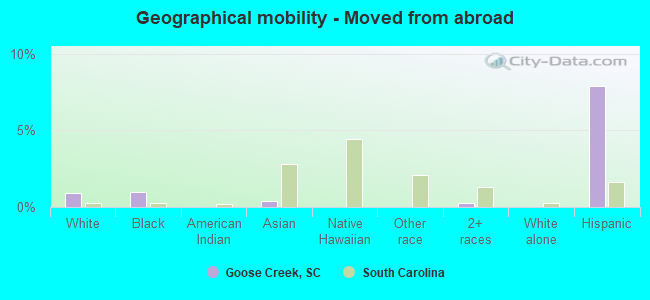
Geographical mobility - Moved from abroad (%)
Geographical mobility - Moved from abroad (%) - White
Geographical mobility - Moved from abroad (%) - Black or African American
Geographical mobility - Moved from abroad (%) - Asian
Geographical mobility - Moved from abroad (%) - Hispanic or Latino
Geographical mobility - Moved from abroad (%) - American Indian and Alaska Native
Geographical mobility - Moved from abroad (%) - Multirace
Geographical mobility - Moved from abroad (%) - Other Race
Place of birth for the foreign-born population - Ireland (%)
Place of birth for the foreign-born population - Denmark (%)
Place of birth for the foreign-born population - Norway (%)
Place of birth for the foreign-born population - Sweden (%)
Place of birth for the foreign-born population - United Kingdom (%)
Place of birth for the foreign-born population - England (%)
Place of birth for the foreign-born population - Scotland (%)
Place of birth for the foreign-born population - Other Northern Europe (%)
Place of birth for the foreign-born population - Austria (%)
Place of birth for the foreign-born population - Belgium (%)
Place of birth for the foreign-born population - France (%)
Place of birth for the foreign-born population - Germany (%)
Place of birth for the foreign-born population - Netherlands (%)
Place of birth for the foreign-born population - Switzerland (%)
Place of birth for the foreign-born population - Other Western Europe (%)
Place of birth for the foreign-born population - Greece (%)
Place of birth for the foreign-born population - Italy (%)
Place of birth for the foreign-born population - Portugal (%)
Place of birth for the foreign-born population - Spain (%)
Place of birth for the foreign-born population - Other Southern Europe (%)
Place of birth for the foreign-born population - Albania (%)
Place of birth for the foreign-born population - Belarus (%)
Place of birth for the foreign-born population - Bosnia and Herzegovina (%)
Place of birth for the foreign-born population - Bulgaria (%)
Place of birth for the foreign-born population - Croatia (%)
Place of birth for the foreign-born population - Czechoslovakia (%)
Place of birth for the foreign-born population - Hungary (%)
Place of birth for the foreign-born population - Latvia (%)
Place of birth for the foreign-born population - Lithuania (%)
Place of birth for the foreign-born population - North Macedonia (Macedonia) (%)
Place of birth for the foreign-born population - Moldova (%)
Place of birth for the foreign-born population - Poland (%)
Place of birth for the foreign-born population - Romania (%)
Place of birth for the foreign-born population - Russia (%)
Place of birth for the foreign-born population - Serbia (%)
Place of birth for the foreign-born population - Ukraine (%)
Place of birth for the foreign-born population - Other Eastern Europe (%)
Place of birth for the foreign-born population - China (%)
Place of birth for the foreign-born population - Hong Kong (%)
Place of birth for the foreign-born population - Taiwan (%)
Place of birth for the foreign-born population - Japan (%)
Place of birth for the foreign-born population - Korea (%)
Place of birth for the foreign-born population - Other Eastern Asia (%)
Place of birth for the foreign-born population - Afghanistan (%)
Place of birth for the foreign-born population - Bangladesh (%)
Place of birth for the foreign-born population - India (%)
Place of birth for the foreign-born population - Iran (%)
Place of birth for the foreign-born population - Kazakhstan (%)
Place of birth for the foreign-born population - Nepal (%)
Place of birth for the foreign-born population - Pakistan (%)
Place of birth for the foreign-born population - Sri Lanka (%)
Place of birth for the foreign-born population - Uzbekistan (%)
Place of birth for the foreign-born population - Other South Central Asia (%)
Place of birth for the foreign-born population - Burma (%)
Place of birth for the foreign-born population - Cambodia (%)
Place of birth for the foreign-born population - Indonesia (%)
Place of birth for the foreign-born population - Laos (%)
Place of birth for the foreign-born population - Malaysia (%)
Place of birth for the foreign-born population - Philippines (%)
Place of birth for the foreign-born population - Singapore (%)
Place of birth for the foreign-born population - Thailand (%)
Place of birth for the foreign-born population - Vietnam (%)
Place of birth for the foreign-born population - Other South Eastern Asia (%)
Place of birth for the foreign-born population - Armenia (%)
Place of birth for the foreign-born population - Iraq (%)
Place of birth for the foreign-born population - Israel (%)
Place of birth for the foreign-born population - Jordan (%)
Place of birth for the foreign-born population - Kuwait (%)
Place of birth for the foreign-born population - Lebanon (%)
Place of birth for the foreign-born population - Saudi Arabia (%)
Place of birth for the foreign-born population - Syria (%)
Place of birth for the foreign-born population - Turkey (%)
Place of birth for the foreign-born population - Yemen (%)
Place of birth for the foreign-born population - Other Western Asia (%)
Place of birth for the foreign-born population - Eritrea (%)
Place of birth for the foreign-born population - Ethiopia (%)
Place of birth for the foreign-born population - Kenya (%)
Place of birth for the foreign-born population - Somalia (%)
Place of birth for the foreign-born population - Uganda (%)
Place of birth for the foreign-born population - Zimbabwe (%)
Place of birth for the foreign-born population - Other Eastern Africa (%)
Place of birth for the foreign-born population - Cameroon (%)
Place of birth for the foreign-born population - Congo (%)
Place of birth for the foreign-born population - Democratic Republic of Congo (Zaire) (%)
Place of birth for the foreign-born population - Other Middle Africa (%)
Place of birth for the foreign-born population - Egypt (%)
Place of birth for the foreign-born population - Morocco (%)
Place of birth for the foreign-born population - Sudan (%)
Place of birth for the foreign-born population - Other Northern Africa (%)
Place of birth for the foreign-born population - South Africa (%)
Place of birth for the foreign-born population - Other Southern Africa (%)
Place of birth for the foreign-born population - Cabo Verde (%)
Place of birth for the foreign-born population - Ghana (%)
Place of birth for the foreign-born population - Liberia (%)
Place of birth for the foreign-born population - Nigeria (%)
Place of birth for the foreign-born population - Senegal (%)
Place of birth for the foreign-born population - Sierra Leone (%)
Place of birth for the foreign-born population - Other Western Africa (%)
Place of birth for the foreign-born population - Australia (%)
Place of birth for the foreign-born population - New Zealand (%)
Place of birth for the foreign-born population - Fiji (%)
Place of birth for the foreign-born population - Micronesia (%)
Place of birth for the foreign-born population - Bahamas (%)
Place of birth for the foreign-born population - Barbados (%)
Place of birth for the foreign-born population - Cuba (%)
Place of birth for the foreign-born population - Dominica (%)
Place of birth for the foreign-born population - Dominican Republic (%)
Place of birth for the foreign-born population - Grenada (%)
Place of birth for the foreign-born population - Haiti (%)
Place of birth for the foreign-born population - Jamaica (%)
Place of birth for the foreign-born population - St. Vincent and the Grenadines (%)
Place of birth for the foreign-born population - Trinidad and Tobago (%)
Place of birth for the foreign-born population - West Indies (%)
Place of birth for the foreign-born population - Other Caribbean (%)
Place of birth for the foreign-born population - Belize (%)
Place of birth for the foreign-born population - Costa Rica (%)
Place of birth for the foreign-born population - El Salvador (%)
Place of birth for the foreign-born population - Guatemala (%)
Place of birth for the foreign-born population - Honduras (%)
Place of birth for the foreign-born population - Mexico (%)
Place of birth for the foreign-born population - Nicaragua (%)
Place of birth for the foreign-born population - Panama (%)
Place of birth for the foreign-born population - Other Central America (%)
Place of birth for the foreign-born population - Argentina (%)
Place of birth for the foreign-born population - Bolivia (%)
Place of birth for the foreign-born population - Brazil (%)
Place of birth for the foreign-born population - Chile (%)
Place of birth for the foreign-born population - Colombia (%)
Place of birth for the foreign-born population - Ecuador (%)
Place of birth for the foreign-born population - Guyana (%)
Place of birth for the foreign-born population - Peru (%)
Place of birth for the foreign-born population - Uruguay (%)
Place of birth for the foreign-born population - Venezuela (%)
Place of birth for the foreign-born population - Other South America (%)
Place of birth for the foreign-born population - Canada (%)
Place of birth for the foreign-born population - Other Northern America (%)
Place of birth for the foreign-born population - Other (%)
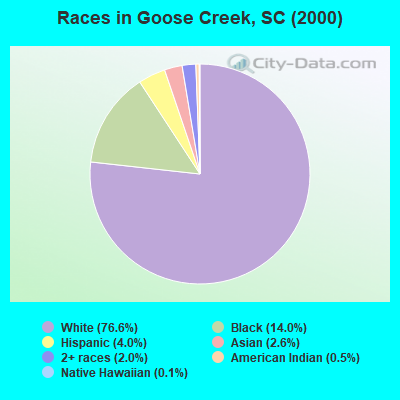
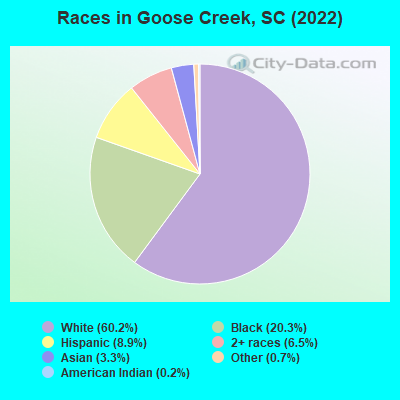
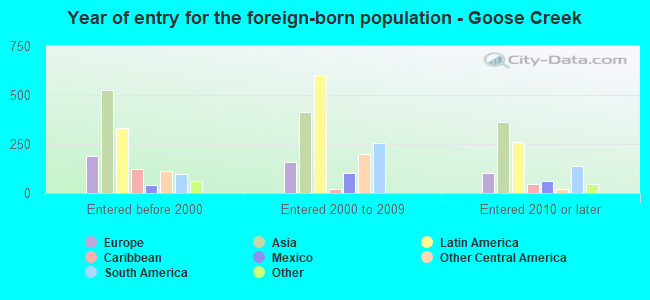
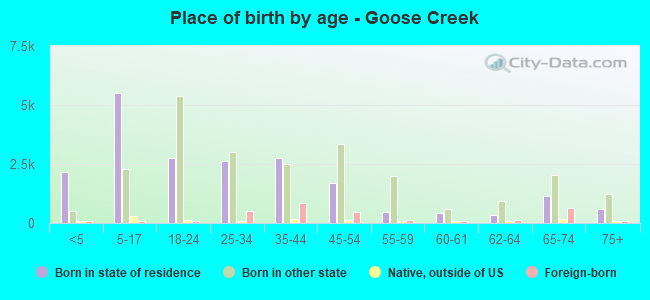
According to 2022 data, the most numerous races in Goose Creek, SC are White alone (29,242 residents), Black alone (9,865 residents), and Hispanic (4,326 residents). 90.5% of Goose Creek residents speak English at home. 6.3% of Goose Creek, SC residents are foreign-born (2.8% born in Asia, 2.7% born in Latin America, 0.9% born in Europe), which is 20.1% greater than the foreign-born rate of 5.0% across the entire state of South Carolina.
Race distribution in Goose Creek
2000 2022
2,652,291 66.1% White alone 1,178,486 29.4% Black alone 95,076 2.4% Hispanic 35,568 0.9% Asian alone 33,290 0.8% Two or more races 12,765 0.3% American Indian alone 3,266 0.08% Other race alone 1,270 0.03% Native Hawaiian and Other
3,301,739 62.5% White alone 1,313,290 24.9% Black alone 343,783 6.5% Hispanic 190,508 3.6% Two or more races 89,888 1.7% Asian alone 29,390 0.6% Other race alone 12,112 0.2% American Indian alone 1,924 0.04% Native Hawaiian and Other
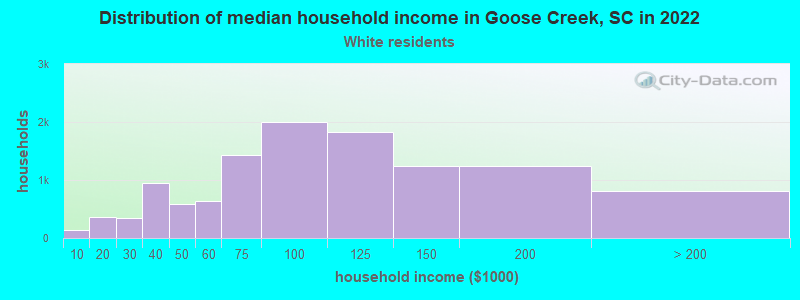
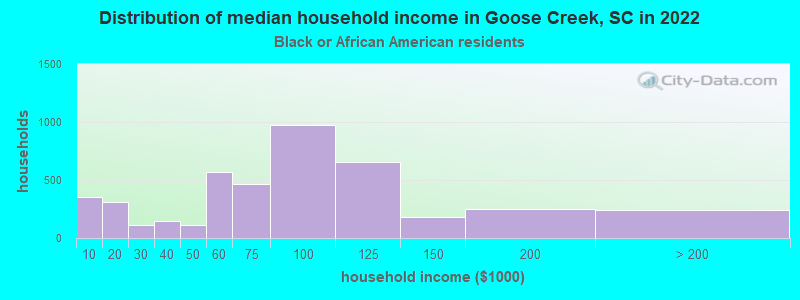
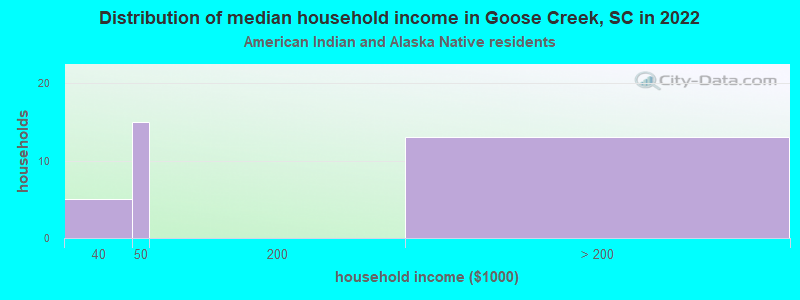
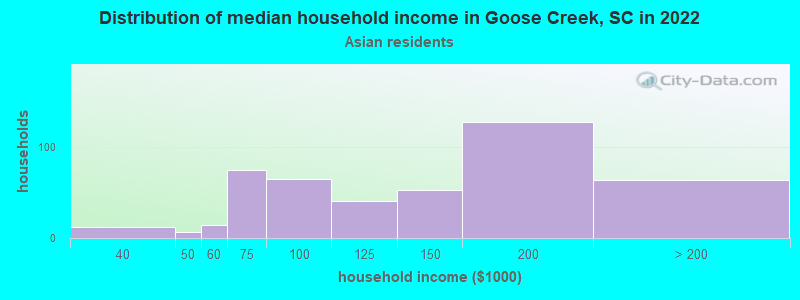
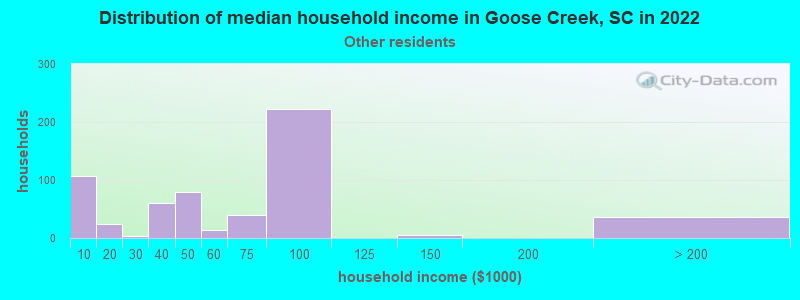
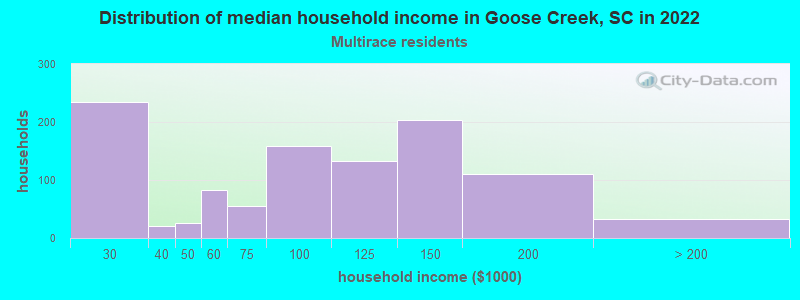
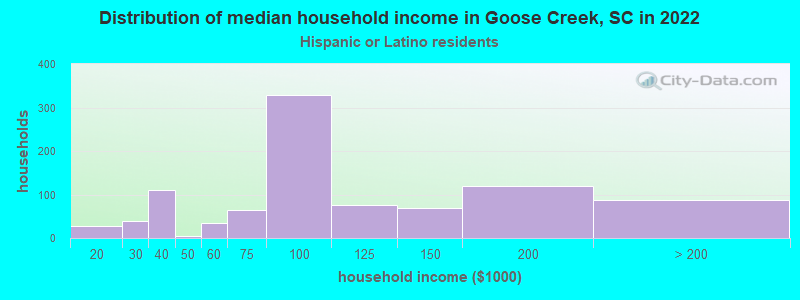
Income and house value in Goose Creek Median household income in 2022 $87,684 White non-Hispanic householders$71,751 Black householders$66,374 American Indian and Alaska Native householders$174,196 Asian householders$67,776 Some other race householders$100,746 Two or more races householders$103,943 Hispanic or Latino race householdersMedian 2022 house value $304,566 White Non-Hispanic householders$302,736 Black or African American householders$536,877 American Indian or Alaska Native householders $293,590 Asian householders$346,943 Some other race householders$254,872 Two or more races householders$299,078 Hispanic or Latino householders
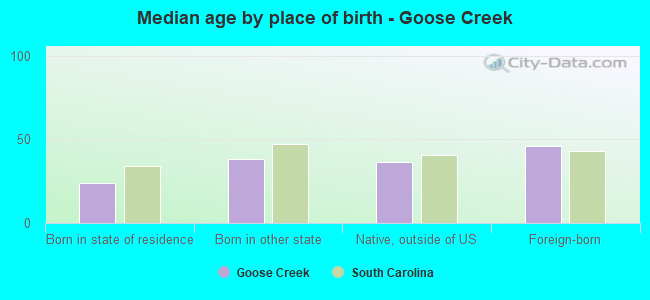
Median age by race in Goose Creek
34.4 Median age for White residents31.1 37.3 30.8 Median age for Black or African American residents29.2 32.0 33.2 Median age for American Indian / Alaska Native residents22.7 55.1 47.2 Median age for Asian residents41.6 49.9 -698,412,697.7 Median age for Native Hawaiian / Pacific Islander residents-551,574,375.1 -1,016,109,044.8 21.0 Median age for Other race residents17.0 35.1 23.9 Median age for Two or more races residents26.9 22.4 35.3 Median age for White alone residents31.7 38.0 23.4 Median age for Hispanic or Latino residents21.6 25.1
Owner/renter occupied households by race in Goose Creek
House owners and renters - White residents 8,409 73.0% Owner occupied3,107 27.0% Renter occupiedHouse owners and renters - Black or African American residents 2,796 72.0% Owner occupied1,090 28.0% Renter occupiedHouse owners and renters - American Indian / Alaska Native residents 22 54.9% Owner occupied18 45.1% Renter occupiedHouse owners and renters - Asian residents 388 79.6% Owner occupied99 20.4% Renter occupiedHouse owners and renters - Native Hawaiian / Pacific Islander residents 13 100.0% Owner occupiedHouse owners and renters - Other race residents 331 83.0% Owner occupied68 17.0% Renter occupiedHouse owners and renters - Two or more races residents 615 62.0% Owner occupied376 38.0% Renter occupiedHouse owners and renters - White alone residents 8,284 73.9% Owner occupied2,921 26.1% Renter occupiedHouse owners and renters - Hispanic or Latino residents 528 59.0% Owner occupied366 41.0% Renter occupied
Language usage in Goose Creek
English speakers - Total 90.5% of residents of Goose Creek speak English at home.
5.2% of residents speak Spanish at home 1,434 60.2% Speak English very well949 39.8% Speak English less than very well3.7% of residents speak other language at home 1,361 80.7% Speak English very well325 19.3% Speak English less than very well
English speakers - Born in the United States 95.9% of residents of Goose Creek speak English at home.
3.2% of residents speak Spanish at home 708 95.3% Speak English very well35 4.7% Speak English less than very well1.0% of residents speak other language at home 216 94.3% Speak English very well13 5.7% Speak English less than very well
English speakers - Native, born elsewhere 48.2% of residents of Goose Creek speak English at home.
42.6% of residents speak Spanish at home 163 32.7% Speak English very well335 67.3% Speak English less than very well8.2% of residents speak other language at home 39 40.6% Speak English very well57 59.4% Speak English less than very well
English speakers - Foreign-born 27.2% of residents of Goose Creek speak English at home.
27.5% of residents speak Spanish at home 278 35.8% Speak English very well499 64.2% Speak English less than very well44.3% of residents speak other language at home 977 78.2% Speak English very well272 21.8% Speak English less than very well
White (Caucasian) - Speak only English Native:
97.5% (27,798)Foreign-born:
60.1% (292)
White (Caucasian) - Speak another language Native:
3.6% (1,029)Foreign-born:
68.4% (332)
Black or African American - Speak only English Native:
98.0% (8,643)Foreign-born:
52.7% (76)
Black or African American - Speak another language Native:
2.0% (179)Foreign-born:
33.2% (48)
Asian - Speak only English Native:
58.1% (229)Foreign-born:
19.4% (205)
Asian - Speak another language Native:
47.1% (185)Foreign-born:
79.4% (838)
Other race - Speak only English Native:
55.2% (690)Foreign-born:
7.0% (47)
Other race - Speak another language Native:
46.0% (575)Foreign-born:
82.0% (544)
Two or more races - Speak only English Native:
82.1% (2,962)Foreign-born:
12.5% (31)
Two or more races - Speak another language Native:
17.9% (644)Foreign-born:
80.1% (196)
White alone - Speak only English Native:
98.7% (27,212)Foreign-born:
73.3% (304)
White alone - Speak another language Native:
1.1% (305)Foreign-born:
29.2% (121)
Hispanic or Latino - Speak only English Native:
53.3% (1,644)Foreign-born:
7.9% (64)
Hispanic or Latino - Speak another language Native:
44.7% (1,379)Foreign-born:
89.2% (728)
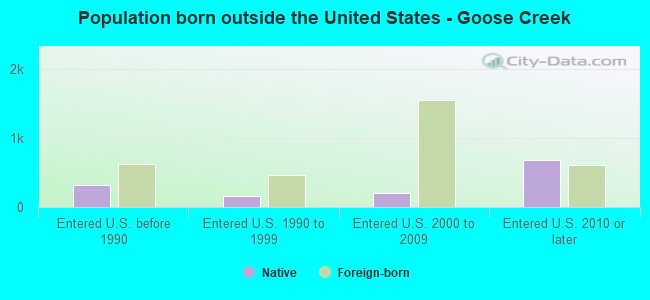
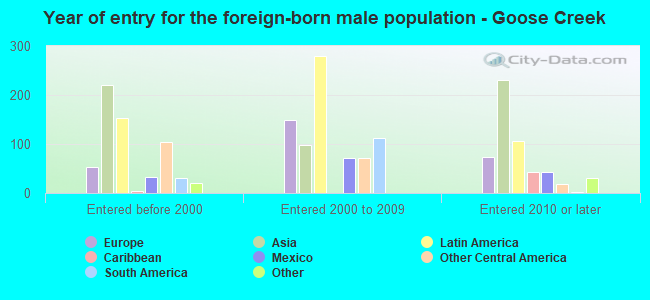
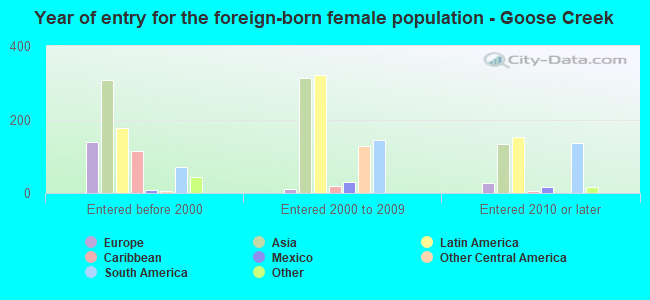
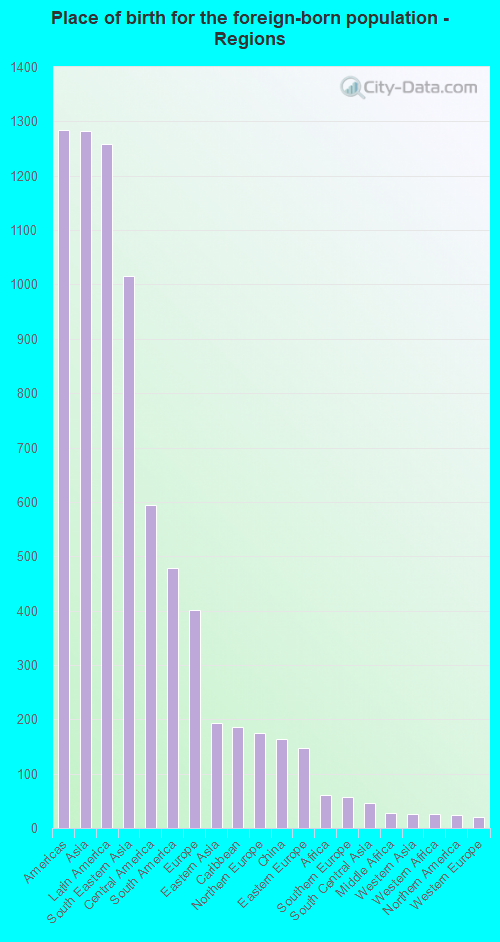
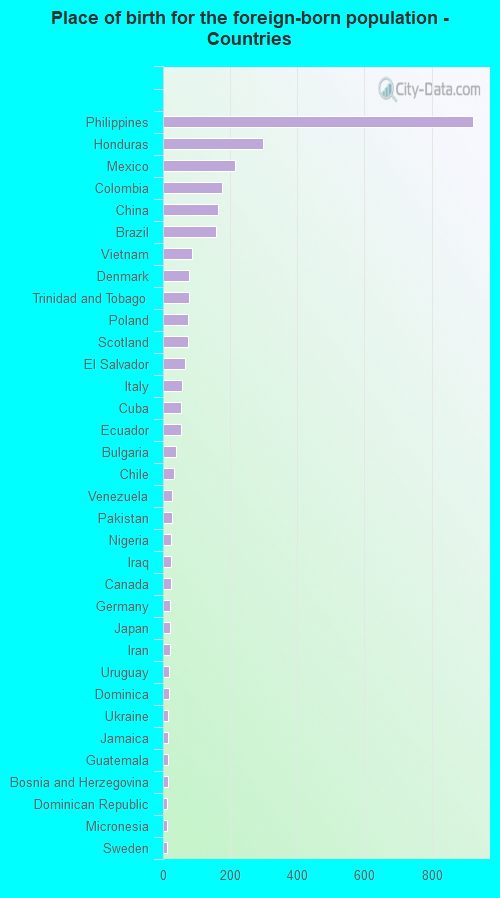
Foreign-born residents in Goose Creek 3,039 residents are foreign born (2.8% Asia , 2.7% Latin America , 0.9% Europe ).
This city:
6.3%South Carolina:
5.3%
Marital status for residents in Goose Creek Marital status - White (Caucasian) population 15 years and over
Males 39.2% Never married47.9% Now married1.6% Separated2.6% Widowed8.7% DivorcedFemales 23.5% Never married54.2% Now married2.8% Separated5.0% Widowed14.5% DivorcedWomen who gave birth in the past 12 months Now married:
63.5% (230)Unmarried:
36.5% (132)
Women who did not give birth in the past 12 months Now married:
53.3% (3,282)Unmarried:
46.7% (2,877)
Marital status - Black or African American population 15 years and over
Males 43.7% Never married48.4% Now married1.1% Separated1.4% Widowed5.4% DivorcedFemales 48.8% Never married32.4% Now married2.0% Separated3.0% Widowed13.8% DivorcedWomen who gave birth in the past 12 months Now married:
83.1% (57)Unmarried:
16.9% (12)
Women who did not give birth in the past 12 months Now married:
29.0% (1,084)Unmarried:
71.0% (2,653)
Marital status - American Indian / Alaska Native population 15 years and over
Males 63.9% Never married26.2% Now married0.0% Separated0.0% Widowed9.8% DivorcedFemales 16.9% Never married28.8% Now married0.0% Separated0.0% Widowed54.2% DivorcedWomen who did not give birth in the past 12 months Now married:
17.0% (11)Unmarried:
83.0% (53)
Marital status - Asian population 15 years and over
Males 37.4% Never married52.4% Now married0.0% Separated6.8% Widowed3.5% DivorcedFemales 8.9% Never married67.4% Now married4.8% Separated14.7% Widowed4.2% DivorcedWomen who gave birth in the past 12 months Now married:
82.1% (35)Unmarried:
17.9% (8)
Women who did not give birth in the past 12 months Now married:
72.3% (278)Unmarried:
27.7% (106)
Marital status - Other race population 15 years and over
Males 34.3% Never married61.8% Now married1.8% Separated0.0% Widowed2.0% DivorcedFemales 30.5% Never married44.1% Now married18.9% Separated5.1% Widowed1.5% DivorcedWomen who gave birth in the past 12 months Now married:
30.7% (47)Unmarried:
69.3% (107)
Women who did not give birth in the past 12 months Now married:
64.9% (360)Unmarried:
35.1% (195)
Marital status - Two or more races population 15 years and over
Males 49.5% Never married46.1% Now married0.2% Separated0.0% Widowed4.2% DivorcedFemales 41.3% Never married47.4% Now married0.6% Separated7.2% Widowed3.5% DivorcedWomen who gave birth in the past 12 months Now married:
69.5% (74)Unmarried:
30.5% (33)
Women who did not give birth in the past 12 months Now married:
39.3% (249)Unmarried:
60.7% (384)
Marital status - White alone, not Hispanic / Latino population 15 years and over
Males 38.3% Never married49.3% Now married1.5% Separated2.8% Widowed8.1% DivorcedFemales 22.6% Never married54.7% Now married2.8% Separated5.2% Widowed14.7% DivorcedWomen who gave birth in the past 12 months Now married:
69.5% (230)Unmarried:
30.5% (101)
Women who did not give birth in the past 12 months Now married:
53.0% (3,174)Unmarried:
47.0% (2,810)
Marital status - Hispanic or Latino population 15 years and over
Males 47.8% Never married40.3% Now married2.6% Separated0.0% Widowed9.4% DivorcedFemales 40.8% Never married45.1% Now married1.5% Separated7.5% Widowed5.1% DivorcedWomen who gave birth in the past 12 months Now married:
24.3% (41)Unmarried:
75.7% (127)
Women who did not give birth in the past 12 months Now married:
53.0% (446)Unmarried:
47.0% (395)
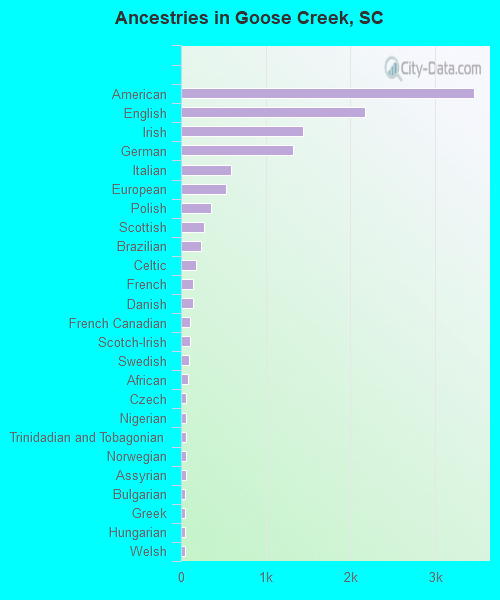
Ancestries in Goose Creek
3,464 15.4% American2,170 9.6% English1,443 6.4% Irish1,318 5.8% German586 2.6% Italian527 2.3% European360 1.6% Polish272 1.2% Scottish232 1.0% Brazilian175 0.8% Celtic136 0.6% French136 0.6% Danish106 0.5% French Canadian101 0.4% Scotch-Irish96 0.4% Swedish88 0.4% African60 0.3% Czech60 0.3% Nigerian60 0.3% Trinidadian and Tobagonian57 0.3% Norwegian56 0.2% Assyrian53 0.2% Bulgarian52 0.2% Greek48 0.2% Hungarian43 0.2% Welsh41 0.2% Portuguese40 0.2% Eastern European39 0.2% British37 0.2% Scandinavian29 0.1% Ukrainian26 0.1% Russian24 0.1% Dutch17 0.08% Yugoslavian16 0.07% Arab16 0.07% Finnish12 0.05% Iraqi12 0.05% Pennsylvania German7 0.03% Ethiopian3 0.01% Croatian3 0.01% Jamaican
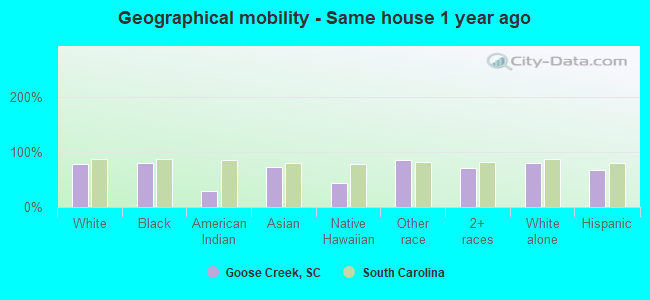
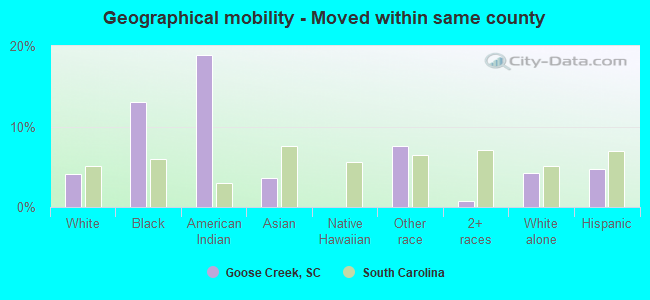
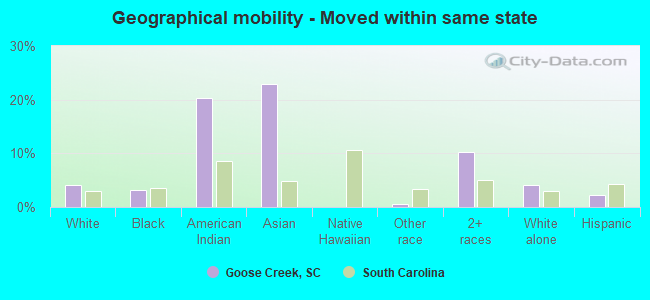
Geographical mobility in Goose Creek Same house 1 year ago 23,703 78.6% White (Caucasian)8,131 80.8% Black or African American56 29.1% American Indian / Alaska Native1,255 72.8% Asian12 44.5% Native Hawaiian / Pacific Islander1,960 85.6% Other race3,019 70.7% Two or more races23,044 79.6% White alone, not Hispanic / Latino2,809 67.8% Hispanic or LatinoMoved within same county 1,229 4.1% White / Caucasian1,310 13.0% Black or African American36 18.8% American Indian / Alaska Native62 3.6% Asian174 7.6% Other race32 0.8% Two or more races1,232 4.3% White alone, not Hispanic / Latino197 4.7% Hispanic or LatinoMoved within same state 1,256 4.2% White / Caucasian322 3.2% Black or African American39 20.4% American Indian / Alaska Native394 22.9% Asian14 0.6% Other race441 10.3% Two or more races1,205 4.2% White alone, not Hispanic / Latino94 2.3% Hispanic or LatinoMoved from different state 3,910 13.0% White / Caucasian287 2.9% Black or African American82 4.8% Asian15 55.6% Native Hawaiian / Pacific Islander172 7.5% Other race1,085 25.4% Two or more races3,641 12.6% White alone, not Hispanic / Latino739 17.8% Hispanic or LatinoMoved from abroad 268 0.9% White97 1.0% Black or African American6 0.4% Asian10 0.2% Two or more races7 0.0% White alone, not Hispanic / Latino328 7.9% Hispanic or Latino
Children Nativity (place of birth) in Goose Creek
Children under 6 years - Living with two parents Both parents native 2,049 100.0% NativeBoth parents foreign-born 178 99.0% Native2 1.0% Foreign-bornOne native, one foreign-born parent 123 100.0% NativeChildren under 6 years - Living with one parent Native parent 722 100.0% NativeForeign-born parent 71 100.0% NativeChildren 6 to 17 years - Living with two parents Both parents native 4,197 100.0% NativeBoth parents foreign-born 345 89.6% Native40 10.4% Foreign-bornOne native, one foreign-born parent 100 100.0% NativeChildren 6 to 17 years - Living with one parent Native parent 2,008 100.0% NativeForeign-born parent 219 49.8% Native221 50.2% Foreign-born
Grandparents responsible for own grandchildren in Goose Creek
Grandparents (30 to 59 years) White / Caucasian 343 77.8% Responsible for grandchildren98 22.2% Not responsible for grandchildrenBlack or African American 4 17.2% Responsible for grandchildren18 82.8% Not responsible for grandchildrenAsian 22 100.0% Not responsible for grandchildrenOther race 6 100.0% Not responsible for grandchildrenWhite alone, not Hispanic / Latino 343 82.8% Responsible for grandchildren71 17.2% Not responsible for grandchildrenHispanic or Latino 23 100.0% Not responsible for grandchildrenGrandparents (60 years and over) White / Caucasian 98 23.1% Responsible for grandchildren325 76.9% Not responsible for grandchildrenBlack or African American 52 48.8% Responsible for grandchildren55 51.2% Not responsible for grandchildrenAsian 112 100.0% Not responsible for grandchildrenOther race 10 100.0% Not responsible for grandchildrenWhite alone, not Hispanic / Latino 98 32.8% Responsible for grandchildren200 67.2% Not responsible for grandchildrenHispanic or Latino 105 100.0% Not responsible for grandchildren