Races in Graham, North Carolina (NC) Detailed Stats
Data:
Races - White alone (%)
Races - White alone (% change since 2000)
Races - Black alone (%)
Races - Black alone (% change since 2000)
Races - American Indian alone (%)
Races - American Indian alone (% change since 2000)
Races - Asian alone (%)
Races - Asian alone (% change since 2000)
Races - Hispanic (%)
Races - Hispanic (% change since 2000)
Races - Native Hawaiian and Other Pacific Islander alone (%)
Races - Native Hawaiian and Other Pacific Islander alone (% change since 2000)
Races - Two or more races(%)
Races - Two or more races(% change since 2000)
Races - Other race alone (%)
Races - Other race alone (% change since 2000)
Racial diversity
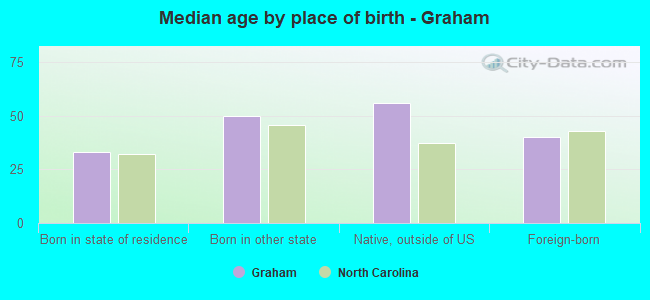
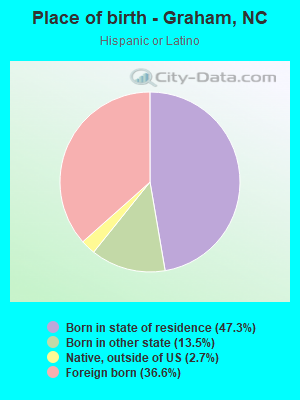
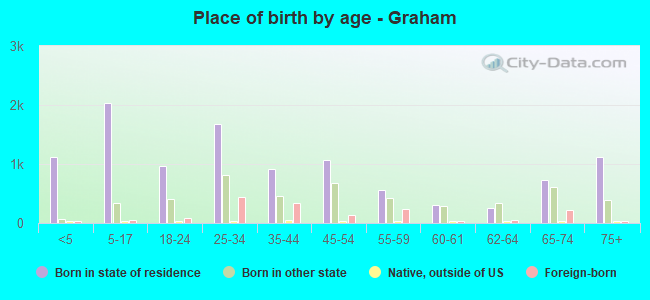
Place of birth - Born in state of residence (%)
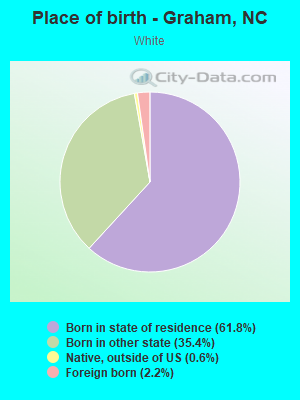
Place of birth - Born in state of residence (%) - White
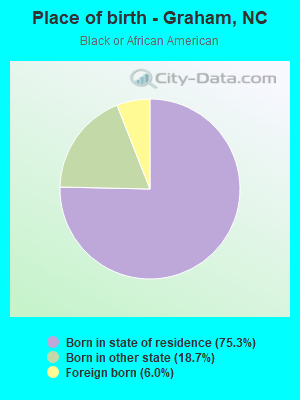
Place of birth - Born in state of residence (%) - Black or African American
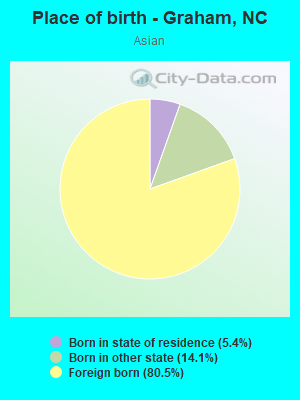
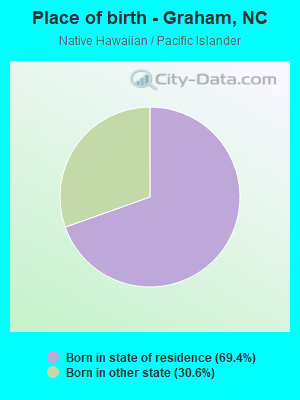
Place of birth - Born in state of residence (%) - Asian
Place of birth - Born in state of residence (%) - Hispanic or Latino
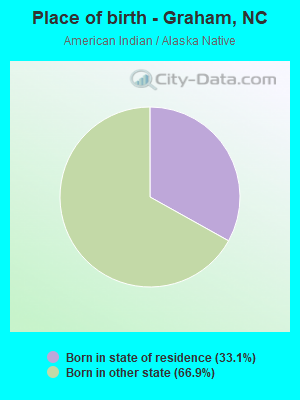
Place of birth - Born in state of residence (%) - American Indian and Alaska Native
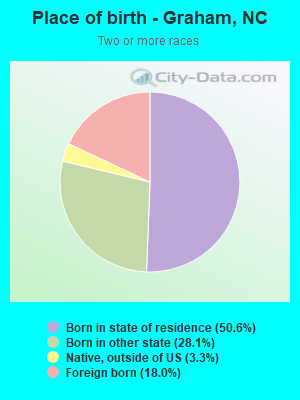
Place of birth - Born in state of residence (%) - Multirace
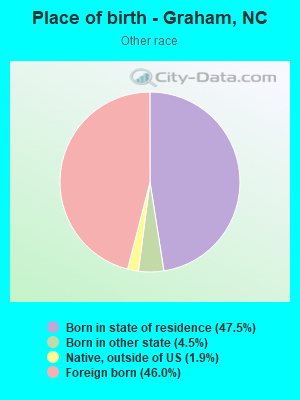
Place of birth - Born in state of residence (%) - Other Race
Place of birth - Born in other state (%)
Place of birth - Born in other state (%) - White
Place of birth - Born in other state (%) - Black or African American
Place of birth - Born in other state (%) - Asian
Place of birth - Born in other state (%) - Hispanic or Latino
Place of birth - Born in other state (%) - American Indian and Alaska Native
Place of birth - Born in other state (%) - Multirace
Place of birth - Born in other state (%) - Other Race
Place of birth - Native, outside of US (%)
Place of birth - Native, outside of US (%) - White
Place of birth - Native, outside of US (%) - Black or African American
Place of birth - Native, outside of US (%) - Asian
Place of birth - Native, outside of US (%) - Hispanic or Latino
Place of birth - Native, outside of US (%) - American Indian and Alaska Native
Place of birth - Native, outside of US (%) - Multirace
Place of birth - Native, outside of US (%) - Other Race
Place of birth - Foreign born (%)
Place of birth - Foreign born (%) - White
Place of birth - Foreign born (%) - Black or African American
Place of birth - Foreign born (%) - Asian
Place of birth - Foreign born (%) - Hispanic or Latino
Place of birth - Foreign born (%) - American Indian and Alaska Native
Place of birth - Foreign born (%) - Multirace
Place of birth - Foreign born (%) - Other Race
Residents speaking English at home (%)
Residents speaking English at home - Born in the United States (%)
Residents speaking English at home - Native, born elsewhere (%)
Residents speaking English at home - Foreign born (%)
Residents speaking Spanish at home (%)
Residents speaking Spanish at home - Born in the United States (%)
Residents speaking Spanish at home - Native, born elsewhere (%)
Residents speaking Spanish at home - Foreign born (%)
Residents speaking other language at home (%)
Residents speaking other language at home - Born in the United States (%)
Residents speaking other language at home - Native, born elsewhere (%)
Residents speaking other language at home - Foreign born (%)
Marital status - Never married (%)
Marital status - Now married (%)
Marital status - Separated (%)
Marital status - Widowed (%)
Marital status - Divorced (%)
Ancestries Reported - Arab (%)
Ancestries Reported - Czech (%)
Ancestries Reported - Danish (%)
Ancestries Reported - Dutch (%)
Ancestries Reported - English (%)
Ancestries Reported - French (%)
Ancestries Reported - French Canadian (%)
Ancestries Reported - German (%)
Ancestries Reported - Greek (%)
Ancestries Reported - Hungarian (%)
Ancestries Reported - Irish (%)
Ancestries Reported - Italian (%)
Ancestries Reported - Lithuanian (%)
Ancestries Reported - Norwegian (%)
Ancestries Reported - Polish (%)
Ancestries Reported - Portuguese (%)
Ancestries Reported - Russian (%)
Ancestries Reported - Scotch-Irish (%)
Ancestries Reported - Scottish (%)
Ancestries Reported - Slovak (%)
Ancestries Reported - Subsaharan African (%)
Ancestries Reported - Swedish (%)
Ancestries Reported - Swiss (%)
Ancestries Reported - Ukrainian (%)
Ancestries Reported - United States (%)
Ancestries Reported - Welsh (%)
Ancestries Reported - West Indian (%)
Ancestries Reported - Other (%)
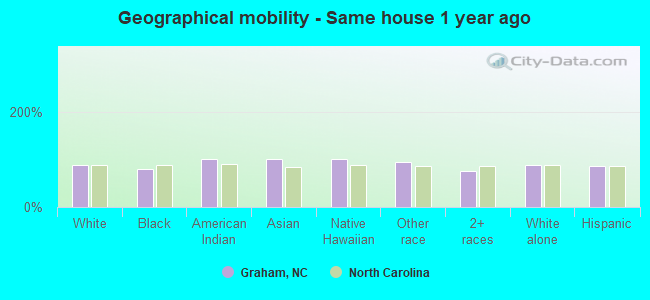
Geographical mobility - Same house 1 year ago (%)
Geographical mobility - Same house 1 year ago (%) - White
Geographical mobility - Same house 1 year ago (%) - Black or African American
Geographical mobility - Same house 1 year ago (%) - Asian
Geographical mobility - Same house 1 year ago (%) - Hispanic or Latino
Geographical mobility - Same house 1 year ago (%) - American Indian and Alaska Native
Geographical mobility - Same house 1 year ago (%) - Multirace
Geographical mobility - Same house 1 year ago (%) - Other Race
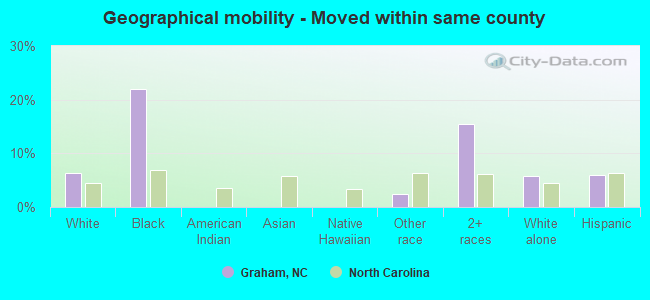
Geographical mobility - Moved within same county (%)
Geographical mobility - Moved within same county (%) - White
Geographical mobility - Moved within same county (%) - Black or African American
Geographical mobility - Moved within same county (%) - Asian
Geographical mobility - Moved within same county (%) - Hispanic or Latino
Geographical mobility - Moved within same county (%) - American Indian and Alaska Native
Geographical mobility - Moved within same county (%) - Multirace
Geographical mobility - Moved within same county (%) - Other Race
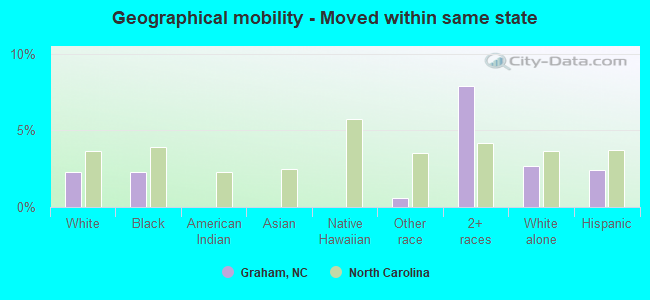
Geographical mobility - Moved from different county within same state (%)
Geographical mobility - Moved from different county within same state (%) - White
Geographical mobility - Moved from different county within same state (%) - Black or African American
Geographical mobility - Moved from different county within same state (%) - Asian
Geographical mobility - Moved from different county within same state (%) - Hispanic or Latino
Geographical mobility - Moved from different county within same state (%) - American Indian and Alaska Native
Geographical mobility - Moved from different county within same state (%) - Multirace
Geographical mobility - Moved from different county within same state (%) - Other Race
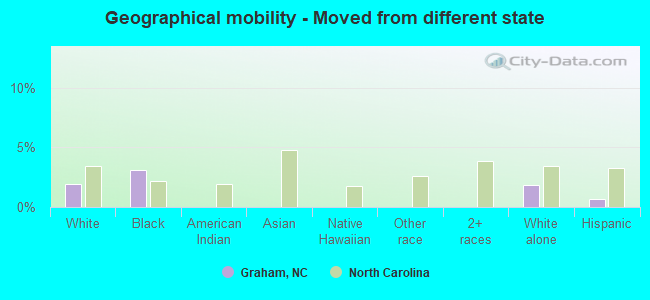
Geographical mobility - Moved from different state (%)
Geographical mobility - Moved from different state (%) - White
Geographical mobility - Moved from different state (%) - Black or African American
Geographical mobility - Moved from different state (%) - Asian
Geographical mobility - Moved from different state (%) - Hispanic or Latino
Geographical mobility - Moved from different state (%) - American Indian and Alaska Native
Geographical mobility - Moved from different state (%) - Multirace
Geographical mobility - Moved from different state (%) - Other Race
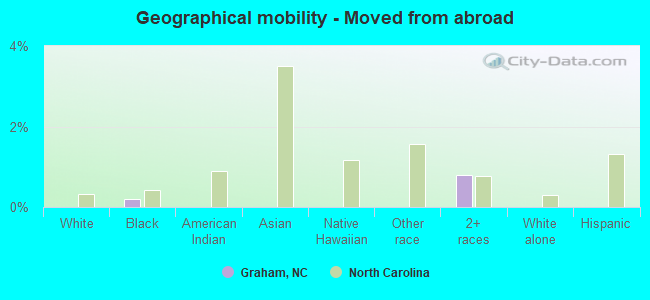
Geographical mobility - Moved from abroad (%)
Geographical mobility - Moved from abroad (%) - White
Geographical mobility - Moved from abroad (%) - Black or African American
Geographical mobility - Moved from abroad (%) - Asian
Geographical mobility - Moved from abroad (%) - Hispanic or Latino
Geographical mobility - Moved from abroad (%) - American Indian and Alaska Native
Geographical mobility - Moved from abroad (%) - Multirace
Geographical mobility - Moved from abroad (%) - Other Race
Place of birth for the foreign-born population - Ireland (%)
Place of birth for the foreign-born population - Denmark (%)
Place of birth for the foreign-born population - Norway (%)
Place of birth for the foreign-born population - Sweden (%)
Place of birth for the foreign-born population - United Kingdom (%)
Place of birth for the foreign-born population - England (%)
Place of birth for the foreign-born population - Scotland (%)
Place of birth for the foreign-born population - Other Northern Europe (%)
Place of birth for the foreign-born population - Austria (%)
Place of birth for the foreign-born population - Belgium (%)
Place of birth for the foreign-born population - France (%)
Place of birth for the foreign-born population - Germany (%)
Place of birth for the foreign-born population - Netherlands (%)
Place of birth for the foreign-born population - Switzerland (%)
Place of birth for the foreign-born population - Other Western Europe (%)
Place of birth for the foreign-born population - Greece (%)
Place of birth for the foreign-born population - Italy (%)
Place of birth for the foreign-born population - Portugal (%)
Place of birth for the foreign-born population - Spain (%)
Place of birth for the foreign-born population - Other Southern Europe (%)
Place of birth for the foreign-born population - Albania (%)
Place of birth for the foreign-born population - Belarus (%)
Place of birth for the foreign-born population - Bosnia and Herzegovina (%)
Place of birth for the foreign-born population - Bulgaria (%)
Place of birth for the foreign-born population - Croatia (%)
Place of birth for the foreign-born population - Czechoslovakia (%)
Place of birth for the foreign-born population - Hungary (%)
Place of birth for the foreign-born population - Latvia (%)
Place of birth for the foreign-born population - Lithuania (%)
Place of birth for the foreign-born population - North Macedonia (Macedonia) (%)
Place of birth for the foreign-born population - Moldova (%)
Place of birth for the foreign-born population - Poland (%)
Place of birth for the foreign-born population - Romania (%)
Place of birth for the foreign-born population - Russia (%)
Place of birth for the foreign-born population - Serbia (%)
Place of birth for the foreign-born population - Ukraine (%)
Place of birth for the foreign-born population - Other Eastern Europe (%)
Place of birth for the foreign-born population - China (%)
Place of birth for the foreign-born population - Hong Kong (%)
Place of birth for the foreign-born population - Taiwan (%)
Place of birth for the foreign-born population - Japan (%)
Place of birth for the foreign-born population - Korea (%)
Place of birth for the foreign-born population - Other Eastern Asia (%)
Place of birth for the foreign-born population - Afghanistan (%)
Place of birth for the foreign-born population - Bangladesh (%)
Place of birth for the foreign-born population - India (%)
Place of birth for the foreign-born population - Iran (%)
Place of birth for the foreign-born population - Kazakhstan (%)
Place of birth for the foreign-born population - Nepal (%)
Place of birth for the foreign-born population - Pakistan (%)
Place of birth for the foreign-born population - Sri Lanka (%)
Place of birth for the foreign-born population - Uzbekistan (%)
Place of birth for the foreign-born population - Other South Central Asia (%)
Place of birth for the foreign-born population - Burma (%)
Place of birth for the foreign-born population - Cambodia (%)
Place of birth for the foreign-born population - Indonesia (%)
Place of birth for the foreign-born population - Laos (%)
Place of birth for the foreign-born population - Malaysia (%)
Place of birth for the foreign-born population - Philippines (%)
Place of birth for the foreign-born population - Singapore (%)
Place of birth for the foreign-born population - Thailand (%)
Place of birth for the foreign-born population - Vietnam (%)
Place of birth for the foreign-born population - Other South Eastern Asia (%)
Place of birth for the foreign-born population - Armenia (%)
Place of birth for the foreign-born population - Iraq (%)
Place of birth for the foreign-born population - Israel (%)
Place of birth for the foreign-born population - Jordan (%)
Place of birth for the foreign-born population - Kuwait (%)
Place of birth for the foreign-born population - Lebanon (%)
Place of birth for the foreign-born population - Saudi Arabia (%)
Place of birth for the foreign-born population - Syria (%)
Place of birth for the foreign-born population - Turkey (%)
Place of birth for the foreign-born population - Yemen (%)
Place of birth for the foreign-born population - Other Western Asia (%)
Place of birth for the foreign-born population - Eritrea (%)
Place of birth for the foreign-born population - Ethiopia (%)
Place of birth for the foreign-born population - Kenya (%)
Place of birth for the foreign-born population - Somalia (%)
Place of birth for the foreign-born population - Uganda (%)
Place of birth for the foreign-born population - Zimbabwe (%)
Place of birth for the foreign-born population - Other Eastern Africa (%)
Place of birth for the foreign-born population - Cameroon (%)
Place of birth for the foreign-born population - Congo (%)
Place of birth for the foreign-born population - Democratic Republic of Congo (Zaire) (%)
Place of birth for the foreign-born population - Other Middle Africa (%)
Place of birth for the foreign-born population - Egypt (%)
Place of birth for the foreign-born population - Morocco (%)
Place of birth for the foreign-born population - Sudan (%)
Place of birth for the foreign-born population - Other Northern Africa (%)
Place of birth for the foreign-born population - South Africa (%)
Place of birth for the foreign-born population - Other Southern Africa (%)
Place of birth for the foreign-born population - Cabo Verde (%)
Place of birth for the foreign-born population - Ghana (%)
Place of birth for the foreign-born population - Liberia (%)
Place of birth for the foreign-born population - Nigeria (%)
Place of birth for the foreign-born population - Senegal (%)
Place of birth for the foreign-born population - Sierra Leone (%)
Place of birth for the foreign-born population - Other Western Africa (%)
Place of birth for the foreign-born population - Australia (%)
Place of birth for the foreign-born population - New Zealand (%)
Place of birth for the foreign-born population - Fiji (%)
Place of birth for the foreign-born population - Micronesia (%)
Place of birth for the foreign-born population - Bahamas (%)
Place of birth for the foreign-born population - Barbados (%)
Place of birth for the foreign-born population - Cuba (%)
Place of birth for the foreign-born population - Dominica (%)
Place of birth for the foreign-born population - Dominican Republic (%)
Place of birth for the foreign-born population - Grenada (%)
Place of birth for the foreign-born population - Haiti (%)
Place of birth for the foreign-born population - Jamaica (%)
Place of birth for the foreign-born population - St. Vincent and the Grenadines (%)
Place of birth for the foreign-born population - Trinidad and Tobago (%)
Place of birth for the foreign-born population - West Indies (%)
Place of birth for the foreign-born population - Other Caribbean (%)
Place of birth for the foreign-born population - Belize (%)
Place of birth for the foreign-born population - Costa Rica (%)
Place of birth for the foreign-born population - El Salvador (%)
Place of birth for the foreign-born population - Guatemala (%)
Place of birth for the foreign-born population - Honduras (%)
Place of birth for the foreign-born population - Mexico (%)
Place of birth for the foreign-born population - Nicaragua (%)
Place of birth for the foreign-born population - Panama (%)
Place of birth for the foreign-born population - Other Central America (%)
Place of birth for the foreign-born population - Argentina (%)
Place of birth for the foreign-born population - Bolivia (%)
Place of birth for the foreign-born population - Brazil (%)
Place of birth for the foreign-born population - Chile (%)
Place of birth for the foreign-born population - Colombia (%)
Place of birth for the foreign-born population - Ecuador (%)
Place of birth for the foreign-born population - Guyana (%)
Place of birth for the foreign-born population - Peru (%)
Place of birth for the foreign-born population - Uruguay (%)
Place of birth for the foreign-born population - Venezuela (%)
Place of birth for the foreign-born population - Other South America (%)
Place of birth for the foreign-born population - Canada (%)
Place of birth for the foreign-born population - Other Northern America (%)
Place of birth for the foreign-born population - Other (%)
Latest news about races in Graham, NC collected exclusively by city-data.com from local newspapers, TV, and radio stations
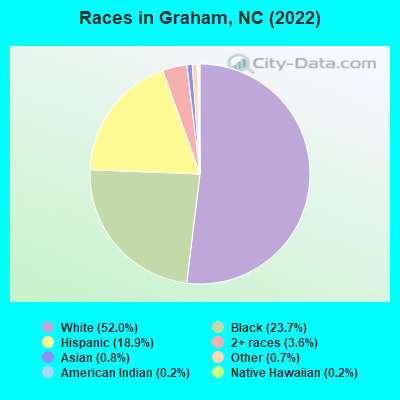
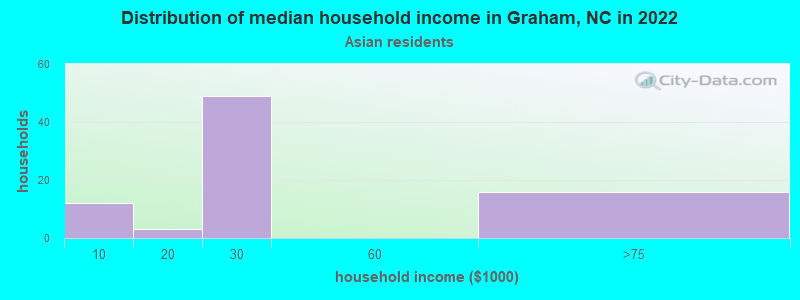
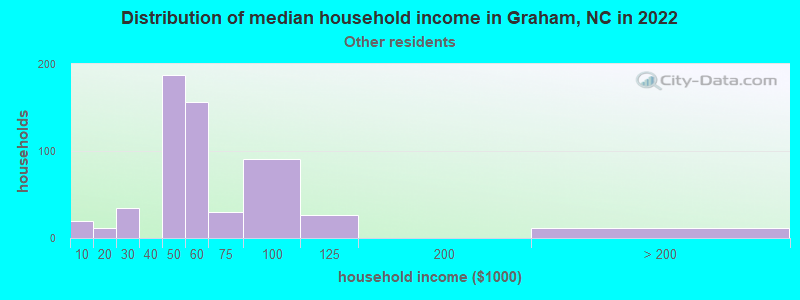
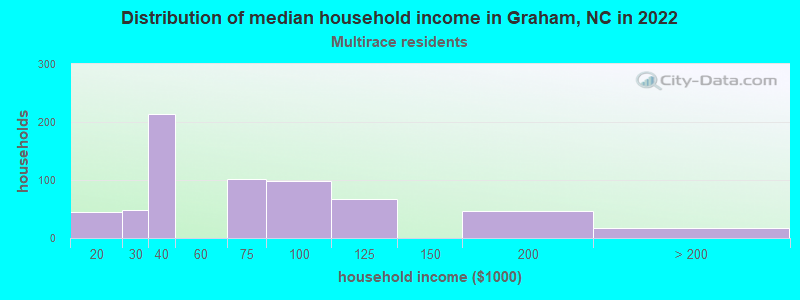
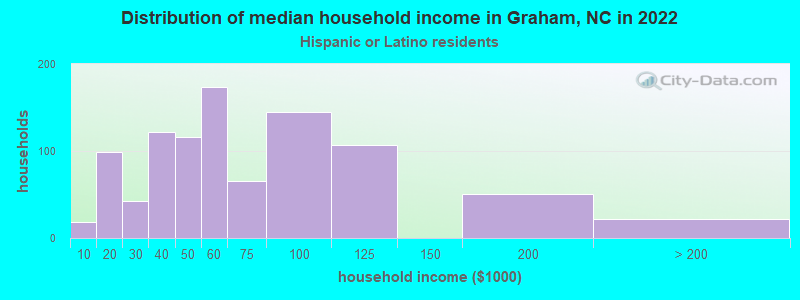
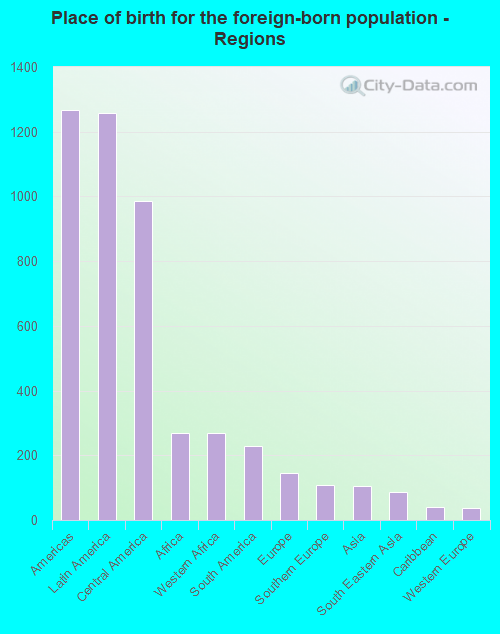
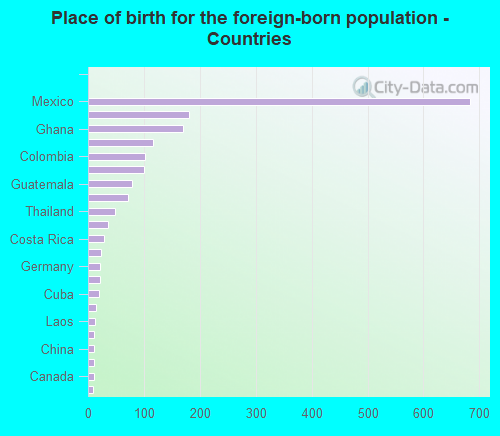
According to 2022 data, the most numerous races in Graham, NC are White alone (9,150 residents), Black alone (4,170 residents), and Hispanic (3,331 residents). 84.0% of Graham residents speak English at home. 10.2% of Graham, NC residents are foreign-born (6.9% born in Latin America, 1.5% born in Africa), which is 21.4% greater than the foreign-born rate of 8.0% across the entire state of North Carolina.
Race distribution in Graham
2000 2022
5,647,155 70.2% White alone 1,723,301 21.4% Black alone 378,963 4.7% Hispanic 112,416 1.4% Asian alone 95,333 1.2% American Indian alone 79,965 1.0% Two or more races 9,015 0.1% Other race alone 3,165 0.04% Native Hawaiian and Other
6,497,519 60.7% White alone 2,155,650 20.1% Black alone 1,114,799 10.4% Hispanic 438,061 4.1% Two or more races 341,052 3.2% Asian alone 91,758 0.9% American Indian alone 50,180 0.5% Other race alone 9,954 0.09% Native Hawaiian and Other
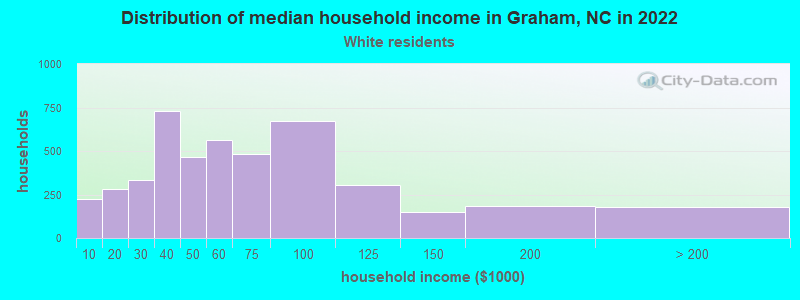
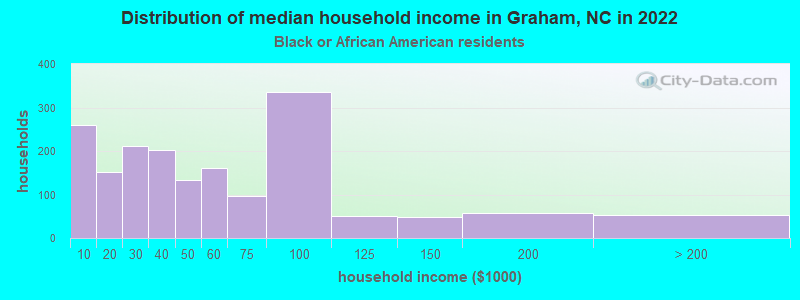
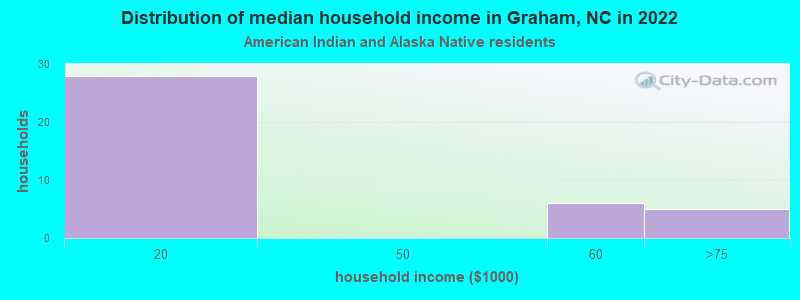
Income and house value in Graham Median household income in 2022 $52,502 White non-Hispanic householders$37,865 Black householders$17,721 Asian householders$53,313 Some other race householders$60,269 Two or more races householders$56,517 Hispanic or Latino race householdersMedian 2022 house value $227,995 White Non-Hispanic householders$199,858 Black or African American householders $54,040 Asian householders$294,317 Some other race householders$122,818 Two or more races householders$192,713 Hispanic or Latino householders
Median age by race in Graham
46.1 Median age for White residents43.7 48.4 31.7 Median age for Black or African American residents29.9 40.6 53.3 Median age for American Indian / Alaska Native residents-668,604,650.5 64.4 66.3 Median age for Asian residents18.1 95.6 10.7 Median age for Native Hawaiian / Pacific Islander residents-635,658,914.1 -612,403,100.2 30.8 Median age for Other race residents25.6 32.1 27.4 Median age for Two or more races residents44.7 24.8 47.9 Median age for White alone residents46.4 49.5 28.1 Median age for Hispanic or Latino residents28.6 24.9
Owner/renter occupied households by race in Graham
House owners and renters - White residents 2,800 61.1% Owner occupied1,780 38.9% Renter occupiedHouse owners and renters - Black or African American residents 510 25.3% Owner occupied1,508 74.7% Renter occupiedHouse owners and renters - American Indian / Alaska Native residents 13 32.7% Owner occupied27 67.3% Renter occupiedHouse owners and renters - Asian residents 80 81.8% Owner occupied18 18.2% Renter occupiedHouse owners and renters - Native Hawaiian / Pacific Islander residents 5 100.0% Renter occupiedHouse owners and renters - Other race residents 315 41.1% Owner occupied452 58.9% Renter occupiedHouse owners and renters - Two or more races residents 340 62.3% Owner occupied206 37.7% Renter occupiedHouse owners and renters - White alone residents 2,710 60.5% Owner occupied1,769 39.5% Renter occupiedHouse owners and renters - Hispanic or Latino residents 544 53.4% Owner occupied474 46.6% Renter occupied
Language usage in Graham
English speakers - Total 84.0% of residents of Graham speak English at home.
13.2% of residents speak Spanish at home 1,553 71.7% Speak English very well613 28.3% Speak English less than very well2.7% of residents speak other language at home 205 47.2% Speak English very well229 52.8% Speak English less than very well
English speakers - Born in the United States 95.6% of residents of Graham speak English at home.
3.6% of residents speak Spanish at home 144 85.7% Speak English very well24 14.3% Speak English less than very well1.4% of residents speak other language at home 66 100.0% Speak English very well
English speakers - Native, born elsewhere 50.0% of residents of Graham speak English at home.
32.5% of residents speak Spanish at home 35 55.6% Speak English very well28 44.4% Speak English less than very well
English speakers - Foreign-born 25.7% of residents of Graham speak English at home.
60.2% of residents speak Spanish at home 541 50.2% Speak English very well536 49.8% Speak English less than very well14.5% of residents speak other language at home 106 40.9% Speak English very well153 59.1% Speak English less than very well
White (Caucasian) - Speak only English Native:
96.0% (8,622)Foreign-born:
21.7% (47)
White (Caucasian) - Speak another language Native:
3.1% (280)Foreign-born:
100.0% (215)
Black or African American - Speak only English Native:
98.2% (3,449)Foreign-born:
36.8% (106)
Black or African American - Speak another language Native:
1.8% (64)Foreign-born:
63.1% (181)
Asian - Speak only English Native:
49.1% (16)Foreign-born:
35.5% (32)
Asian - Speak another language Native:
42.0% (13)Foreign-born:
46.9% (42)
Other race - Speak only English Native:
10.3% (77)Foreign-born:
22.0% (202)
Other race - Speak another language Native:
91.6% (686)Foreign-born:
78.1% (715)
Two or more races - Speak another language Native:
16.0% (179)Foreign-born:
100.0% (297)
White alone - Speak only English Native:
97.4% (8,413)Foreign-born:
35.6% (56)
White alone - Speak another language Native:
2.7% (233)Foreign-born:
63.4% (100)
Hispanic or Latino - Speak only English Native:
45.8% (741)Foreign-born:
13.1% (160)
Hispanic or Latino - Speak another language Native:
56.4% (911)Foreign-born:
87.2% (1,066)
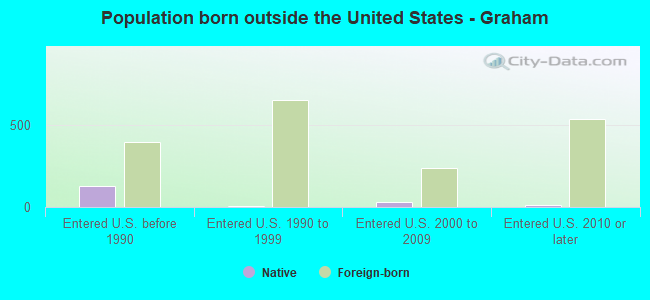
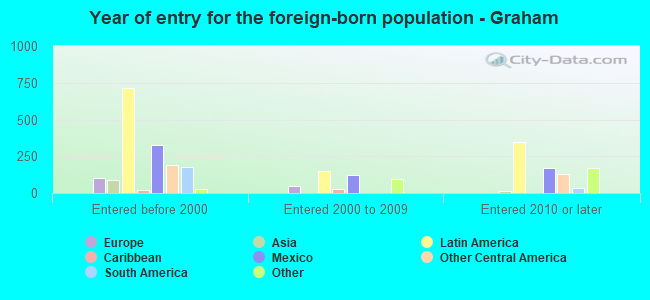
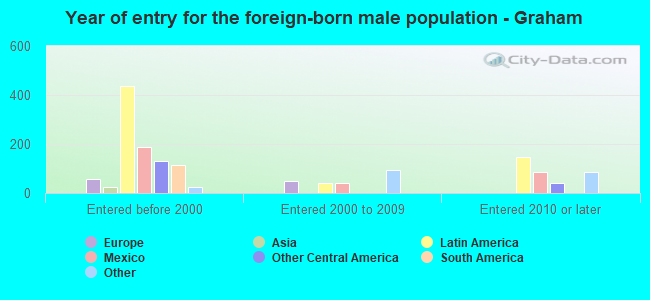
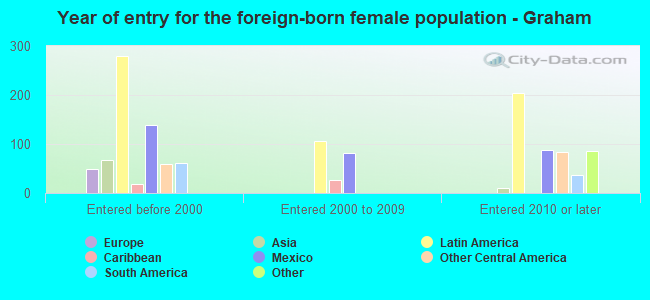
Foreign-born residents in Graham 1,791 residents are foreign born (6.9% Latin America , 1.5% Africa ).
This city:
10.2%North Carolina:
8.3%
Marital status for residents in Graham Marital status - White (Caucasian) population 15 years and over
Males 25.3% Never married57.2% Now married0.9% Separated5.2% Widowed11.3% DivorcedFemales 27.2% Never married44.5% Now married0.9% Separated14.1% Widowed13.3% DivorcedWomen who gave birth in the past 12 months Now married:
73.0% (119)Unmarried:
27.0% (44)
Women who did not give birth in the past 12 months Now married:
42.0% (820)Unmarried:
58.0% (1,131)
Marital status - Black or African American population 15 years and over
Males 64.1% Never married22.6% Now married0.5% Separated0.0% Widowed12.8% DivorcedFemales 54.4% Never married16.2% Now married1.0% Separated13.5% Widowed15.1% DivorcedWomen who gave birth in the past 12 months Now married:
0.0% (0)Unmarried:
100.0% (16)
Women who did not give birth in the past 12 months Now married:
8.7% (88)Unmarried:
91.3% (933)
Marital status - American Indian / Alaska Native population 15 years and over
Males 21.2% Never married78.8% Now married0.0% Separated0.0% Widowed0.0% DivorcedFemales 48.3% Never married37.9% Now married0.0% Separated13.8% Widowed0.0% DivorcedWomen who gave birth in the past 12 months Now married:
100.0% (4)Unmarried:
0.0% (0)
Women who did not give birth in the past 12 months Now married:
0.0% (0)Unmarried:
100.0% (15)
Marital status - Asian population 15 years and over
Males 65.9% Never married34.1% Now married0.0% Separated0.0% Widowed0.0% DivorcedFemales 0.0% Never married30.9% Now married0.0% Separated69.1% Widowed0.0% DivorcedMarital status - Native Hawaiian / Pacific Islander population 15 years and over
Males 100.0% Never married0.0% Now married0.0% Separated0.0% Widowed0.0% DivorcedFemales 100.0% Never married0.0% Now married0.0% Separated0.0% Widowed0.0% DivorcedWomen who did not give birth in the past 12 months Now married:
0.0% (0)Unmarried:
100.0% (8)
Marital status - Other race population 15 years and over
Males 22.4% Never married76.1% Now married0.0% Separated1.5% Widowed0.0% DivorcedFemales 21.5% Never married68.8% Now married0.0% Separated9.8% Widowed0.0% DivorcedWomen who gave birth in the past 12 months Now married:
0.0% (0)Unmarried:
100.0% (26)
Women who did not give birth in the past 12 months Now married:
65.3% (270)Unmarried:
34.7% (144)
Marital status - Two or more races population 15 years and over
Males 24.3% Never married55.8% Now married0.0% Separated3.1% Widowed16.8% DivorcedFemales 36.8% Never married40.7% Now married0.0% Separated0.0% Widowed22.5% DivorcedWomen who gave birth in the past 12 months Now married:
0.0% (0)Unmarried:
100.0% (67)
Women who did not give birth in the past 12 months Now married:
45.5% (268)Unmarried:
54.5% (322)
Marital status - White alone, not Hispanic / Latino population 15 years and over
Males 24.7% Never married57.0% Now married1.0% Separated5.1% Widowed12.2% DivorcedFemales 26.6% Never married43.8% Now married1.0% Separated15.1% Widowed13.5% DivorcedWomen who gave birth in the past 12 months Now married:
66.0% (91)Unmarried:
34.0% (47)
Women who did not give birth in the past 12 months Now married:
42.7% (807)Unmarried:
57.3% (1,082)
Marital status - Hispanic or Latino population 15 years and over
Males 28.0% Never married63.1% Now married0.0% Separated2.3% Widowed6.7% DivorcedFemales 36.2% Never married52.3% Now married0.0% Separated4.1% Widowed7.3% DivorcedWomen who gave birth in the past 12 months Now married:
36.3% (40)Unmarried:
63.7% (70)
Women who did not give birth in the past 12 months Now married:
45.3% (321)Unmarried:
54.7% (388)
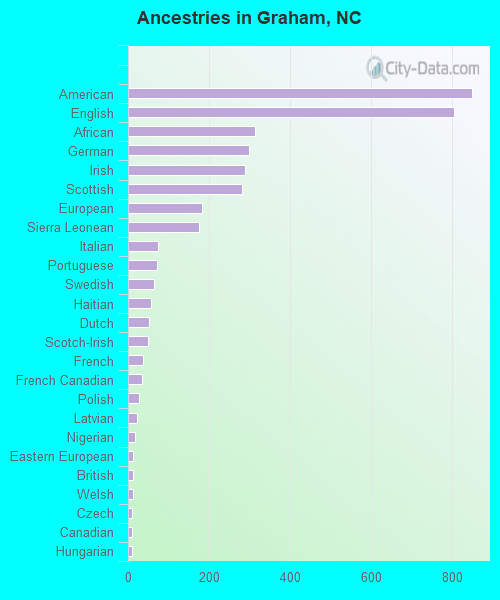
Ancestries in Graham
850 10.2% American806 9.7% English315 3.8% African299 3.6% German290 3.5% Irish282 3.4% Scottish182 2.2% European175 2.1% Sierra Leonean74 0.9% Italian71 0.9% Portuguese65 0.8% Swedish56 0.7% Haitian53 0.6% Dutch49 0.6% Scotch-Irish36 0.4% French35 0.4% French Canadian26 0.3% Polish22 0.3% Latvian18 0.2% Nigerian13 0.2% Eastern European12 0.1% British12 0.1% Welsh10 0.1% Czech9 0.1% Canadian9 0.1% Hungarian6 0.07% Slovak5 0.06% Jamaican4 0.05% Russian
Geographical mobility in Graham Same house 1 year ago 8,554 89.3% White (Caucasian)3,285 78.5% Black or African American69 100.0% American Indian / Alaska Native129 100.0% Asian28 100.0% Native Hawaiian / Pacific Islander1,785 94.8% Other race1,221 74.6% Two or more races8,154 89.5% White alone, not Hispanic / Latino2,665 85.1% Hispanic or LatinoMoved within same county 603 6.3% White / Caucasian923 22.1% Black or African American47 2.5% Other race252 15.4% Two or more races532 5.8% White alone, not Hispanic / Latino189 6.0% Hispanic or LatinoMoved within same state 218 2.3% White / Caucasian95 2.3% Black or African American11 0.6% Other race130 7.9% Two or more races247 2.7% White alone, not Hispanic / Latino75 2.4% Hispanic or LatinoMoved from different state 188 2.0% White / Caucasian129 3.1% Black or African American166 1.8% White alone, not Hispanic / Latino22 0.7% Hispanic or LatinoMoved from abroad 8 0.2% Black or African American13 0.8% Two or more races
Children Nativity (place of birth) in Graham
Children under 6 years - Living with two parents Both parents native 594 98.0% Native12 2.0% Foreign-bornBoth parents foreign-born 80 100.0% NativeOne native, one foreign-born parent 65 100.0% NativeChildren under 6 years - Living with one parent Native parent 364 100.0% NativeForeign-born parent 111 100.0% NativeChildren 6 to 17 years - Living with two parents Both parents native 794 99.8% Native1 0.2% Foreign-bornBoth parents foreign-born 159 86.0% Native26 14.0% Foreign-bornOne native, one foreign-born parent 66 100.0% NativeChildren 6 to 17 years - Living with one parent Native parent 826 100.0% NativeForeign-born parent 136 56.3% Native106 43.7% Foreign-born
Grandparents responsible for own grandchildren in Graham
Grandparents (30 to 59 years) White / Caucasian 17 23.0% Responsible for grandchildren56 77.0% Not responsible for grandchildrenBlack or African American 31 79.1% Responsible for grandchildren8 20.9% Not responsible for grandchildrenOther race 38 100.0% Responsible for grandchildrenTwo or more races 15 100.0% Not responsible for grandchildrenWhite alone, not Hispanic / Latino 18 20.5% Responsible for grandchildren69 79.5% Not responsible for grandchildrenHispanic or Latino 30 70.0% Responsible for grandchildren13 30.0% Not responsible for grandchildrenGrandparents (60 years and over) White / Caucasian 54 42.6% Responsible for grandchildren72 57.4% Not responsible for grandchildrenBlack or African American 93 75.2% Responsible for grandchildren31 24.8% Not responsible for grandchildrenOther race 8 100.0% Not responsible for grandchildrenTwo or more races 21 100.0% Not responsible for grandchildrenWhite alone, not Hispanic / Latino 64 46.6% Responsible for grandchildren73 53.4% Not responsible for grandchildrenHispanic or Latino 11 100.0% Not responsible for grandchildren