Races in Granby, Connecticut (CT) Detailed Stats
Ancestries, Foreign-born residents, place of birth

Discuss Granby, Connecticut races on our local forum with over 2,400,000 registered users
3.8% of Granby, CT residents are foreign-born (2.1% born in Europe, 0.7% born in North America, 0.5% born in Asia, 0.4% born in Latin America), which is 295.9% less than the foreign-born rate of 15.0% across the entire state of Connecticut.
Race distribution in Granby

- 10,00096.6%White alone
- 1341.3%Hispanic
- 770.7%Asian alone
- 610.6%Black alone
- 490.5%Two or more races
- 230.2%American Indian alone
- 20.02%Native Hawaiian and Other
Pacific Islander alone - 10.01%Other race alone

2000
2022
-
- 2,638,84577.5%White alone
- 320,3239.4%Hispanic
- 295,5718.7%Black alone
- 81,5642.4%Asian alone
- 52,8961.6%Two or more races
- 8,1410.2%Other race alone
- 7,2670.2%American Indian alone
- 9580.03%Native Hawaiian and Other
Pacific Islander alone

-
- 2,246,91362.0%White alone
- 658,97818.2%Hispanic
- 353,9739.8%Black alone
- 172,9294.8%Asian alone
- 159,6314.4%Two or more races
- 29,7610.8%Other race alone
- 3,4280.09%American Indian alone
- 5920.02%Native Hawaiian and Other
Pacific Islander alone

Income and house value in Granby
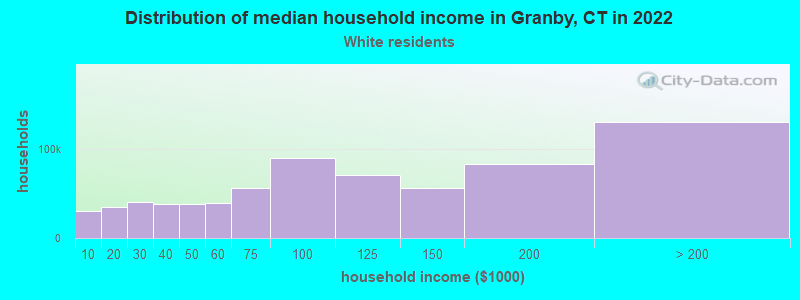
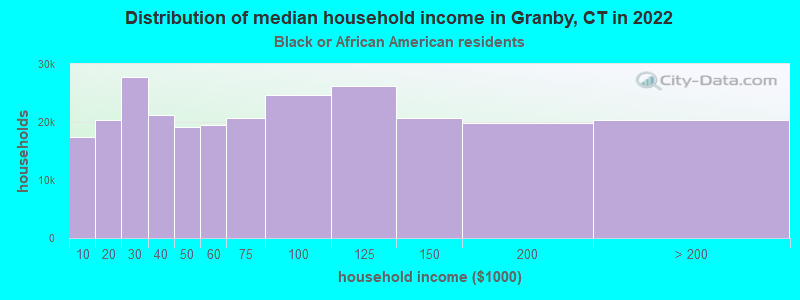
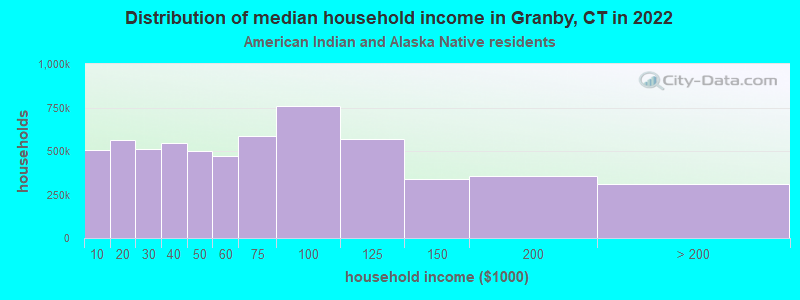
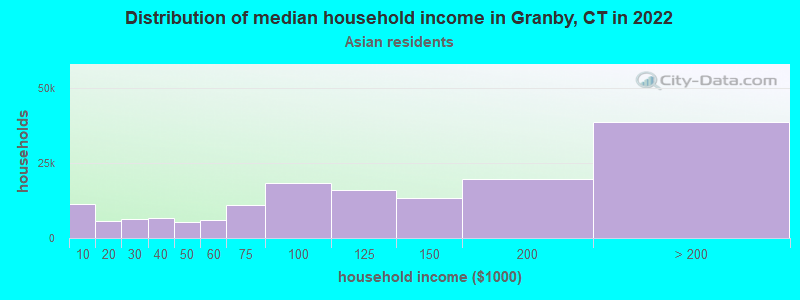
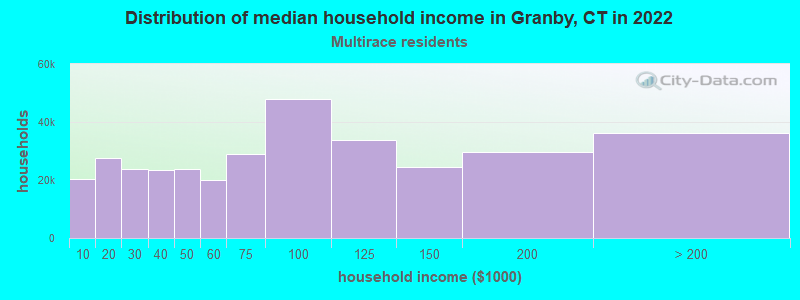
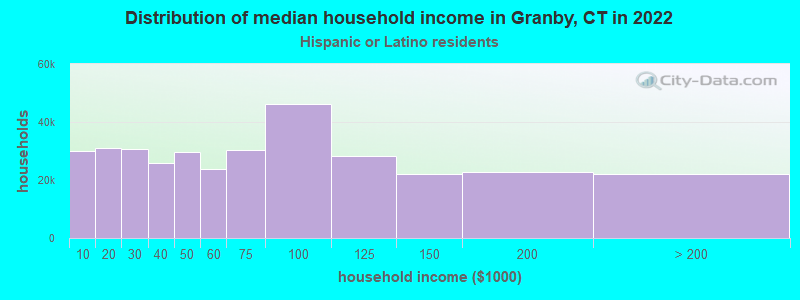
- Median household income in 2022
- $137,296White non-Hispanic householders
- $105,854Black householders
- over $200,000American Indian and Alaska Native householders
- over $200,000Asian householders
- $96,064Some other race householders
- over $200,000Two or more races householders
- $88,171Hispanic or Latino race householders
- Median 2022 house value
- $381,357White Non-Hispanic householders
- $494,641Black or African American householders
- $594,520American Indian or Alaska Native householders
- $459,402Asian householders
- $405,354Some other race householders
- $486,425Two or more races householders
- $378,331Hispanic or Latino householders
Household income for White non-Hispanic householders
Household income for Black householders
Household income for American Indian and Alaska Native householders
Household income for Asian householders
Household income for Two or more races householders
Household income for Hispanic or Latino race householders
Foreign-born residents in Granby
392 residents are foreign born (2.1% Europe, 0.7% North America, 0.5% Asia, 0.4% Latin America).
| This city: | 3.8% |
| Connecticut: | 10.9% |
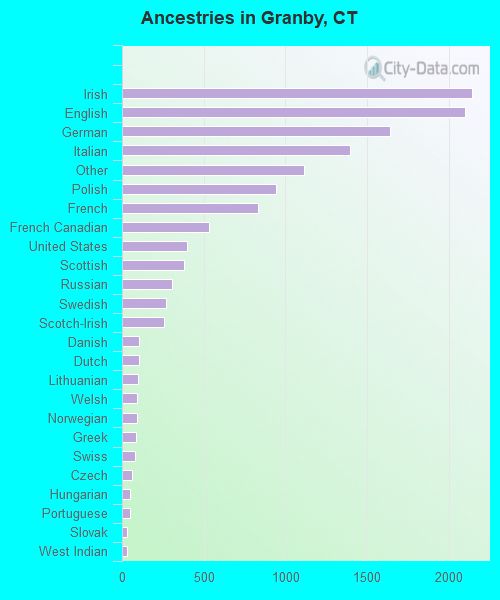
Ancestries in Granby

- 2,14016.2%Irish
- 2,10015.9%English
- 1,64112.4%German
- 1,39310.6%Italian
- 1,1138.4%Other
- 9417.1%Polish
- 8306.3%French
- 5344.0%French Canadian
- 3993.0%United States
- 3792.9%Scottish
- 3052.3%Russian
- 2682.0%Swedish
- 2561.9%Scotch-Irish
- 1050.8%Danish
- 1040.8%Dutch
- 960.7%Lithuanian
- 930.7%Welsh
- 910.7%Norwegian
- 870.7%Greek
- 800.6%Swiss
- 640.5%Czech
- 490.4%Hungarian
- 490.4%Portuguese
- 290.2%Slovak
- 290.2%West Indian
- 190.1%Ukrainian
- 90.07%Arab
Zip codes: 06035.