Races in Grand Forks, North Dakota (ND) Detailed Stats
Data:
Races - White alone (%)
Races - White alone (% change since 2000)
Races - Black alone (%)
Races - Black alone (% change since 2000)
Races - American Indian alone (%)
Races - American Indian alone (% change since 2000)
Races - Asian alone (%)
Races - Asian alone (% change since 2000)
Races - Hispanic (%)
Races - Hispanic (% change since 2000)
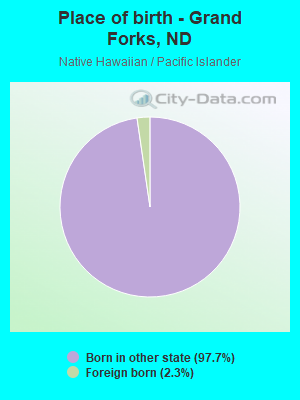
Races - Native Hawaiian and Other Pacific Islander alone (%)
Races - Native Hawaiian and Other Pacific Islander alone (% change since 2000)
Races - Two or more races(%)
Races - Two or more races(% change since 2000)
Races - Other race alone (%)
Races - Other race alone (% change since 2000)
Racial diversity
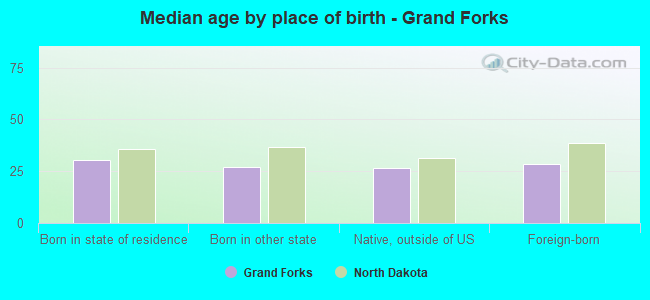
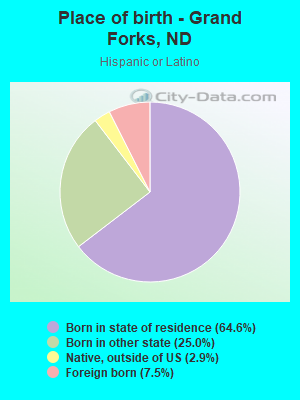
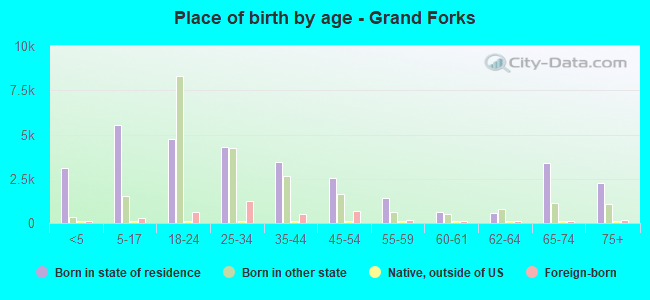
Place of birth - Born in state of residence (%)
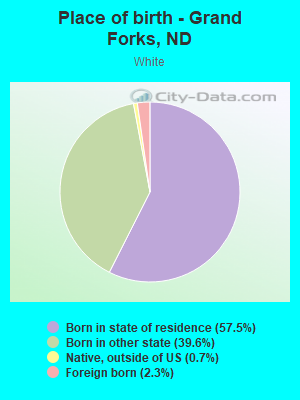
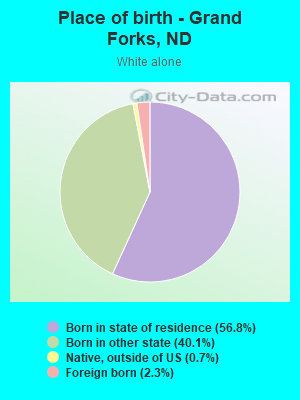
Place of birth - Born in state of residence (%) - White
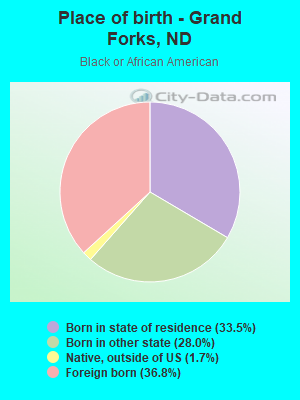
Place of birth - Born in state of residence (%) - Black or African American
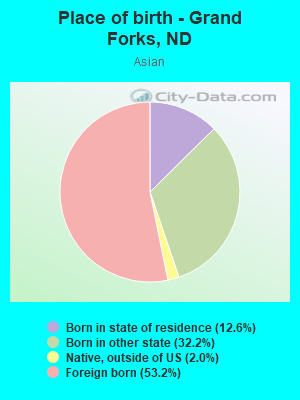
Place of birth - Born in state of residence (%) - Asian
Place of birth - Born in state of residence (%) - Hispanic or Latino
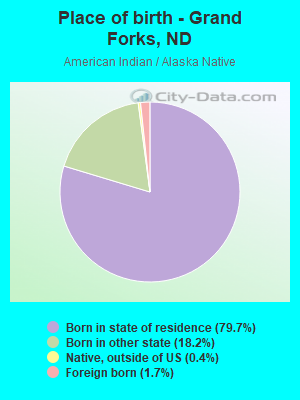
Place of birth - Born in state of residence (%) - American Indian and Alaska Native
Place of birth - Born in state of residence (%) - Multirace
Place of birth - Born in state of residence (%) - Other Race
Place of birth - Born in other state (%)
Place of birth - Born in other state (%) - White
Place of birth - Born in other state (%) - Black or African American
Place of birth - Born in other state (%) - Asian
Place of birth - Born in other state (%) - Hispanic or Latino
Place of birth - Born in other state (%) - American Indian and Alaska Native
Place of birth - Born in other state (%) - Multirace
Place of birth - Born in other state (%) - Other Race
Place of birth - Native, outside of US (%)
Place of birth - Native, outside of US (%) - White
Place of birth - Native, outside of US (%) - Black or African American
Place of birth - Native, outside of US (%) - Asian
Place of birth - Native, outside of US (%) - Hispanic or Latino
Place of birth - Native, outside of US (%) - American Indian and Alaska Native
Place of birth - Native, outside of US (%) - Multirace
Place of birth - Native, outside of US (%) - Other Race
Place of birth - Foreign born (%)
Place of birth - Foreign born (%) - White
Place of birth - Foreign born (%) - Black or African American
Place of birth - Foreign born (%) - Asian
Place of birth - Foreign born (%) - Hispanic or Latino
Place of birth - Foreign born (%) - American Indian and Alaska Native
Place of birth - Foreign born (%) - Multirace
Place of birth - Foreign born (%) - Other Race
Residents speaking English at home (%)
Residents speaking English at home - Born in the United States (%)
Residents speaking English at home - Native, born elsewhere (%)
Residents speaking English at home - Foreign born (%)
Residents speaking Spanish at home (%)
Residents speaking Spanish at home - Born in the United States (%)
Residents speaking Spanish at home - Native, born elsewhere (%)
Residents speaking Spanish at home - Foreign born (%)
Residents speaking other language at home (%)
Residents speaking other language at home - Born in the United States (%)
Residents speaking other language at home - Native, born elsewhere (%)
Residents speaking other language at home - Foreign born (%)
Marital status - Never married (%)
Marital status - Now married (%)
Marital status - Separated (%)
Marital status - Widowed (%)
Marital status - Divorced (%)
Ancestries Reported - Arab (%)
Ancestries Reported - Czech (%)
Ancestries Reported - Danish (%)
Ancestries Reported - Dutch (%)
Ancestries Reported - English (%)
Ancestries Reported - French (%)
Ancestries Reported - French Canadian (%)
Ancestries Reported - German (%)
Ancestries Reported - Greek (%)
Ancestries Reported - Hungarian (%)
Ancestries Reported - Irish (%)
Ancestries Reported - Italian (%)
Ancestries Reported - Lithuanian (%)
Ancestries Reported - Norwegian (%)
Ancestries Reported - Polish (%)
Ancestries Reported - Portuguese (%)
Ancestries Reported - Russian (%)
Ancestries Reported - Scotch-Irish (%)
Ancestries Reported - Scottish (%)
Ancestries Reported - Slovak (%)
Ancestries Reported - Subsaharan African (%)
Ancestries Reported - Swedish (%)
Ancestries Reported - Swiss (%)
Ancestries Reported - Ukrainian (%)
Ancestries Reported - United States (%)
Ancestries Reported - Welsh (%)
Ancestries Reported - West Indian (%)
Ancestries Reported - Other (%)
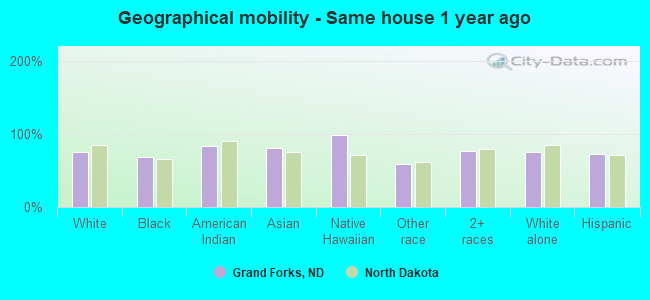
Geographical mobility - Same house 1 year ago (%)
Geographical mobility - Same house 1 year ago (%) - White
Geographical mobility - Same house 1 year ago (%) - Black or African American
Geographical mobility - Same house 1 year ago (%) - Asian
Geographical mobility - Same house 1 year ago (%) - Hispanic or Latino
Geographical mobility - Same house 1 year ago (%) - American Indian and Alaska Native
Geographical mobility - Same house 1 year ago (%) - Multirace
Geographical mobility - Same house 1 year ago (%) - Other Race
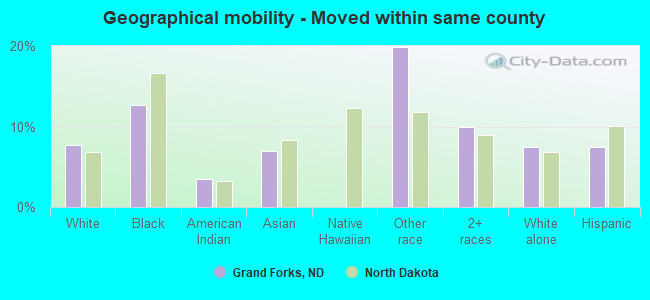
Geographical mobility - Moved within same county (%)
Geographical mobility - Moved within same county (%) - White
Geographical mobility - Moved within same county (%) - Black or African American
Geographical mobility - Moved within same county (%) - Asian
Geographical mobility - Moved within same county (%) - Hispanic or Latino
Geographical mobility - Moved within same county (%) - American Indian and Alaska Native
Geographical mobility - Moved within same county (%) - Multirace
Geographical mobility - Moved within same county (%) - Other Race
Geographical mobility - Moved from different county within same state (%)
Geographical mobility - Moved from different county within same state (%) - White
Geographical mobility - Moved from different county within same state (%) - Black or African American
Geographical mobility - Moved from different county within same state (%) - Asian
Geographical mobility - Moved from different county within same state (%) - Hispanic or Latino
Geographical mobility - Moved from different county within same state (%) - American Indian and Alaska Native
Geographical mobility - Moved from different county within same state (%) - Multirace
Geographical mobility - Moved from different county within same state (%) - Other Race
Geographical mobility - Moved from different state (%)
Geographical mobility - Moved from different state (%) - White
Geographical mobility - Moved from different state (%) - Black or African American
Geographical mobility - Moved from different state (%) - Asian
Geographical mobility - Moved from different state (%) - Hispanic or Latino
Geographical mobility - Moved from different state (%) - American Indian and Alaska Native
Geographical mobility - Moved from different state (%) - Multirace
Geographical mobility - Moved from different state (%) - Other Race
Geographical mobility - Moved from abroad (%)
Geographical mobility - Moved from abroad (%) - White
Geographical mobility - Moved from abroad (%) - Black or African American
Geographical mobility - Moved from abroad (%) - Asian
Geographical mobility - Moved from abroad (%) - Hispanic or Latino
Geographical mobility - Moved from abroad (%) - American Indian and Alaska Native
Geographical mobility - Moved from abroad (%) - Multirace
Geographical mobility - Moved from abroad (%) - Other Race
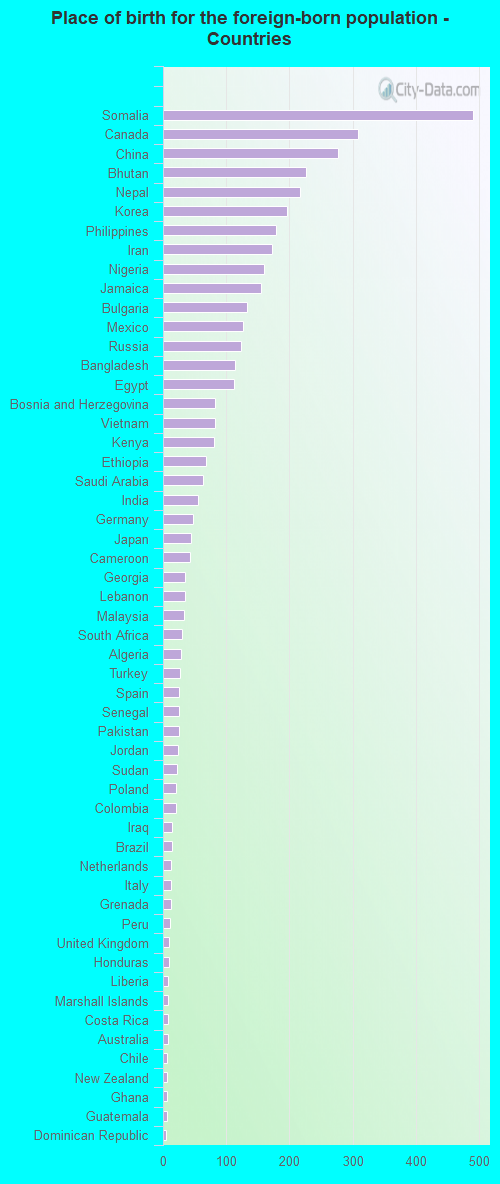
Place of birth for the foreign-born population - Ireland (%)
Place of birth for the foreign-born population - Denmark (%)
Place of birth for the foreign-born population - Norway (%)
Place of birth for the foreign-born population - Sweden (%)
Place of birth for the foreign-born population - United Kingdom (%)
Place of birth for the foreign-born population - England (%)
Place of birth for the foreign-born population - Scotland (%)
Place of birth for the foreign-born population - Other Northern Europe (%)
Place of birth for the foreign-born population - Austria (%)
Place of birth for the foreign-born population - Belgium (%)
Place of birth for the foreign-born population - France (%)
Place of birth for the foreign-born population - Germany (%)
Place of birth for the foreign-born population - Netherlands (%)
Place of birth for the foreign-born population - Switzerland (%)
Place of birth for the foreign-born population - Other Western Europe (%)
Place of birth for the foreign-born population - Greece (%)
Place of birth for the foreign-born population - Italy (%)
Place of birth for the foreign-born population - Portugal (%)
Place of birth for the foreign-born population - Spain (%)
Place of birth for the foreign-born population - Other Southern Europe (%)
Place of birth for the foreign-born population - Albania (%)
Place of birth for the foreign-born population - Belarus (%)
Place of birth for the foreign-born population - Bosnia and Herzegovina (%)
Place of birth for the foreign-born population - Bulgaria (%)
Place of birth for the foreign-born population - Croatia (%)
Place of birth for the foreign-born population - Czechoslovakia (%)
Place of birth for the foreign-born population - Hungary (%)
Place of birth for the foreign-born population - Latvia (%)
Place of birth for the foreign-born population - Lithuania (%)
Place of birth for the foreign-born population - North Macedonia (Macedonia) (%)
Place of birth for the foreign-born population - Moldova (%)
Place of birth for the foreign-born population - Poland (%)
Place of birth for the foreign-born population - Romania (%)
Place of birth for the foreign-born population - Russia (%)
Place of birth for the foreign-born population - Serbia (%)
Place of birth for the foreign-born population - Ukraine (%)
Place of birth for the foreign-born population - Other Eastern Europe (%)
Place of birth for the foreign-born population - China (%)
Place of birth for the foreign-born population - Hong Kong (%)
Place of birth for the foreign-born population - Taiwan (%)
Place of birth for the foreign-born population - Japan (%)
Place of birth for the foreign-born population - Korea (%)
Place of birth for the foreign-born population - Other Eastern Asia (%)
Place of birth for the foreign-born population - Afghanistan (%)
Place of birth for the foreign-born population - Bangladesh (%)
Place of birth for the foreign-born population - India (%)
Place of birth for the foreign-born population - Iran (%)
Place of birth for the foreign-born population - Kazakhstan (%)
Place of birth for the foreign-born population - Nepal (%)
Place of birth for the foreign-born population - Pakistan (%)
Place of birth for the foreign-born population - Sri Lanka (%)
Place of birth for the foreign-born population - Uzbekistan (%)
Place of birth for the foreign-born population - Other South Central Asia (%)
Place of birth for the foreign-born population - Burma (%)
Place of birth for the foreign-born population - Cambodia (%)
Place of birth for the foreign-born population - Indonesia (%)
Place of birth for the foreign-born population - Laos (%)
Place of birth for the foreign-born population - Malaysia (%)
Place of birth for the foreign-born population - Philippines (%)
Place of birth for the foreign-born population - Singapore (%)
Place of birth for the foreign-born population - Thailand (%)
Place of birth for the foreign-born population - Vietnam (%)
Place of birth for the foreign-born population - Other South Eastern Asia (%)
Place of birth for the foreign-born population - Armenia (%)
Place of birth for the foreign-born population - Iraq (%)
Place of birth for the foreign-born population - Israel (%)
Place of birth for the foreign-born population - Jordan (%)
Place of birth for the foreign-born population - Kuwait (%)
Place of birth for the foreign-born population - Lebanon (%)
Place of birth for the foreign-born population - Saudi Arabia (%)
Place of birth for the foreign-born population - Syria (%)
Place of birth for the foreign-born population - Turkey (%)
Place of birth for the foreign-born population - Yemen (%)
Place of birth for the foreign-born population - Other Western Asia (%)
Place of birth for the foreign-born population - Eritrea (%)
Place of birth for the foreign-born population - Ethiopia (%)
Place of birth for the foreign-born population - Kenya (%)
Place of birth for the foreign-born population - Somalia (%)
Place of birth for the foreign-born population - Uganda (%)
Place of birth for the foreign-born population - Zimbabwe (%)
Place of birth for the foreign-born population - Other Eastern Africa (%)
Place of birth for the foreign-born population - Cameroon (%)
Place of birth for the foreign-born population - Congo (%)
Place of birth for the foreign-born population - Democratic Republic of Congo (Zaire) (%)
Place of birth for the foreign-born population - Other Middle Africa (%)
Place of birth for the foreign-born population - Egypt (%)
Place of birth for the foreign-born population - Morocco (%)
Place of birth for the foreign-born population - Sudan (%)
Place of birth for the foreign-born population - Other Northern Africa (%)
Place of birth for the foreign-born population - South Africa (%)
Place of birth for the foreign-born population - Other Southern Africa (%)
Place of birth for the foreign-born population - Cabo Verde (%)
Place of birth for the foreign-born population - Ghana (%)
Place of birth for the foreign-born population - Liberia (%)
Place of birth for the foreign-born population - Nigeria (%)
Place of birth for the foreign-born population - Senegal (%)
Place of birth for the foreign-born population - Sierra Leone (%)
Place of birth for the foreign-born population - Other Western Africa (%)
Place of birth for the foreign-born population - Australia (%)
Place of birth for the foreign-born population - New Zealand (%)
Place of birth for the foreign-born population - Fiji (%)
Place of birth for the foreign-born population - Micronesia (%)
Place of birth for the foreign-born population - Bahamas (%)
Place of birth for the foreign-born population - Barbados (%)
Place of birth for the foreign-born population - Cuba (%)
Place of birth for the foreign-born population - Dominica (%)
Place of birth for the foreign-born population - Dominican Republic (%)
Place of birth for the foreign-born population - Grenada (%)
Place of birth for the foreign-born population - Haiti (%)
Place of birth for the foreign-born population - Jamaica (%)
Place of birth for the foreign-born population - St. Vincent and the Grenadines (%)
Place of birth for the foreign-born population - Trinidad and Tobago (%)
Place of birth for the foreign-born population - West Indies (%)
Place of birth for the foreign-born population - Other Caribbean (%)
Place of birth for the foreign-born population - Belize (%)
Place of birth for the foreign-born population - Costa Rica (%)
Place of birth for the foreign-born population - El Salvador (%)
Place of birth for the foreign-born population - Guatemala (%)
Place of birth for the foreign-born population - Honduras (%)
Place of birth for the foreign-born population - Mexico (%)
Place of birth for the foreign-born population - Nicaragua (%)
Place of birth for the foreign-born population - Panama (%)
Place of birth for the foreign-born population - Other Central America (%)
Place of birth for the foreign-born population - Argentina (%)
Place of birth for the foreign-born population - Bolivia (%)
Place of birth for the foreign-born population - Brazil (%)
Place of birth for the foreign-born population - Chile (%)
Place of birth for the foreign-born population - Colombia (%)
Place of birth for the foreign-born population - Ecuador (%)
Place of birth for the foreign-born population - Guyana (%)
Place of birth for the foreign-born population - Peru (%)
Place of birth for the foreign-born population - Uruguay (%)
Place of birth for the foreign-born population - Venezuela (%)
Place of birth for the foreign-born population - Other South America (%)
Place of birth for the foreign-born population - Canada (%)
Place of birth for the foreign-born population - Other Northern America (%)
Place of birth for the foreign-born population - Other (%)
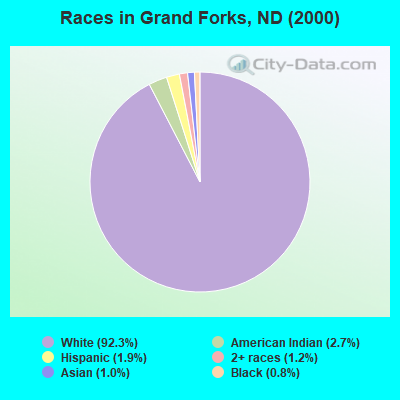
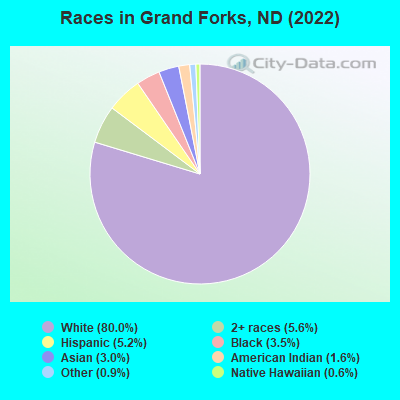
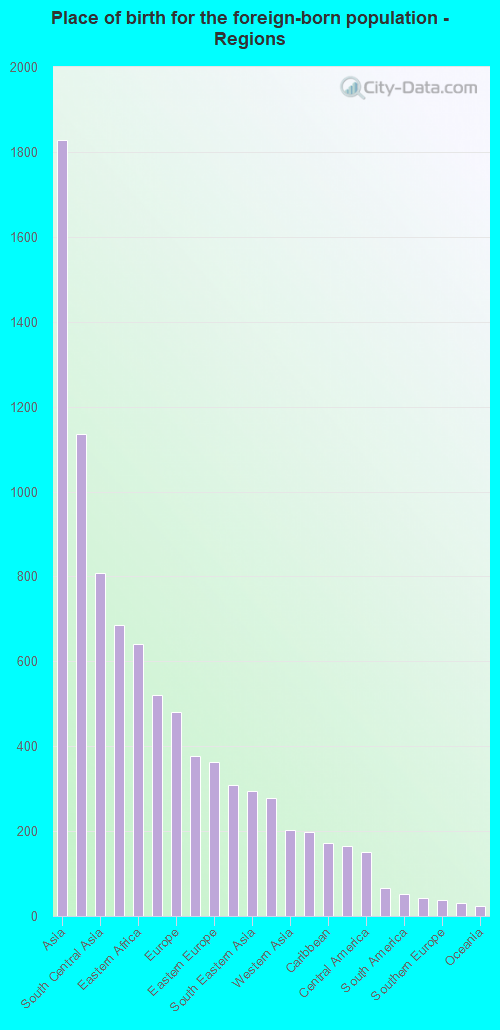
According to 2022 data, the most numerous races in Grand Forks, ND are White alone (46,803 residents), Hispanic (3,062 residents), and American Indian alone (923 residents). 91.3% of Grand Forks residents speak English at home. 7.1% of Grand Forks, ND residents are foreign-born (3.0% born in Asia, 1.9% born in Africa, 0.8% born in Europe), which is 43.7% greater than the foreign-born rate of 4.0% across the entire state of North Dakota.
Race distribution in Grand Forks
2000 2022
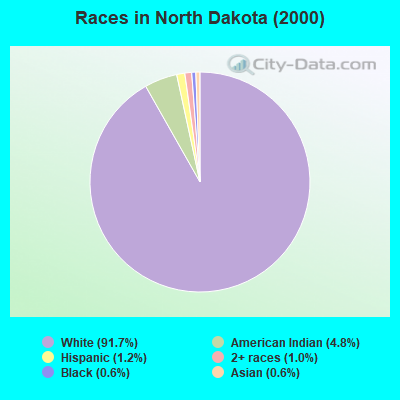
589,149 91.7% White alone 30,772 4.8% American Indian alone 7,786 1.2% Hispanic 6,666 1.0% Two or more races 3,761 0.6% Black alone 3,566 0.6% Asian alone 282 0.04% Other race alone 218 0.03% Native Hawaiian and Other
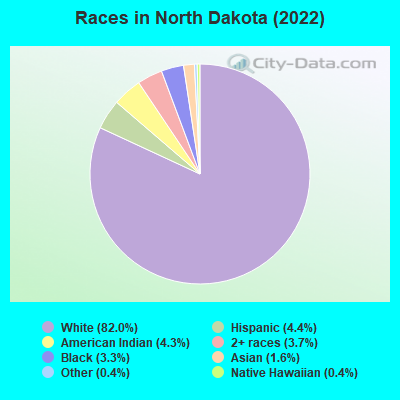
639,297 82.0% White alone 34,233 4.4% Hispanic 33,252 4.3% American Indian alone 28,831 3.7% Two or more races 25,426 3.3% Black alone 12,271 1.6% Asian alone 3,206 0.4% Other race alone 2,745 0.4% Native Hawaiian and Other
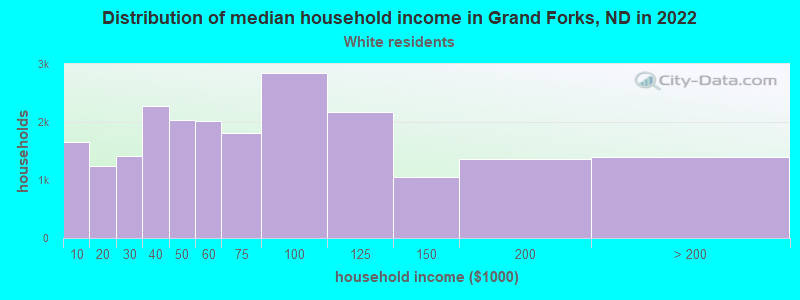
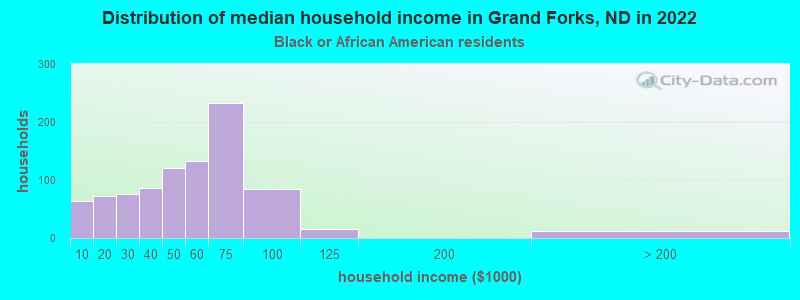
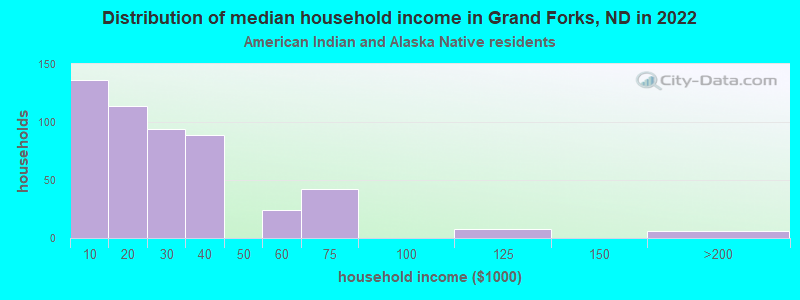
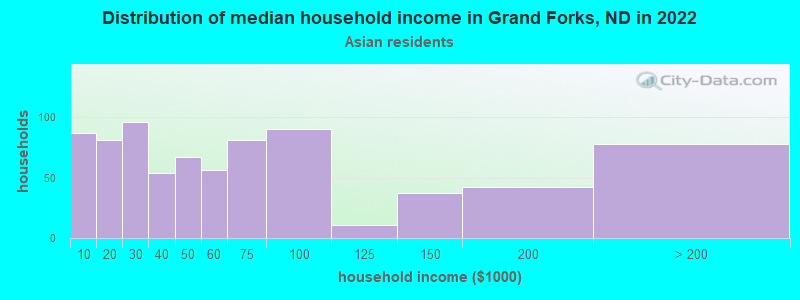
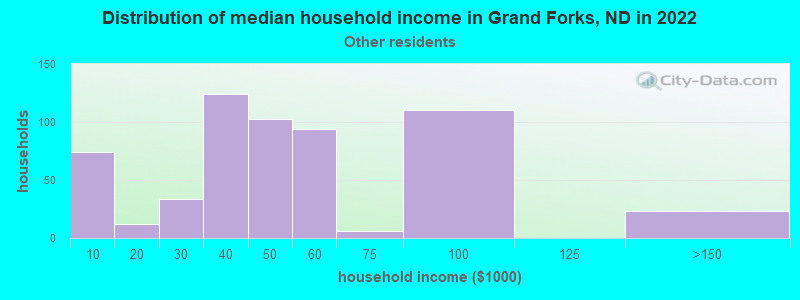
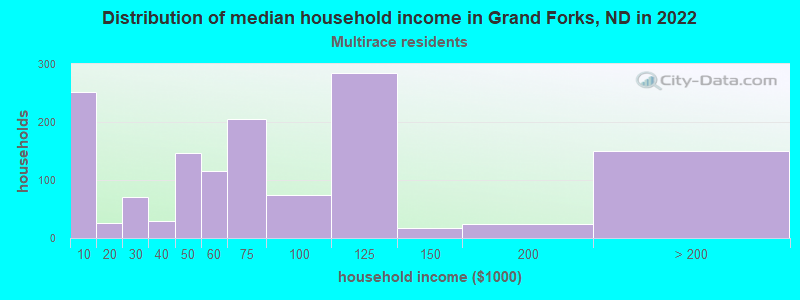
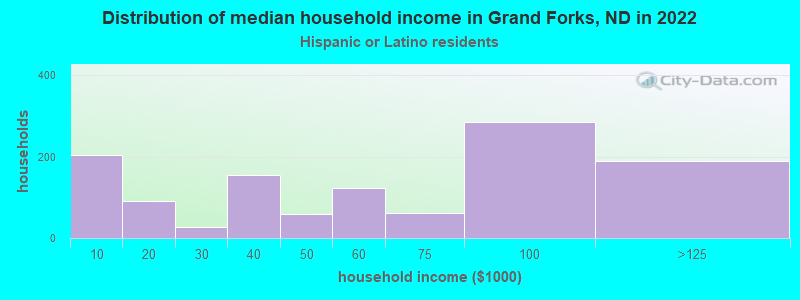
Income and house value in Grand Forks Median household income in 2022 $59,691 White non-Hispanic householders$57,814 Black householders$20,476 American Indian and Alaska Native householders$57,280 Asian householders$51,898 Some other race householders$73,714 Two or more races householders$78,268 Hispanic or Latino race householdersMedian 2022 house value $261,809 White Non-Hispanic householders$248,216 Black or African American householders$253,109 American Indian or Alaska Native householders $243,050 Asian householders$342,010 Some other race householders$233,807 Two or more races householders$350,166 Hispanic or Latino householders
Median age by race in Grand Forks
30.6 Median age for White residents29.6 32.1 26.8 Median age for Black or African American residents30.7 19.5 31.3 Median age for American Indian / Alaska Native residents48.1 15.8 24.8 Median age for Asian residents24.0 28.7 21.3 Median age for Native Hawaiian / Pacific Islander residents16.4 -666,666,666.0 33.3 Median age for Other race residents35.8 32.2 21.0 Median age for Two or more races residents19.9 25.2 31.3 Median age for White alone residents30.5 32.1 23.6 Median age for Hispanic or Latino residents21.7 32.4
Owner/renter occupied households by race in Grand Forks
House owners and renters - White residents 11,786 56.2% Owner occupied9,180 43.8% Renter occupiedHouse owners and renters - Black or African American residents 63 10.5% Owner occupied541 89.5% Renter occupiedHouse owners and renters - American Indian / Alaska Native residents 66 15.3% Owner occupied368 84.7% Renter occupiedHouse owners and renters - Asian residents 226 31.7% Owner occupied486 68.3% Renter occupiedHouse owners and renters - Native Hawaiian / Pacific Islander residents 122 100.0% Renter occupiedHouse owners and renters - Other race residents 256 37.5% Owner occupied427 62.5% Renter occupiedHouse owners and renters - Two or more races residents 591 38.9% Owner occupied929 61.1% Renter occupiedHouse owners and renters - White alone residents 11,741 56.4% Owner occupied9,090 43.6% Renter occupiedHouse owners and renters - Hispanic or Latino residents 426 56.4% Owner occupied329 43.6% Renter occupied
Language usage in Grand Forks
English speakers - Total 91.3% of residents of Grand Forks speak English at home.
1.7% of residents speak Spanish at home 791 84.9% Speak English very well141 15.1% Speak English less than very well7.0% of residents speak other language at home 2,468 63.9% Speak English very well1,394 36.1% Speak English less than very well
English speakers - Born in the United States 92.7% of residents of Grand Forks speak English at home.
2.2% of residents speak Spanish at home 444 91.2% Speak English very well43 8.8% Speak English less than very well5.0% of residents speak other language at home 1,070 95.6% Speak English very well49 4.4% Speak English less than very well
English speakers - Native, born elsewhere 73.1% of residents of Grand Forks speak English at home.
3.2% of residents speak Spanish at home 13 100.0% Speak English less than very well30.6% of residents speak other language at home 58 46.0% Speak English very well68 54.0% Speak English less than very well
English speakers - Foreign-born 33.6% of residents of Grand Forks speak English at home.
5.3% of residents speak Spanish at home 139 83.7% Speak English very well27 16.3% Speak English less than very well66.7% of residents speak other language at home 982 46.6% Speak English very well1,124 53.4% Speak English less than very well
White (Caucasian) - Speak only English Native:
96.7% (42,988)Foreign-born:
73.9% (658)
White (Caucasian) - Speak another language Native:
3.3% (1,472)Foreign-born:
68.3% (608)
Black or African American - Speak only English Native:
94.7% (1,123)Foreign-born:
53.5% (563)
Black or African American - Speak another language Native:
4.7% (56)Foreign-born:
50.4% (531)
American Indian / Alaska Native - Speak only English Native:
85.2% (1,119)Foreign-born:
81.2% (36)
Asian - Speak only English Native:
41.7% (181)Foreign-born:
13.9% (174)
Asian - Speak another language Native:
57.6% (251)Foreign-born:
85.7% (1,076)
Native Hawaiian / Pacific Islander - Speak only English Native:
99.5% (339)Foreign-born:
96.3% (8)
Other race - Speak only English Native:
58.7% (658)Foreign-born:
4.4% (12)
Other race - Speak another language Native:
39.0% (437)Foreign-born:
95.1% (250)
Two or more races - Speak only English Native:
89.5% (2,896)Foreign-born:
72.9% (127)
Two or more races - Speak another language Native:
10.3% (332)Foreign-born:
37.0% (64)
White alone - Speak only English Native:
96.9% (42,627)Foreign-born:
72.8% (658)
White alone - Speak another language Native:
3.2% (1,419)Foreign-born:
63.2% (571)
Hispanic or Latino - Speak only English Native:
68.2% (1,640)Foreign-born:
17.0% (42)
Hispanic or Latino - Speak another language Native:
29.3% (706)Foreign-born:
82.0% (205)
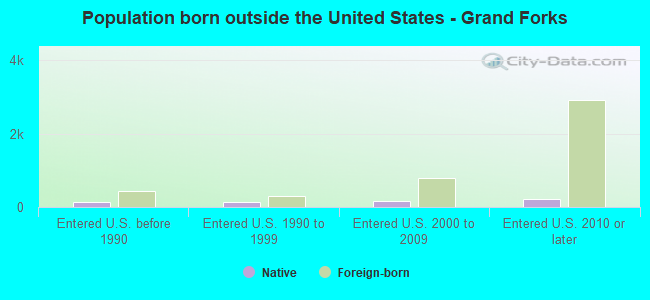
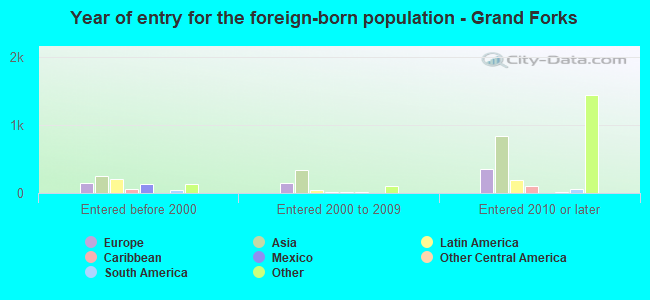
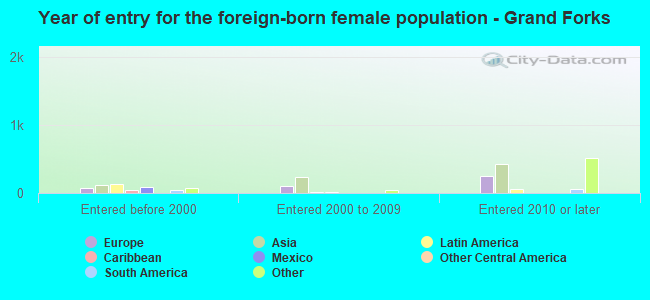
Foreign-born residents in Grand Forks 4,155 residents are foreign born (3.0% Asia , 1.9% Africa , 0.8% Europe ).
This city:
7.1%North Dakota:
4.6%
Marital status for residents in Grand Forks Marital status - White (Caucasian) population 15 years and over
Males 50.4% Never married36.8% Now married0.5% Separated2.5% Widowed9.9% DivorcedFemales 40.1% Never married38.8% Now married1.2% Separated8.1% Widowed11.9% DivorcedWomen who gave birth in the past 12 months Now married:
83.7% (542)Unmarried:
16.3% (106)
Women who did not give birth in the past 12 months Now married:
32.4% (3,875)Unmarried:
67.6% (8,075)
Marital status - Black or African American population 15 years and over
Males 63.0% Never married29.3% Now married0.0% Separated0.0% Widowed7.7% DivorcedFemales 53.2% Never married27.2% Now married2.7% Separated1.4% Widowed15.4% DivorcedWomen who gave birth in the past 12 months Now married:
72.1% (42)Unmarried:
27.9% (16)
Women who did not give birth in the past 12 months Now married:
19.6% (90)Unmarried:
80.4% (368)
Marital status - American Indian / Alaska Native population 15 years and over
Males 63.2% Never married23.7% Now married0.0% Separated0.0% Widowed13.1% DivorcedFemales 81.2% Never married9.3% Now married0.4% Separated1.4% Widowed7.7% DivorcedWomen who gave birth in the past 12 months Now married:
0.0% (0)Unmarried:
100.0% (30)
Women who did not give birth in the past 12 months Now married:
10.6% (34)Unmarried:
89.4% (290)
Marital status - Asian population 15 years and over
Males 59.7% Never married40.3% Now married0.0% Separated0.0% Widowed0.0% DivorcedFemales 29.3% Never married53.1% Now married1.8% Separated4.7% Widowed11.0% DivorcedWomen who gave birth in the past 12 months Now married:
100.0% (40)Unmarried:
0.0% (0)
Women who did not give birth in the past 12 months Now married:
56.1% (384)Unmarried:
43.9% (300)
Marital status - Native Hawaiian / Pacific Islander population 15 years and over
Males 42.7% Never married57.3% Now married0.0% Separated0.0% Widowed0.0% DivorcedFemales 100.0% Never married0.0% Now married0.0% Separated0.0% Widowed0.0% DivorcedWomen who did not give birth in the past 12 months Now married:
0.0% (0)Unmarried:
100.0% (46)
Marital status - Other race population 15 years and over
Males 46.4% Never married53.6% Now married0.0% Separated0.0% Widowed0.0% DivorcedFemales 59.7% Never married32.9% Now married4.7% Separated2.8% Widowed0.0% DivorcedWomen who did not give birth in the past 12 months Now married:
32.9% (188)Unmarried:
67.1% (382)
Marital status - Two or more races population 15 years and over
Males 70.3% Never married27.3% Now married2.1% Separated0.0% Widowed0.3% DivorcedFemales 53.7% Never married28.0% Now married3.1% Separated4.8% Widowed10.4% DivorcedWomen who gave birth in the past 12 months Now married:
59.2% (81)Unmarried:
40.8% (56)
Women who did not give birth in the past 12 months Now married:
23.6% (216)Unmarried:
76.4% (698)
Marital status - White alone, not Hispanic / Latino population 15 years and over
Males 50.3% Never married36.8% Now married0.5% Separated2.5% Widowed10.0% DivorcedFemales 39.7% Never married39.0% Now married1.2% Separated8.2% Widowed11.8% DivorcedWomen who gave birth in the past 12 months Now married:
83.5% (543)Unmarried:
16.5% (107)
Women who did not give birth in the past 12 months Now married:
32.5% (3,828)Unmarried:
67.5% (7,943)
Marital status - Hispanic or Latino population 15 years and over
Males 53.5% Never married41.4% Now married1.0% Separated0.0% Widowed4.0% DivorcedFemales 58.7% Never married24.5% Now married2.0% Separated5.3% Widowed9.4% DivorcedWomen who gave birth in the past 12 months Now married:
100.0% (7)Unmarried:
0.0% (0)
Women who did not give birth in the past 12 months Now married:
25.8% (253)Unmarried:
74.2% (727)
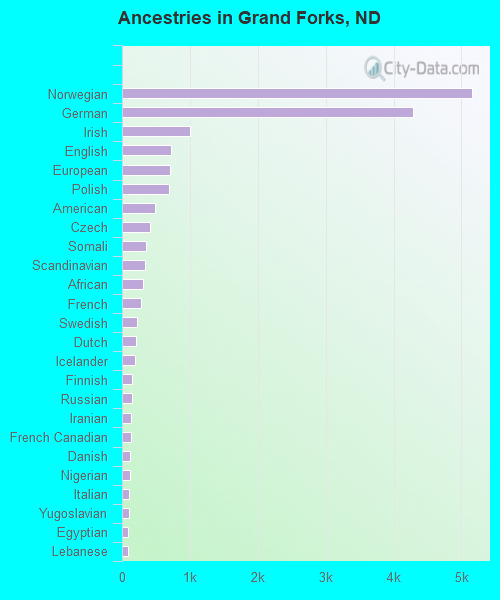
Ancestries in Grand Forks
5,149 21.8% Norwegian4,288 18.2% German1,007 4.3% Irish724 3.1% English702 3.0% European687 2.9% Polish489 2.1% American415 1.8% Czech358 1.5% Somali341 1.4% Scandinavian308 1.3% African284 1.2% French223 0.9% Swedish200 0.8% Dutch195 0.8% Icelander152 0.6% Finnish149 0.6% Russian137 0.6% Iranian134 0.6% French Canadian124 0.5% Danish112 0.5% Nigerian106 0.4% Italian100 0.4% Yugoslavian91 0.4% Egyptian87 0.4% Lebanese85 0.4% Scottish75 0.3% Arab73 0.3% Scotch-Irish69 0.3% Eastern European69 0.3% British57 0.2% British West Indian54 0.2% Jamaican43 0.2% Canadian43 0.2% Turkish42 0.2% Ukrainian41 0.2% Northern European30 0.1% Ghanaian28 0.1% Czechoslovakian26 0.1% Sudanese25 0.1% German Russian23 0.10% Palestinian18 0.08% Kenyan10 0.04% Austrian9 0.04% Swiss9 0.04% Slavic8 0.03% Portuguese8 0.03% Belgian7 0.03% Croatian7 0.03% Liberian5 0.02% Welsh4 0.02% Brazilian
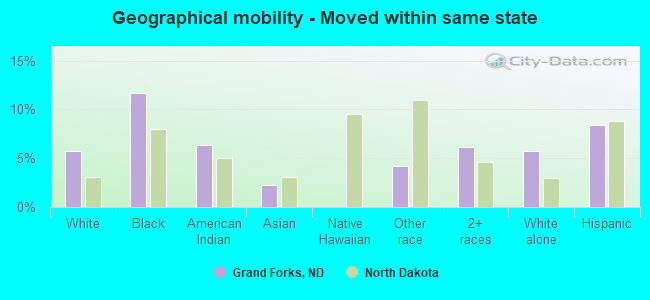
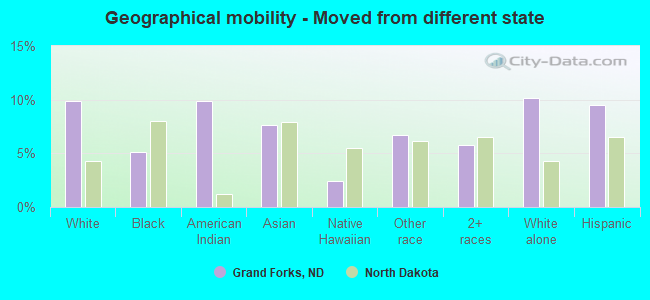
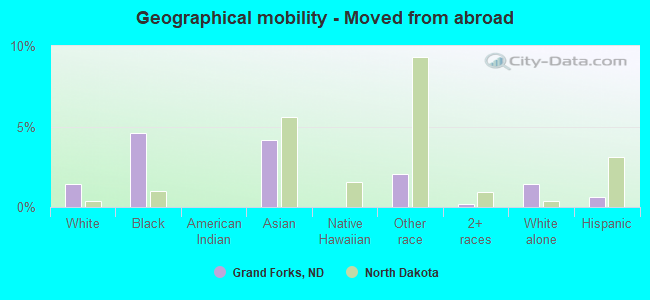
Geographical mobility in Grand Forks Same house 1 year ago 35,642 75.6% White (Caucasian)1,678 68.2% Black or African American1,011 83.2% American Indian / Alaska Native1,561 81.2% Asian337 98.6% Native Hawaiian / Pacific Islander914 58.7% Other race3,594 76.7% Two or more races34,956 75.6% White alone, not Hispanic / Latino2,111 72.1% Hispanic or LatinoMoved within same county 3,609 7.7% White / Caucasian311 12.6% Black or African American42 3.4% American Indian / Alaska Native135 7.0% Asian309 19.8% Other race469 10.0% Two or more races3,434 7.4% White alone, not Hispanic / Latino218 7.4% Hispanic or LatinoMoved within same state 2,701 5.7% White / Caucasian288 11.7% Black or African American78 6.4% American Indian / Alaska Native44 2.3% Asian66 4.2% Other race288 6.1% Two or more races2,656 5.7% White alone, not Hispanic / Latino247 8.4% Hispanic or LatinoMoved from different state 4,659 9.9% White / Caucasian125 5.1% Black or African American120 9.9% American Indian / Alaska Native147 7.6% Asian8 2.5% Native Hawaiian / Pacific Islander104 6.7% Other race269 5.7% Two or more races4,699 10.2% White alone, not Hispanic / Latino278 9.5% Hispanic or LatinoMoved from abroad 674 1.4% White113 4.6% Black or African American80 4.2% Asian32 2.1% Other race8 0.2% Two or more races674 1.5% White alone, not Hispanic / Latino19 0.6% Hispanic or Latino
Children Nativity (place of birth) in Grand Forks
Children under 6 years - Living with two parents Both parents native 2,183 100.0% NativeBoth parents foreign-born 501 88.6% Native64 11.4% Foreign-bornOne native, one foreign-born parent 122 100.0% NativeChildren under 6 years - Living with one parent Native parent 577 100.0% NativeForeign-born parent 121 100.0% NativeChildren 6 to 17 years - Living with two parents Both parents native 4,369 100.0% NativeBoth parents foreign-born 299 66.0% Native154 34.0% Foreign-bornOne native, one foreign-born parent 38 83.0% Native8 17.0% Foreign-bornChildren 6 to 17 years - Living with one parent Native parent 1,878 98.4% Native31 1.6% Foreign-bornForeign-born parent 301 68.2% Native140 31.8% Foreign-born
Grandparents responsible for own grandchildren in Grand Forks
Grandparents (30 to 59 years) White / Caucasian 32 40.0% Responsible for grandchildren48 60.0% Not responsible for grandchildrenBlack or African American 18 100.0% Not responsible for grandchildrenAsian 35 100.0% Not responsible for grandchildrenOther race 100 100.0% Responsible for grandchildrenTwo or more races 13 100.0% Responsible for grandchildrenWhite alone, not Hispanic / Latino 32 36.0% Responsible for grandchildren57 64.0% Not responsible for grandchildrenHispanic or Latino 83 100.0% Responsible for grandchildrenGrandparents (60 years and over) White / Caucasian 19 11.5% Responsible for grandchildren146 88.5% Not responsible for grandchildrenBlack or African American 9 100.0% Not responsible for grandchildrenAsian 55 100.0% Not responsible for grandchildrenWhite alone, not Hispanic / Latino 19 13.4% Responsible for grandchildren124 86.6% Not responsible for grandchildrenHispanic or Latino 17 100.0% Not responsible for grandchildren