Races in Grand Rapids, Michigan (MI) Detailed Stats
Data:
Races - White alone (%)
Races - White alone (% change since 2000)
Races - Black alone (%)
Races - Black alone (% change since 2000)
Races - American Indian alone (%)
Races - American Indian alone (% change since 2000)
Races - Asian alone (%)
Races - Asian alone (% change since 2000)
Races - Hispanic (%)
Races - Hispanic (% change since 2000)
Races - Native Hawaiian and Other Pacific Islander alone (%)
Races - Native Hawaiian and Other Pacific Islander alone (% change since 2000)
Races - Two or more races(%)
Races - Two or more races(% change since 2000)
Races - Other race alone (%)
Races - Other race alone (% change since 2000)
Racial diversity
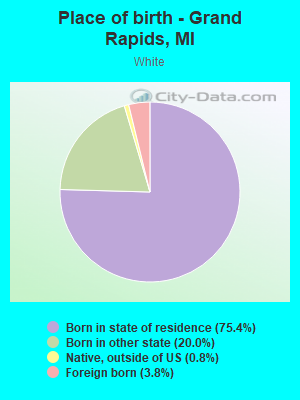
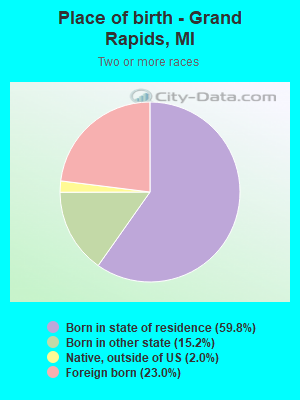
Place of birth - Born in state of residence (%)
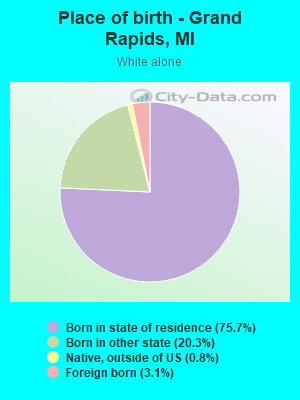
Place of birth - Born in state of residence (%) - White
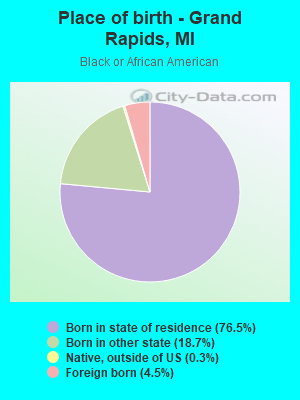
Place of birth - Born in state of residence (%) - Black or African American
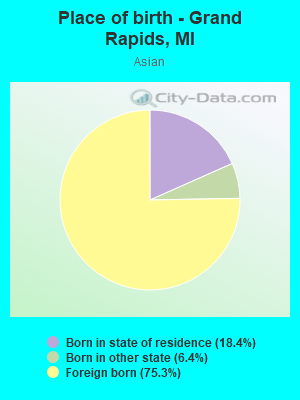
Place of birth - Born in state of residence (%) - Asian
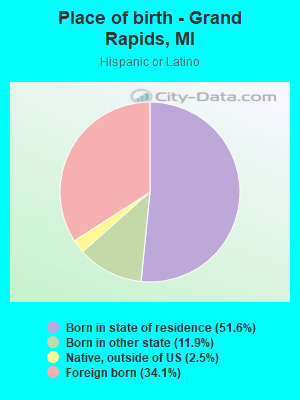
Place of birth - Born in state of residence (%) - Hispanic or Latino
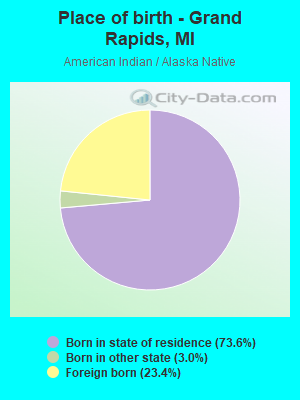
Place of birth - Born in state of residence (%) - American Indian and Alaska Native
Place of birth - Born in state of residence (%) - Multirace
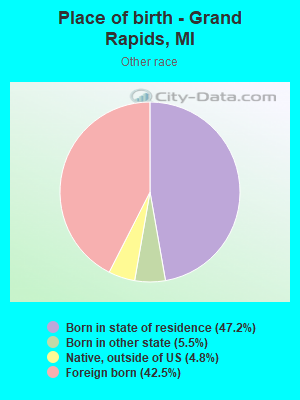
Place of birth - Born in state of residence (%) - Other Race
Place of birth - Born in other state (%)
Place of birth - Born in other state (%) - White
Place of birth - Born in other state (%) - Black or African American
Place of birth - Born in other state (%) - Asian
Place of birth - Born in other state (%) - Hispanic or Latino
Place of birth - Born in other state (%) - American Indian and Alaska Native
Place of birth - Born in other state (%) - Multirace
Place of birth - Born in other state (%) - Other Race
Place of birth - Native, outside of US (%)
Place of birth - Native, outside of US (%) - White
Place of birth - Native, outside of US (%) - Black or African American
Place of birth - Native, outside of US (%) - Asian
Place of birth - Native, outside of US (%) - Hispanic or Latino
Place of birth - Native, outside of US (%) - American Indian and Alaska Native
Place of birth - Native, outside of US (%) - Multirace
Place of birth - Native, outside of US (%) - Other Race
Place of birth - Foreign born (%)
Place of birth - Foreign born (%) - White
Place of birth - Foreign born (%) - Black or African American
Place of birth - Foreign born (%) - Asian
Place of birth - Foreign born (%) - Hispanic or Latino
Place of birth - Foreign born (%) - American Indian and Alaska Native
Place of birth - Foreign born (%) - Multirace
Place of birth - Foreign born (%) - Other Race
Residents speaking English at home (%)
Residents speaking English at home - Born in the United States (%)
Residents speaking English at home - Native, born elsewhere (%)
Residents speaking English at home - Foreign born (%)
Residents speaking Spanish at home (%)
Residents speaking Spanish at home - Born in the United States (%)
Residents speaking Spanish at home - Native, born elsewhere (%)
Residents speaking Spanish at home - Foreign born (%)
Residents speaking other language at home (%)
Residents speaking other language at home - Born in the United States (%)
Residents speaking other language at home - Native, born elsewhere (%)
Residents speaking other language at home - Foreign born (%)
Marital status - Never married (%)
Marital status - Now married (%)
Marital status - Separated (%)
Marital status - Widowed (%)
Marital status - Divorced (%)
Ancestries Reported - Arab (%)
Ancestries Reported - Czech (%)
Ancestries Reported - Danish (%)
Ancestries Reported - Dutch (%)
Ancestries Reported - English (%)
Ancestries Reported - French (%)
Ancestries Reported - French Canadian (%)
Ancestries Reported - German (%)
Ancestries Reported - Greek (%)
Ancestries Reported - Hungarian (%)
Ancestries Reported - Irish (%)
Ancestries Reported - Italian (%)
Ancestries Reported - Lithuanian (%)
Ancestries Reported - Norwegian (%)
Ancestries Reported - Polish (%)
Ancestries Reported - Portuguese (%)
Ancestries Reported - Russian (%)
Ancestries Reported - Scotch-Irish (%)
Ancestries Reported - Scottish (%)
Ancestries Reported - Slovak (%)
Ancestries Reported - Subsaharan African (%)
Ancestries Reported - Swedish (%)
Ancestries Reported - Swiss (%)
Ancestries Reported - Ukrainian (%)
Ancestries Reported - United States (%)
Ancestries Reported - Welsh (%)
Ancestries Reported - West Indian (%)
Ancestries Reported - Other (%)
Geographical mobility - Same house 1 year ago (%)
Geographical mobility - Same house 1 year ago (%) - White
Geographical mobility - Same house 1 year ago (%) - Black or African American
Geographical mobility - Same house 1 year ago (%) - Asian
Geographical mobility - Same house 1 year ago (%) - Hispanic or Latino
Geographical mobility - Same house 1 year ago (%) - American Indian and Alaska Native
Geographical mobility - Same house 1 year ago (%) - Multirace
Geographical mobility - Same house 1 year ago (%) - Other Race
Geographical mobility - Moved within same county (%)
Geographical mobility - Moved within same county (%) - White
Geographical mobility - Moved within same county (%) - Black or African American
Geographical mobility - Moved within same county (%) - Asian
Geographical mobility - Moved within same county (%) - Hispanic or Latino
Geographical mobility - Moved within same county (%) - American Indian and Alaska Native
Geographical mobility - Moved within same county (%) - Multirace
Geographical mobility - Moved within same county (%) - Other Race
Geographical mobility - Moved from different county within same state (%)
Geographical mobility - Moved from different county within same state (%) - White
Geographical mobility - Moved from different county within same state (%) - Black or African American
Geographical mobility - Moved from different county within same state (%) - Asian
Geographical mobility - Moved from different county within same state (%) - Hispanic or Latino
Geographical mobility - Moved from different county within same state (%) - American Indian and Alaska Native
Geographical mobility - Moved from different county within same state (%) - Multirace
Geographical mobility - Moved from different county within same state (%) - Other Race
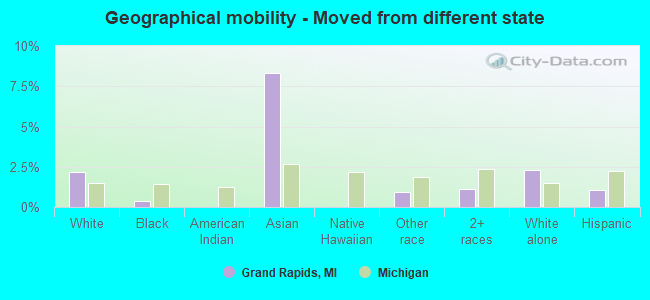
Geographical mobility - Moved from different state (%)
Geographical mobility - Moved from different state (%) - White
Geographical mobility - Moved from different state (%) - Black or African American
Geographical mobility - Moved from different state (%) - Asian
Geographical mobility - Moved from different state (%) - Hispanic or Latino
Geographical mobility - Moved from different state (%) - American Indian and Alaska Native
Geographical mobility - Moved from different state (%) - Multirace
Geographical mobility - Moved from different state (%) - Other Race
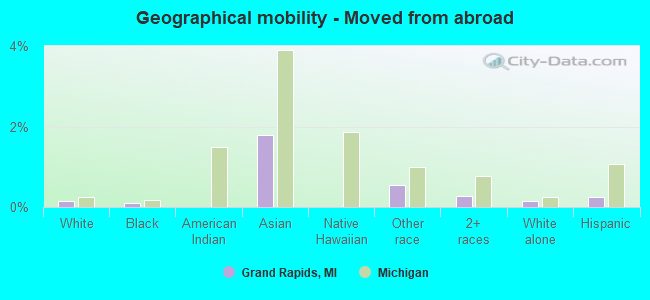
Geographical mobility - Moved from abroad (%)
Geographical mobility - Moved from abroad (%) - White
Geographical mobility - Moved from abroad (%) - Black or African American
Geographical mobility - Moved from abroad (%) - Asian
Geographical mobility - Moved from abroad (%) - Hispanic or Latino
Geographical mobility - Moved from abroad (%) - American Indian and Alaska Native
Geographical mobility - Moved from abroad (%) - Multirace
Geographical mobility - Moved from abroad (%) - Other Race
Place of birth for the foreign-born population - Ireland (%)
Place of birth for the foreign-born population - Denmark (%)
Place of birth for the foreign-born population - Norway (%)
Place of birth for the foreign-born population - Sweden (%)
Place of birth for the foreign-born population - United Kingdom (%)
Place of birth for the foreign-born population - England (%)
Place of birth for the foreign-born population - Scotland (%)
Place of birth for the foreign-born population - Other Northern Europe (%)
Place of birth for the foreign-born population - Austria (%)
Place of birth for the foreign-born population - Belgium (%)
Place of birth for the foreign-born population - France (%)
Place of birth for the foreign-born population - Germany (%)
Place of birth for the foreign-born population - Netherlands (%)
Place of birth for the foreign-born population - Switzerland (%)
Place of birth for the foreign-born population - Other Western Europe (%)
Place of birth for the foreign-born population - Greece (%)
Place of birth for the foreign-born population - Italy (%)
Place of birth for the foreign-born population - Portugal (%)
Place of birth for the foreign-born population - Spain (%)
Place of birth for the foreign-born population - Other Southern Europe (%)
Place of birth for the foreign-born population - Albania (%)
Place of birth for the foreign-born population - Belarus (%)
Place of birth for the foreign-born population - Bosnia and Herzegovina (%)
Place of birth for the foreign-born population - Bulgaria (%)
Place of birth for the foreign-born population - Croatia (%)
Place of birth for the foreign-born population - Czechoslovakia (%)
Place of birth for the foreign-born population - Hungary (%)
Place of birth for the foreign-born population - Latvia (%)
Place of birth for the foreign-born population - Lithuania (%)
Place of birth for the foreign-born population - North Macedonia (Macedonia) (%)
Place of birth for the foreign-born population - Moldova (%)
Place of birth for the foreign-born population - Poland (%)
Place of birth for the foreign-born population - Romania (%)
Place of birth for the foreign-born population - Russia (%)
Place of birth for the foreign-born population - Serbia (%)
Place of birth for the foreign-born population - Ukraine (%)
Place of birth for the foreign-born population - Other Eastern Europe (%)
Place of birth for the foreign-born population - China (%)
Place of birth for the foreign-born population - Hong Kong (%)
Place of birth for the foreign-born population - Taiwan (%)
Place of birth for the foreign-born population - Japan (%)
Place of birth for the foreign-born population - Korea (%)
Place of birth for the foreign-born population - Other Eastern Asia (%)
Place of birth for the foreign-born population - Afghanistan (%)
Place of birth for the foreign-born population - Bangladesh (%)
Place of birth for the foreign-born population - India (%)
Place of birth for the foreign-born population - Iran (%)
Place of birth for the foreign-born population - Kazakhstan (%)
Place of birth for the foreign-born population - Nepal (%)
Place of birth for the foreign-born population - Pakistan (%)
Place of birth for the foreign-born population - Sri Lanka (%)
Place of birth for the foreign-born population - Uzbekistan (%)
Place of birth for the foreign-born population - Other South Central Asia (%)
Place of birth for the foreign-born population - Burma (%)
Place of birth for the foreign-born population - Cambodia (%)
Place of birth for the foreign-born population - Indonesia (%)
Place of birth for the foreign-born population - Laos (%)
Place of birth for the foreign-born population - Malaysia (%)
Place of birth for the foreign-born population - Philippines (%)
Place of birth for the foreign-born population - Singapore (%)
Place of birth for the foreign-born population - Thailand (%)
Place of birth for the foreign-born population - Vietnam (%)
Place of birth for the foreign-born population - Other South Eastern Asia (%)
Place of birth for the foreign-born population - Armenia (%)
Place of birth for the foreign-born population - Iraq (%)
Place of birth for the foreign-born population - Israel (%)
Place of birth for the foreign-born population - Jordan (%)
Place of birth for the foreign-born population - Kuwait (%)
Place of birth for the foreign-born population - Lebanon (%)
Place of birth for the foreign-born population - Saudi Arabia (%)
Place of birth for the foreign-born population - Syria (%)
Place of birth for the foreign-born population - Turkey (%)
Place of birth for the foreign-born population - Yemen (%)
Place of birth for the foreign-born population - Other Western Asia (%)
Place of birth for the foreign-born population - Eritrea (%)
Place of birth for the foreign-born population - Ethiopia (%)
Place of birth for the foreign-born population - Kenya (%)
Place of birth for the foreign-born population - Somalia (%)
Place of birth for the foreign-born population - Uganda (%)
Place of birth for the foreign-born population - Zimbabwe (%)
Place of birth for the foreign-born population - Other Eastern Africa (%)
Place of birth for the foreign-born population - Cameroon (%)
Place of birth for the foreign-born population - Congo (%)
Place of birth for the foreign-born population - Democratic Republic of Congo (Zaire) (%)
Place of birth for the foreign-born population - Other Middle Africa (%)
Place of birth for the foreign-born population - Egypt (%)
Place of birth for the foreign-born population - Morocco (%)
Place of birth for the foreign-born population - Sudan (%)
Place of birth for the foreign-born population - Other Northern Africa (%)
Place of birth for the foreign-born population - South Africa (%)
Place of birth for the foreign-born population - Other Southern Africa (%)
Place of birth for the foreign-born population - Cabo Verde (%)
Place of birth for the foreign-born population - Ghana (%)
Place of birth for the foreign-born population - Liberia (%)
Place of birth for the foreign-born population - Nigeria (%)
Place of birth for the foreign-born population - Senegal (%)
Place of birth for the foreign-born population - Sierra Leone (%)
Place of birth for the foreign-born population - Other Western Africa (%)
Place of birth for the foreign-born population - Australia (%)
Place of birth for the foreign-born population - New Zealand (%)
Place of birth for the foreign-born population - Fiji (%)
Place of birth for the foreign-born population - Micronesia (%)
Place of birth for the foreign-born population - Bahamas (%)
Place of birth for the foreign-born population - Barbados (%)
Place of birth for the foreign-born population - Cuba (%)
Place of birth for the foreign-born population - Dominica (%)
Place of birth for the foreign-born population - Dominican Republic (%)
Place of birth for the foreign-born population - Grenada (%)
Place of birth for the foreign-born population - Haiti (%)
Place of birth for the foreign-born population - Jamaica (%)
Place of birth for the foreign-born population - St. Vincent and the Grenadines (%)
Place of birth for the foreign-born population - Trinidad and Tobago (%)
Place of birth for the foreign-born population - West Indies (%)
Place of birth for the foreign-born population - Other Caribbean (%)
Place of birth for the foreign-born population - Belize (%)
Place of birth for the foreign-born population - Costa Rica (%)
Place of birth for the foreign-born population - El Salvador (%)
Place of birth for the foreign-born population - Guatemala (%)
Place of birth for the foreign-born population - Honduras (%)
Place of birth for the foreign-born population - Mexico (%)
Place of birth for the foreign-born population - Nicaragua (%)
Place of birth for the foreign-born population - Panama (%)
Place of birth for the foreign-born population - Other Central America (%)
Place of birth for the foreign-born population - Argentina (%)
Place of birth for the foreign-born population - Bolivia (%)
Place of birth for the foreign-born population - Brazil (%)
Place of birth for the foreign-born population - Chile (%)
Place of birth for the foreign-born population - Colombia (%)
Place of birth for the foreign-born population - Ecuador (%)
Place of birth for the foreign-born population - Guyana (%)
Place of birth for the foreign-born population - Peru (%)
Place of birth for the foreign-born population - Uruguay (%)
Place of birth for the foreign-born population - Venezuela (%)
Place of birth for the foreign-born population - Other South America (%)
Place of birth for the foreign-born population - Canada (%)
Place of birth for the foreign-born population - Other Northern America (%)
Place of birth for the foreign-born population - Other (%)
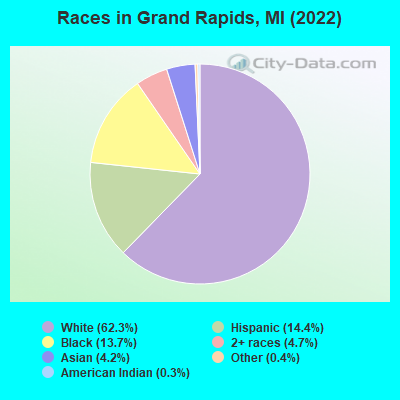
According to 2022 data, the most numerous races in Grand Rapids, MI are White alone (122,592 residents), Black alone (27,032 residents), and Hispanic (28,430 residents). 84.2% of Grand Rapids residents speak English at home. 10.5% of Grand Rapids, MI residents are foreign-born (5.3% born in Latin America, 2.4% born in Asia, 1.6% born in Africa), which is 42.9% greater than the foreign-born rate of 6.0% across the entire state of Michigan.
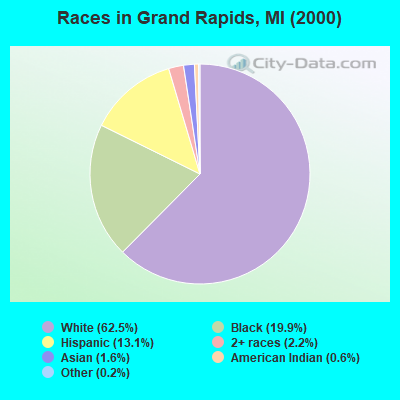
Race distribution in Grand Rapids
2000 2022
123,537 62.5% White alone 39,401 19.9% Black alone 25,818 13.1% Hispanic 4,260 2.2% Two or more races 3,147 1.6% Asian alone 1,147 0.6% American Indian alone 356 0.2% Other race alone 134 0.07% Native Hawaiian and Other
122,592 62.3% White alone 28,430 14.4% Hispanic 27,032 13.7% Black alone 9,259 4.7% Two or more races 8,259 4.2% Asian alone 814 0.4% Other race alone 518 0.3% American Indian alone
2000 2022
7,806,691 78.6% White alone 1,402,047 14.1% Black alone 323,877 3.3% Hispanic 175,311 1.8% Asian alone 163,487 1.6% Two or more races 53,421 0.5% American Indian alone 11,465 0.1% Other race alone 2,145 0.02% Native Hawaiian and Other
7,289,051 72.6% White alone 1,310,464 13.1% Black alone 572,405 5.7% Hispanic 450,031 4.5% Two or more races 335,732 3.3% Asian alone 45,217 0.5% Other race alone 29,011 0.3% American Indian alone 2,207 0.02% Native Hawaiian and Other
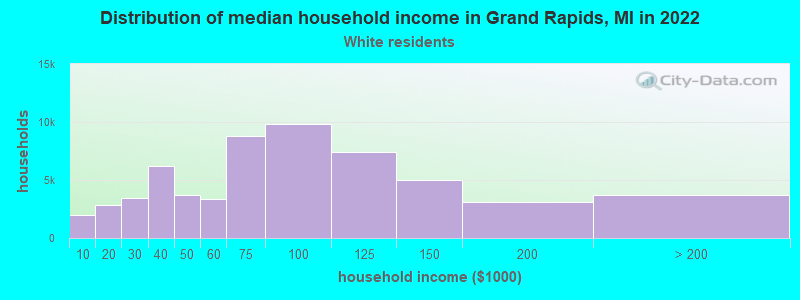
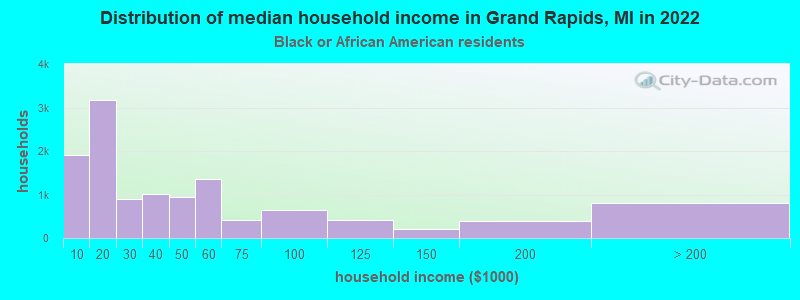
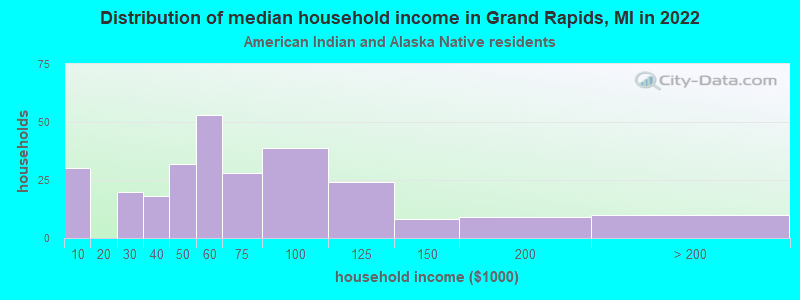
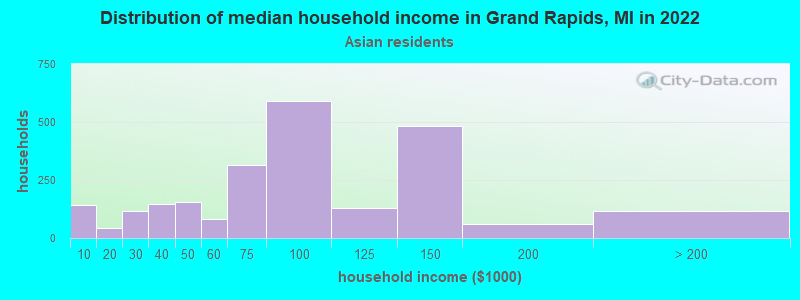
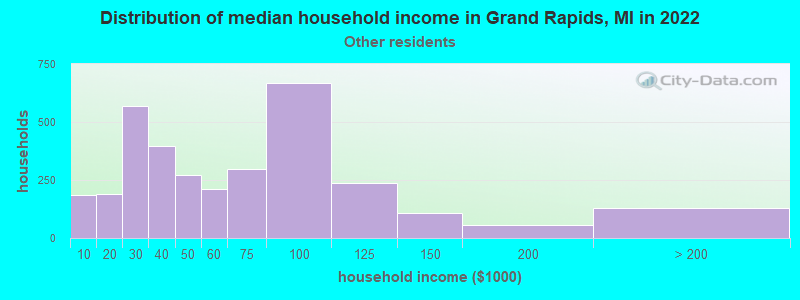
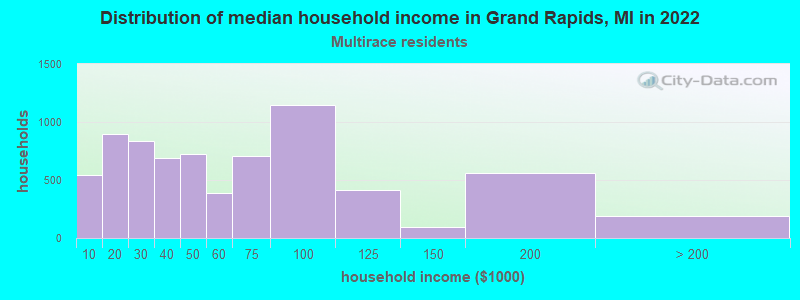
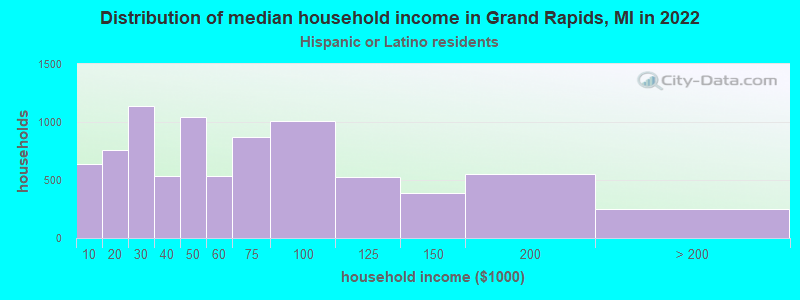
Income and house value in Grand Rapids Median household income in 2022 $74,699 White non-Hispanic householders$31,830 Black householders$92,321 American Indian and Alaska Native householders$80,681 Asian householders$53,059 Some other race householders$47,026 Two or more races householders$50,389 Hispanic or Latino race householdersMedian 2022 house value $250,434 White Non-Hispanic householders$187,760 Black or African American householders$180,971 American Indian or Alaska Native householders $276,026 Asian householdersover $1,000,000 Native Hawaiian and other Pacific Islander householders$158,251 Some other race householders$217,792 Two or more races householders$159,035 Hispanic or Latino householders
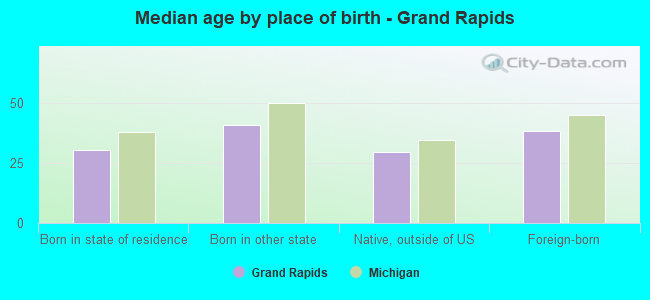
Median age by race in Grand Rapids
35.2 Median age for White residents35.4 35.1 30.9 Median age for Black or African American residents31.0 30.7 39.0 Median age for American Indian / Alaska Native residents38.4 55.5 35.3 Median age for Asian residents37.1 35.2 -666,666,666.0 Median age for Native Hawaiian / Pacific Islander residents-666,666,666.0 -666,666,666.0 31.1 Median age for Other race residents31.7 30.6 22.5 Median age for Two or more races residents21.1 23.8 35.7 Median age for White alone residents36.2 35.4 24.8 Median age for Hispanic or Latino residents25.2 23.4
Owner/renter occupied households by race in Grand Rapids
House owners and renters - White residents 34,600 58.2% Owner occupied24,826 41.8% Renter occupiedHouse owners and renters - Black or African American residents 4,520 37.0% Owner occupied7,680 63.0% Renter occupiedHouse owners and renters - American Indian / Alaska Native residents 158 46.6% Owner occupied181 53.4% Renter occupiedHouse owners and renters - Asian residents 1,054 31.3% Owner occupied2,315 68.7% Renter occupiedHouse owners and renters - Native Hawaiian / Pacific Islander residents 12 100.0% Renter occupiedHouse owners and renters - Other race residents 1,193 66.6% Owner occupied599 33.4% Renter occupiedHouse owners and renters - Two or more races residents 3,237 45.0% Owner occupied3,961 55.0% Renter occupiedHouse owners and renters - White alone residents 33,930 58.8% Owner occupied23,818 41.2% Renter occupiedHouse owners and renters - Hispanic or Latino residents 3,559 43.2% Owner occupied4,682 56.8% Renter occupied
Language usage in Grand Rapids
English speakers - Total 84.2% of residents of Grand Rapids speak English at home.
9.4% of residents speak Spanish at home 8,439 48.8% Speak English very well8,852 51.2% Speak English less than very well6.4% of residents speak other language at home 4,845 40.9% Speak English very well6,998 59.1% Speak English less than very well
English speakers - Born in the United States 92.8% of residents of Grand Rapids speak English at home.
5.8% of residents speak Spanish at home 1,840 90.2% Speak English very well200 9.8% Speak English less than very well1.5% of residents speak other language at home 284 55.5% Speak English very well228 44.5% Speak English less than very well
English speakers - Native, born elsewhere 76.7% of residents of Grand Rapids speak English at home.
23.3% of residents speak Spanish at home 229 51.1% Speak English very well219 48.9% Speak English less than very well
English speakers - Foreign-born 17.3% of residents of Grand Rapids speak English at home.
40.2% of residents speak Spanish at home 2,432 28.5% Speak English very well6,116 71.5% Speak English less than very well42.5% of residents speak other language at home 3,034 33.6% Speak English very well6,006 66.4% Speak English less than very well
White (Caucasian) - Speak only English Native:
97.2% (113,877)Foreign-born:
20.1% (977)
White (Caucasian) - Speak another language Native:
2.8% (3,289)Foreign-born:
79.9% (3,884)
Black or African American - Speak only English Native:
94.5% (28,170)Foreign-born:
14.0% (406)
Black or African American - Speak another language Native:
4.9% (1,464)Foreign-born:
86.5% (2,509)
American Indian / Alaska Native - Speak only English Native:
79.3% (499)Foreign-born:
21.3% (67)
American Indian / Alaska Native - Speak another language Native:
21.6% (136)Foreign-born:
79.0% (251)
Asian - Speak only English Native:
50.3% (737)Foreign-born:
16.8% (1,043)
Asian - Speak another language Native:
49.7% (729)Foreign-born:
83.2% (5,175)
Native Hawaiian / Pacific Islander - Speak only English Native:
99.5% (56)Foreign-born:
96.3% (13)
Other race - Speak only English Native:
35.4% (974)Foreign-born:
10.9% (280)
Other race - Speak another language Native:
64.6% (1,778)Foreign-born:
89.1% (2,296)
Two or more races - Speak only English Native:
72.2% (12,559)Foreign-born:
13.0% (767)
Two or more races - Speak another language Native:
27.8% (4,833)Foreign-born:
87.0% (5,125)
White alone - Speak only English Native:
97.8% (110,869)Foreign-born:
23.3% (898)
White alone - Speak another language Native:
2.2% (2,451)Foreign-born:
76.7% (2,956)
Hispanic or Latino - Speak only English Native:
54.5% (8,591)Foreign-born:
10.3% (994)
Hispanic or Latino - Speak another language Native:
45.5% (7,168)Foreign-born:
89.7% (8,618)
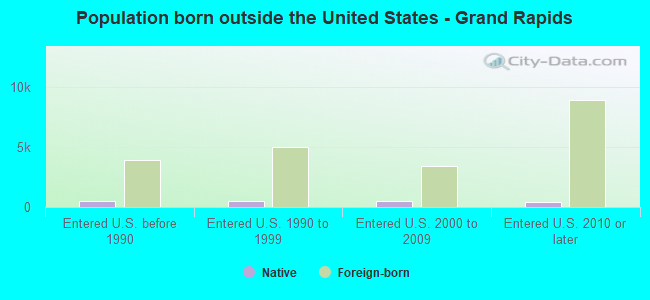
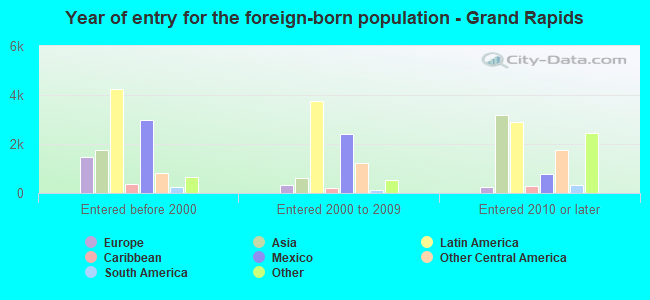
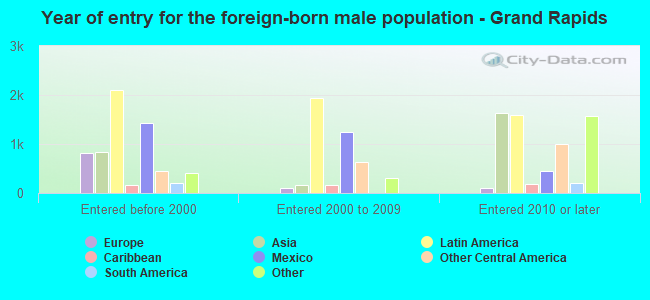
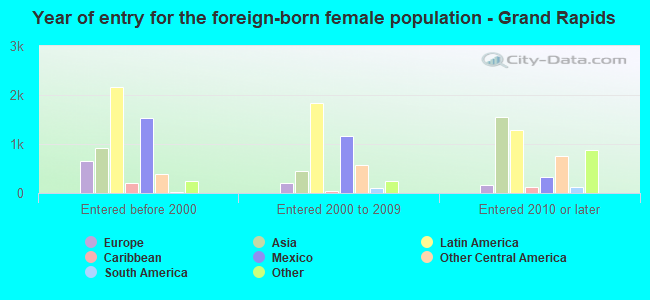
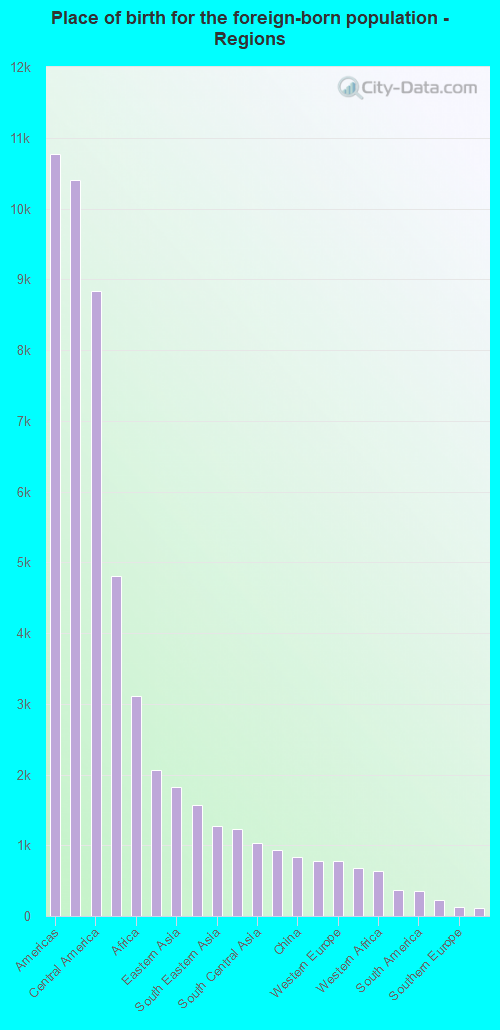
Foreign-born residents in Grand Rapids 20,864 residents are foreign born (5.3% Latin America , 2.4% Asia , 1.6% Africa ).
This city:
10.5%Michigan:
6.9%
Marital status for residents in Grand Rapids Marital status - White (Caucasian) population 15 years and over
Males 45.7% Never married39.9% Now married1.2% Separated2.8% Widowed10.3% DivorcedFemales 43.1% Never married35.6% Now married0.7% Separated7.3% Widowed13.2% DivorcedWomen who gave birth in the past 12 months Now married:
90.5% (847)Unmarried:
9.5% (89)
Women who did not give birth in the past 12 months Now married:
30.2% (10,651)Unmarried:
69.8% (24,629)
Marital status - Black or African American population 15 years and over
Males 62.0% Never married22.3% Now married3.8% Separated4.6% Widowed7.3% DivorcedFemales 57.6% Never married15.9% Now married3.0% Separated4.4% Widowed19.2% DivorcedWomen who gave birth in the past 12 months Now married:
26.6% (145)Unmarried:
73.4% (400)
Women who did not give birth in the past 12 months Now married:
19.0% (1,240)Unmarried:
81.0% (5,282)
Marital status - American Indian / Alaska Native population 15 years and over
Males 51.3% Never married19.5% Now married18.9% Separated3.2% Widowed7.1% DivorcedFemales 48.5% Never married14.4% Now married5.0% Separated1.3% Widowed30.8% DivorcedWomen who gave birth in the past 12 months Now married:
0.0% (0)Unmarried:
100.0% (12)
Women who did not give birth in the past 12 months Now married:
21.3% (39)Unmarried:
78.7% (145)
Marital status - Asian population 15 years and over
Males 41.6% Never married53.5% Now married2.2% Separated0.0% Widowed2.7% DivorcedFemales 34.1% Never married55.2% Now married0.6% Separated2.1% Widowed8.1% DivorcedWomen who gave birth in the past 12 months Now married:
100.0% (237)Unmarried:
0.0% (0)
Women who did not give birth in the past 12 months Now married:
48.2% (1,211)Unmarried:
51.8% (1,300)
Marital status - Native Hawaiian / Pacific Islander population 15 years and over
Males 100.0% Never married0.0% Now married0.0% Separated0.0% Widowed0.0% DivorcedFemales 100.0% Never married0.0% Now married0.0% Separated0.0% Widowed0.0% DivorcedWomen who did not give birth in the past 12 months Now married:
0.0% (0)Unmarried:
100.0% (26)
Marital status - Other race population 15 years and over
Males 57.3% Never married37.8% Now married0.0% Separated0.4% Widowed4.6% DivorcedFemales 43.2% Never married40.7% Now married5.0% Separated5.6% Widowed5.4% DivorcedWomen who gave birth in the past 12 months Now married:
86.7% (120)Unmarried:
13.3% (18)
Women who did not give birth in the past 12 months Now married:
37.6% (725)Unmarried:
62.4% (1,201)
Marital status - Two or more races population 15 years and over
Males 63.0% Never married24.6% Now married2.2% Separated2.8% Widowed7.4% DivorcedFemales 57.0% Never married27.2% Now married2.8% Separated4.4% Widowed8.6% DivorcedWomen who gave birth in the past 12 months Now married:
55.8% (159)Unmarried:
44.2% (126)
Women who did not give birth in the past 12 months Now married:
23.5% (1,768)Unmarried:
76.5% (5,766)
Marital status - White alone, not Hispanic / Latino population 15 years and over
Males 44.3% Never married40.7% Now married1.3% Separated3.0% Widowed10.7% DivorcedFemales 42.7% Never married35.6% Now married0.7% Separated7.4% Widowed13.6% DivorcedWomen who gave birth in the past 12 months Now married:
90.5% (847)Unmarried:
9.5% (89)
Women who did not give birth in the past 12 months Now married:
30.6% (10,451)Unmarried:
69.4% (23,685)
Marital status - Hispanic or Latino population 15 years and over
Males 62.3% Never married24.5% Now married4.7% Separated2.1% Widowed6.4% DivorcedFemales 52.2% Never married34.0% Now married4.0% Separated4.8% Widowed5.0% DivorcedWomen who gave birth in the past 12 months Now married:
47.5% (206)Unmarried:
52.5% (228)
Women who did not give birth in the past 12 months Now married:
31.6% (2,396)Unmarried:
68.4% (5,183)
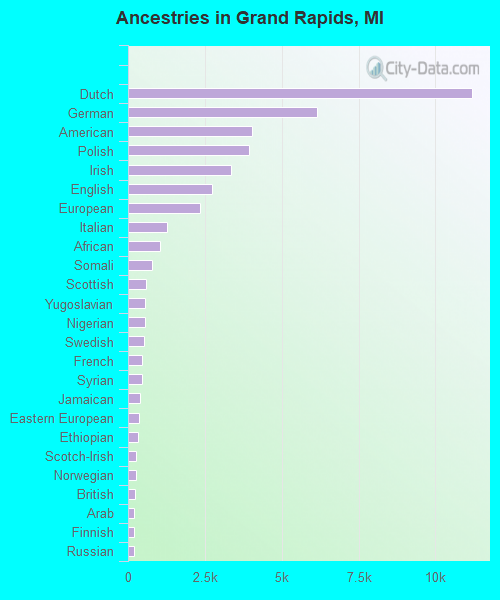
Ancestries in Grand Rapids
11,181 12.0% Dutch6,141 6.6% German4,044 4.3% American3,928 4.2% Polish3,341 3.6% Irish2,730 2.9% English2,342 2.5% European1,267 1.4% Italian1,056 1.1% African789 0.8% Somali572 0.6% Scottish562 0.6% Yugoslavian540 0.6% Nigerian516 0.6% Swedish461 0.5% French449 0.5% Syrian395 0.4% Jamaican347 0.4% Eastern European319 0.3% Ethiopian275 0.3% Scotch-Irish271 0.3% Norwegian222 0.2% British205 0.2% Arab186 0.2% Finnish183 0.2% Russian176 0.2% Liberian176 0.2% Danish174 0.2% Hungarian161 0.2% Greek148 0.2% French Canadian143 0.2% Lithuanian143 0.2% Haitian140 0.1% Northern European127 0.1% Ukrainian126 0.1% Latvian123 0.1% Canadian121 0.1% Portuguese118 0.1% Iraqi107 0.1% Czech99 0.1% Zimbabwean87 0.09% Lebanese73 0.08% Scandinavian71 0.08% Welsh66 0.07% Sudanese54 0.06% Albanian48 0.05% Ghanaian48 0.05% Swiss46 0.05% Romanian45 0.05% Iranian45 0.05% Serbian40 0.04% Czechoslovakian33 0.04% Palestinian25 0.03% Armenian21 0.02% Israeli20 0.02% Maltese20 0.02% Slovak18 0.02% Austrian13 0.01% Turkish11 0.01% Kenyan10 0.01% Belgian9 0.01% Pennsylvania German9 0.01% Moroccan8 0.01% Trinidadian and Tobagonian6 0.01% Brazilian5 0.01% South African5 0.01% Slovene
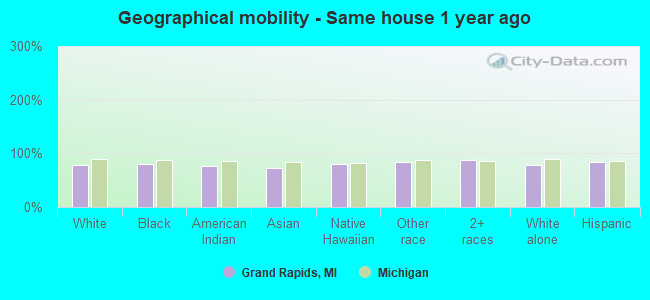
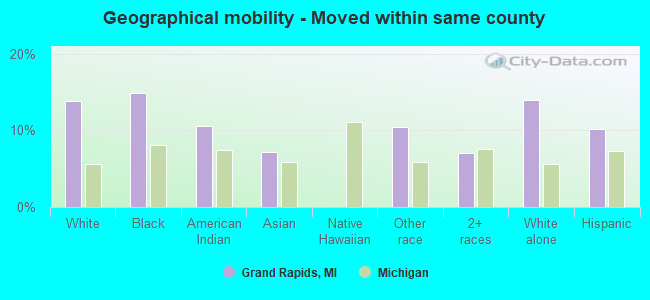
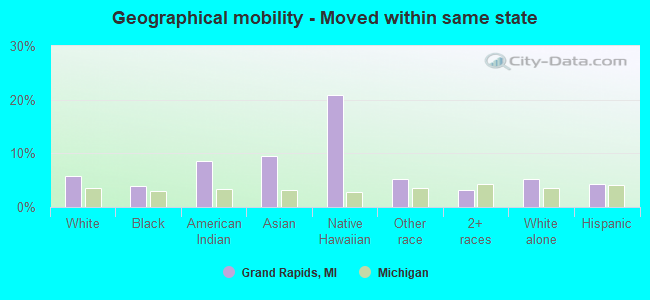
Geographical mobility in Grand Rapids Same house 1 year ago 99,253 78.2% White (Caucasian)22,048 80.8% Black or African American754 76.7% American Indian / Alaska Native5,934 73.2% Asian56 80.9% Native Hawaiian / Pacific Islander5,911 83.9% Other race22,595 88.3% Two or more races95,426 78.4% White alone, not Hispanic / Latino23,577 84.2% Hispanic or LatinoMoved within same county 17,507 13.8% White / Caucasian4,050 14.8% Black or African American104 10.6% American Indian / Alaska Native580 7.2% Asian736 10.4% Other race1,810 7.1% Two or more races16,952 13.9% White alone, not Hispanic / Latino2,857 10.2% Hispanic or LatinoMoved within same state 7,240 5.7% White / Caucasian1,075 3.9% Black or African American84 8.6% American Indian / Alaska Native773 9.5% Asian14 21.0% Native Hawaiian / Pacific Islander371 5.3% Other race816 3.2% Two or more races6,425 5.3% White alone, not Hispanic / Latino1,221 4.4% Hispanic or LatinoMoved from different state 2,762 2.2% White / Caucasian99 0.4% Black or African American677 8.3% Asian64 0.9% Other race288 1.1% Two or more races2,762 2.3% White alone, not Hispanic / Latino288 1.0% Hispanic or LatinoMoved from abroad 187 0.1% White29 0.1% Black or African American146 1.8% Asian39 0.6% Other race70 0.3% Two or more races187 0.2% White alone, not Hispanic / Latino70 0.2% Hispanic or Latino
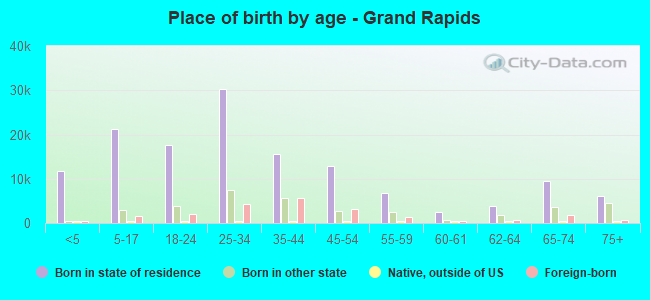
Children Nativity (place of birth) in Grand Rapids
Children under 6 years - Living with two parents Both parents native 5,424 100.0% NativeBoth parents foreign-born 720 100.0% NativeOne native, one foreign-born parent 830 100.0% NativeChildren under 6 years - Living with one parent Native parent 5,807 100.0% NativeForeign-born parent 778 90.7% Native80 9.3% Foreign-bornChildren 6 to 17 years - Living with two parents Both parents native 8,243 99.3% Native57 0.7% Foreign-bornBoth parents foreign-born 1,895 68.5% Native870 31.5% Foreign-bornOne native, one foreign-born parent 2,008 100.0% NativeChildren 6 to 17 years - Living with one parent Native parent 7,111 100.0% NativeForeign-born parent 2,025 51.6% Native1,898 48.4% Foreign-born
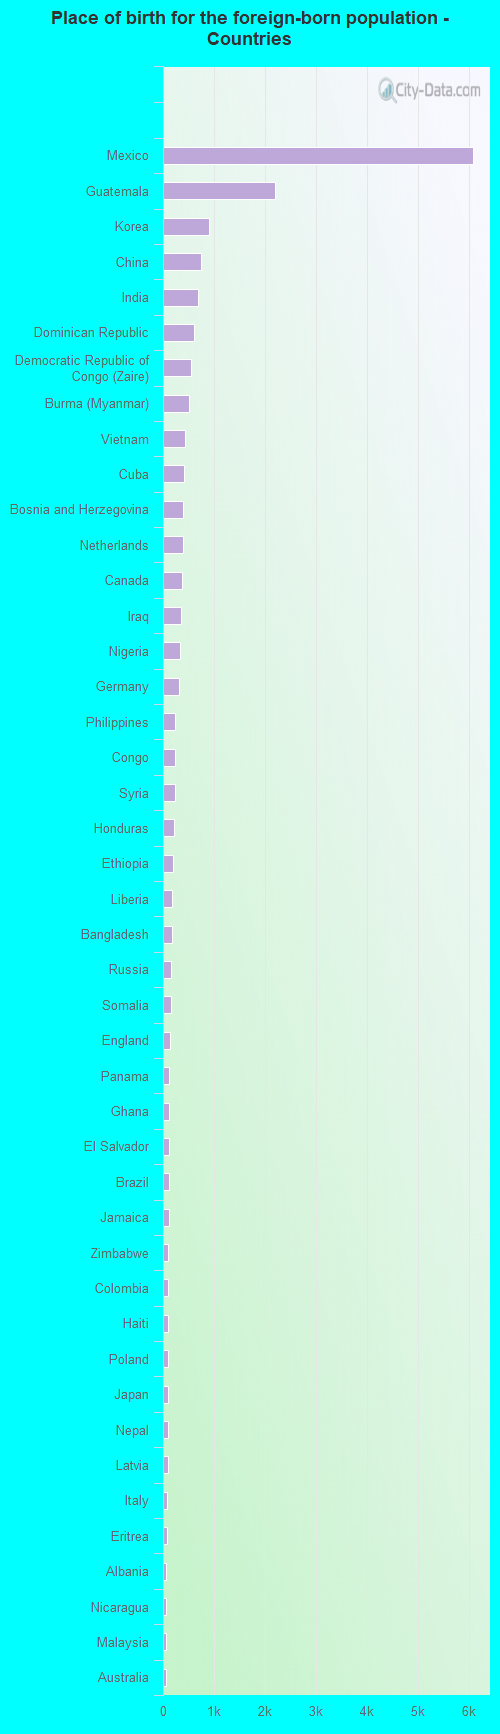
Place of birth for residents in Grand Rapids 10,776 Americas10,407 Latin America8,829 Central America4,802 Asia3,114 Africa2,061 Europe1,826 Eastern Asia1,571 Eastern Africa1,269 South Eastern Asia1,228 Caribbean1,028 South Central Asia931 Eastern Europe836 China775 Middle Africa772 Western Europe677 Western Asia636 Western Africa369 Northern America349 South America231 Northern Europe126 Southern Europe110 Oceania71 Northern Africa56 Australia and New Zealand Subregion25 Southern Africa6,095 Mexico2,206 Guatemala897 Korea747 China678 India611 Dominican Republic540 Democratic Republic of Congo (Zaire)504 Burma (Myanmar)430 Vietnam407 Cuba401 Bosnia and Herzegovina386 Netherlands369 Canada352 Iraq328 Nigeria315 Germany239 Philippines235 Congo235 Syria218 Honduras191 Ethiopia183 Liberia179 Bangladesh158 Russia152 Somalia129 England126 Panama125 Ghana124 El Salvador116 Brazil111 Jamaica101 Zimbabwe100 Colombia99 Haiti95 Poland93 Japan93 Nepal92 Latvia73 Italy70 Eritrea67 Albania60 Nicaragua57 Malaysia56 Australia55 France52 Hong Kong50 United Kingdom50 Sudan49 Chile47 Peru38 Jordan37 Taiwan34 Kazakhstan31 Scotland31 Ukraine30 Romania27 Israel25 South Africa24 Greece24 Venezuela21 Serbia20 Indonesia19 Iran17 Denmark16 Switzerland16 Thailand13 Egypt13 Belarus13 Spain13 Pakistan12 Azerbaijan12 Bhutan12 Bulgaria11 Kenya8 Morocco7 Ecuador6 Argentina6 Czechoslovakia5 Lebanon5 Croatia4 Ireland3 Cambodia
Grandparents responsible for own grandchildren in Grand Rapids
Grandparents (30 to 59 years) White / Caucasian 206 37.9% Responsible for grandchildren337 62.1% Not responsible for grandchildrenBlack or African American 96 29.4% Responsible for grandchildren231 70.6% Not responsible for grandchildrenOther race 70 26.5% Responsible for grandchildren195 73.5% Not responsible for grandchildrenTwo or more races 50 12.9% Responsible for grandchildren341 87.1% Not responsible for grandchildrenWhite alone, not Hispanic / Latino 144 36.8% Responsible for grandchildren247 63.2% Not responsible for grandchildrenHispanic or Latino 114 19.7% Responsible for grandchildren464 80.3% Not responsible for grandchildrenGrandparents (60 years and over) White / Caucasian 140 16.2% Responsible for grandchildren725 83.8% Not responsible for grandchildrenBlack or African American 348 55.2% Responsible for grandchildren283 44.8% Not responsible for grandchildrenOther race 48 36.2% Responsible for grandchildren85 63.8% Not responsible for grandchildrenTwo or more races 1 1.3% Responsible for grandchildren100 98.7% Not responsible for grandchildrenWhite alone, not Hispanic / Latino 140 17.3% Responsible for grandchildren668 82.7% Not responsible for grandchildrenHispanic or Latino 19 9.5% Responsible for grandchildren181 90.5% Not responsible for grandchildren