Races in Grandview, Missouri (MO) Detailed Stats
Data:
Races - White alone (%)
Races - White alone (% change since 2000)
Races - Black alone (%)
Races - Black alone (% change since 2000)
Races - American Indian alone (%)
Races - American Indian alone (% change since 2000)
Races - Asian alone (%)
Races - Asian alone (% change since 2000)
Races - Hispanic (%)
Races - Hispanic (% change since 2000)
Races - Native Hawaiian and Other Pacific Islander alone (%)
Races - Native Hawaiian and Other Pacific Islander alone (% change since 2000)
Races - Two or more races(%)
Races - Two or more races(% change since 2000)
Races - Other race alone (%)
Races - Other race alone (% change since 2000)
Racial diversity
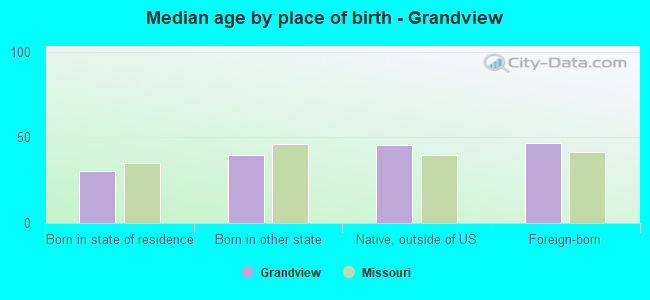
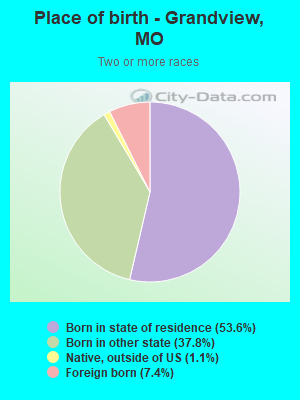
Place of birth - Born in state of residence (%)
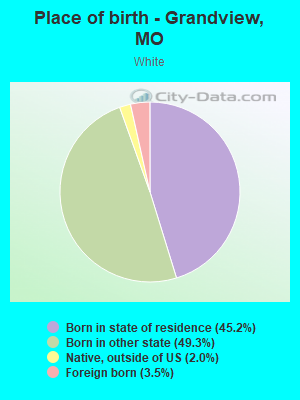
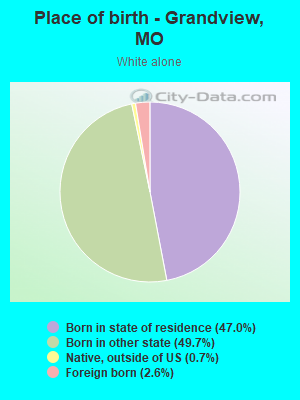
Place of birth - Born in state of residence (%) - White
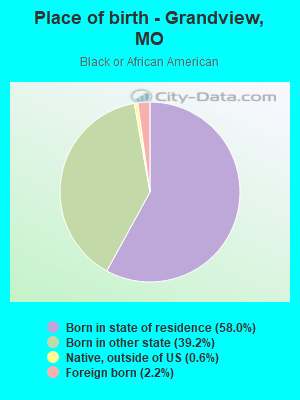
Place of birth - Born in state of residence (%) - Black or African American
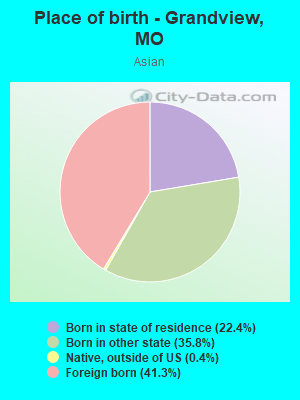
Place of birth - Born in state of residence (%) - Asian
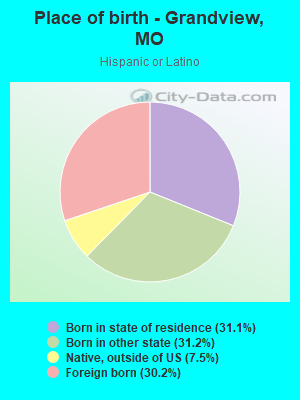
Place of birth - Born in state of residence (%) - Hispanic or Latino
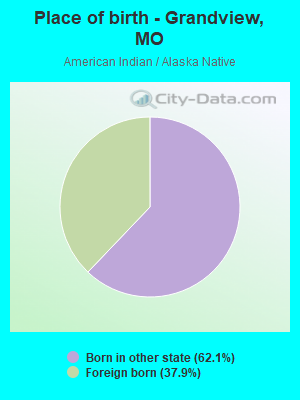
Place of birth - Born in state of residence (%) - American Indian and Alaska Native
Place of birth - Born in state of residence (%) - Multirace
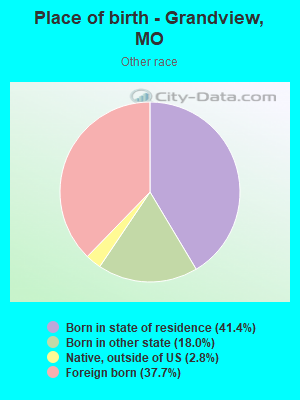
Place of birth - Born in state of residence (%) - Other Race
Place of birth - Born in other state (%)
Place of birth - Born in other state (%) - White
Place of birth - Born in other state (%) - Black or African American
Place of birth - Born in other state (%) - Asian
Place of birth - Born in other state (%) - Hispanic or Latino
Place of birth - Born in other state (%) - American Indian and Alaska Native
Place of birth - Born in other state (%) - Multirace
Place of birth - Born in other state (%) - Other Race
Place of birth - Native, outside of US (%)
Place of birth - Native, outside of US (%) - White
Place of birth - Native, outside of US (%) - Black or African American
Place of birth - Native, outside of US (%) - Asian
Place of birth - Native, outside of US (%) - Hispanic or Latino
Place of birth - Native, outside of US (%) - American Indian and Alaska Native
Place of birth - Native, outside of US (%) - Multirace
Place of birth - Native, outside of US (%) - Other Race
Place of birth - Foreign born (%)
Place of birth - Foreign born (%) - White
Place of birth - Foreign born (%) - Black or African American
Place of birth - Foreign born (%) - Asian
Place of birth - Foreign born (%) - Hispanic or Latino
Place of birth - Foreign born (%) - American Indian and Alaska Native
Place of birth - Foreign born (%) - Multirace
Place of birth - Foreign born (%) - Other Race
Residents speaking English at home (%)
Residents speaking English at home - Born in the United States (%)
Residents speaking English at home - Native, born elsewhere (%)
Residents speaking English at home - Foreign born (%)
Residents speaking Spanish at home (%)
Residents speaking Spanish at home - Born in the United States (%)
Residents speaking Spanish at home - Native, born elsewhere (%)
Residents speaking Spanish at home - Foreign born (%)
Residents speaking other language at home (%)
Residents speaking other language at home - Born in the United States (%)
Residents speaking other language at home - Native, born elsewhere (%)
Residents speaking other language at home - Foreign born (%)
Marital status - Never married (%)
Marital status - Now married (%)
Marital status - Separated (%)
Marital status - Widowed (%)
Marital status - Divorced (%)
Ancestries Reported - Arab (%)
Ancestries Reported - Czech (%)
Ancestries Reported - Danish (%)
Ancestries Reported - Dutch (%)
Ancestries Reported - English (%)
Ancestries Reported - French (%)
Ancestries Reported - French Canadian (%)
Ancestries Reported - German (%)
Ancestries Reported - Greek (%)
Ancestries Reported - Hungarian (%)
Ancestries Reported - Irish (%)
Ancestries Reported - Italian (%)
Ancestries Reported - Lithuanian (%)
Ancestries Reported - Norwegian (%)
Ancestries Reported - Polish (%)
Ancestries Reported - Portuguese (%)
Ancestries Reported - Russian (%)
Ancestries Reported - Scotch-Irish (%)
Ancestries Reported - Scottish (%)
Ancestries Reported - Slovak (%)
Ancestries Reported - Subsaharan African (%)
Ancestries Reported - Swedish (%)
Ancestries Reported - Swiss (%)
Ancestries Reported - Ukrainian (%)
Ancestries Reported - United States (%)
Ancestries Reported - Welsh (%)
Ancestries Reported - West Indian (%)
Ancestries Reported - Other (%)
Geographical mobility - Same house 1 year ago (%)
Geographical mobility - Same house 1 year ago (%) - White
Geographical mobility - Same house 1 year ago (%) - Black or African American
Geographical mobility - Same house 1 year ago (%) - Asian
Geographical mobility - Same house 1 year ago (%) - Hispanic or Latino
Geographical mobility - Same house 1 year ago (%) - American Indian and Alaska Native
Geographical mobility - Same house 1 year ago (%) - Multirace
Geographical mobility - Same house 1 year ago (%) - Other Race
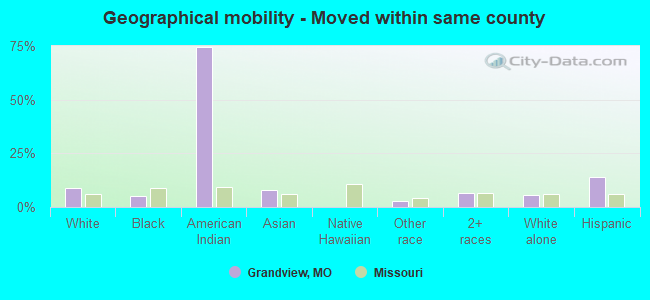
Geographical mobility - Moved within same county (%)
Geographical mobility - Moved within same county (%) - White
Geographical mobility - Moved within same county (%) - Black or African American
Geographical mobility - Moved within same county (%) - Asian
Geographical mobility - Moved within same county (%) - Hispanic or Latino
Geographical mobility - Moved within same county (%) - American Indian and Alaska Native
Geographical mobility - Moved within same county (%) - Multirace
Geographical mobility - Moved within same county (%) - Other Race
Geographical mobility - Moved from different county within same state (%)
Geographical mobility - Moved from different county within same state (%) - White
Geographical mobility - Moved from different county within same state (%) - Black or African American
Geographical mobility - Moved from different county within same state (%) - Asian
Geographical mobility - Moved from different county within same state (%) - Hispanic or Latino
Geographical mobility - Moved from different county within same state (%) - American Indian and Alaska Native
Geographical mobility - Moved from different county within same state (%) - Multirace
Geographical mobility - Moved from different county within same state (%) - Other Race
Geographical mobility - Moved from different state (%)
Geographical mobility - Moved from different state (%) - White
Geographical mobility - Moved from different state (%) - Black or African American
Geographical mobility - Moved from different state (%) - Asian
Geographical mobility - Moved from different state (%) - Hispanic or Latino
Geographical mobility - Moved from different state (%) - American Indian and Alaska Native
Geographical mobility - Moved from different state (%) - Multirace
Geographical mobility - Moved from different state (%) - Other Race
Geographical mobility - Moved from abroad (%)
Geographical mobility - Moved from abroad (%) - White
Geographical mobility - Moved from abroad (%) - Black or African American
Geographical mobility - Moved from abroad (%) - Asian
Geographical mobility - Moved from abroad (%) - Hispanic or Latino
Geographical mobility - Moved from abroad (%) - American Indian and Alaska Native
Geographical mobility - Moved from abroad (%) - Multirace
Geographical mobility - Moved from abroad (%) - Other Race
Place of birth for the foreign-born population - Ireland (%)
Place of birth for the foreign-born population - Denmark (%)
Place of birth for the foreign-born population - Norway (%)
Place of birth for the foreign-born population - Sweden (%)
Place of birth for the foreign-born population - United Kingdom (%)
Place of birth for the foreign-born population - England (%)
Place of birth for the foreign-born population - Scotland (%)
Place of birth for the foreign-born population - Other Northern Europe (%)
Place of birth for the foreign-born population - Austria (%)
Place of birth for the foreign-born population - Belgium (%)
Place of birth for the foreign-born population - France (%)
Place of birth for the foreign-born population - Germany (%)
Place of birth for the foreign-born population - Netherlands (%)
Place of birth for the foreign-born population - Switzerland (%)
Place of birth for the foreign-born population - Other Western Europe (%)
Place of birth for the foreign-born population - Greece (%)
Place of birth for the foreign-born population - Italy (%)
Place of birth for the foreign-born population - Portugal (%)
Place of birth for the foreign-born population - Spain (%)
Place of birth for the foreign-born population - Other Southern Europe (%)
Place of birth for the foreign-born population - Albania (%)
Place of birth for the foreign-born population - Belarus (%)
Place of birth for the foreign-born population - Bosnia and Herzegovina (%)
Place of birth for the foreign-born population - Bulgaria (%)
Place of birth for the foreign-born population - Croatia (%)
Place of birth for the foreign-born population - Czechoslovakia (%)
Place of birth for the foreign-born population - Hungary (%)
Place of birth for the foreign-born population - Latvia (%)
Place of birth for the foreign-born population - Lithuania (%)
Place of birth for the foreign-born population - North Macedonia (Macedonia) (%)
Place of birth for the foreign-born population - Moldova (%)
Place of birth for the foreign-born population - Poland (%)
Place of birth for the foreign-born population - Romania (%)
Place of birth for the foreign-born population - Russia (%)
Place of birth for the foreign-born population - Serbia (%)
Place of birth for the foreign-born population - Ukraine (%)
Place of birth for the foreign-born population - Other Eastern Europe (%)
Place of birth for the foreign-born population - China (%)
Place of birth for the foreign-born population - Hong Kong (%)
Place of birth for the foreign-born population - Taiwan (%)
Place of birth for the foreign-born population - Japan (%)
Place of birth for the foreign-born population - Korea (%)
Place of birth for the foreign-born population - Other Eastern Asia (%)
Place of birth for the foreign-born population - Afghanistan (%)
Place of birth for the foreign-born population - Bangladesh (%)
Place of birth for the foreign-born population - India (%)
Place of birth for the foreign-born population - Iran (%)
Place of birth for the foreign-born population - Kazakhstan (%)
Place of birth for the foreign-born population - Nepal (%)
Place of birth for the foreign-born population - Pakistan (%)
Place of birth for the foreign-born population - Sri Lanka (%)
Place of birth for the foreign-born population - Uzbekistan (%)
Place of birth for the foreign-born population - Other South Central Asia (%)
Place of birth for the foreign-born population - Burma (%)
Place of birth for the foreign-born population - Cambodia (%)
Place of birth for the foreign-born population - Indonesia (%)
Place of birth for the foreign-born population - Laos (%)
Place of birth for the foreign-born population - Malaysia (%)
Place of birth for the foreign-born population - Philippines (%)
Place of birth for the foreign-born population - Singapore (%)
Place of birth for the foreign-born population - Thailand (%)
Place of birth for the foreign-born population - Vietnam (%)
Place of birth for the foreign-born population - Other South Eastern Asia (%)
Place of birth for the foreign-born population - Armenia (%)
Place of birth for the foreign-born population - Iraq (%)
Place of birth for the foreign-born population - Israel (%)
Place of birth for the foreign-born population - Jordan (%)
Place of birth for the foreign-born population - Kuwait (%)
Place of birth for the foreign-born population - Lebanon (%)
Place of birth for the foreign-born population - Saudi Arabia (%)
Place of birth for the foreign-born population - Syria (%)
Place of birth for the foreign-born population - Turkey (%)
Place of birth for the foreign-born population - Yemen (%)
Place of birth for the foreign-born population - Other Western Asia (%)
Place of birth for the foreign-born population - Eritrea (%)
Place of birth for the foreign-born population - Ethiopia (%)
Place of birth for the foreign-born population - Kenya (%)
Place of birth for the foreign-born population - Somalia (%)
Place of birth for the foreign-born population - Uganda (%)
Place of birth for the foreign-born population - Zimbabwe (%)
Place of birth for the foreign-born population - Other Eastern Africa (%)
Place of birth for the foreign-born population - Cameroon (%)
Place of birth for the foreign-born population - Congo (%)
Place of birth for the foreign-born population - Democratic Republic of Congo (Zaire) (%)
Place of birth for the foreign-born population - Other Middle Africa (%)
Place of birth for the foreign-born population - Egypt (%)
Place of birth for the foreign-born population - Morocco (%)
Place of birth for the foreign-born population - Sudan (%)
Place of birth for the foreign-born population - Other Northern Africa (%)
Place of birth for the foreign-born population - South Africa (%)
Place of birth for the foreign-born population - Other Southern Africa (%)
Place of birth for the foreign-born population - Cabo Verde (%)
Place of birth for the foreign-born population - Ghana (%)
Place of birth for the foreign-born population - Liberia (%)
Place of birth for the foreign-born population - Nigeria (%)
Place of birth for the foreign-born population - Senegal (%)
Place of birth for the foreign-born population - Sierra Leone (%)
Place of birth for the foreign-born population - Other Western Africa (%)
Place of birth for the foreign-born population - Australia (%)
Place of birth for the foreign-born population - New Zealand (%)
Place of birth for the foreign-born population - Fiji (%)
Place of birth for the foreign-born population - Micronesia (%)
Place of birth for the foreign-born population - Bahamas (%)
Place of birth for the foreign-born population - Barbados (%)
Place of birth for the foreign-born population - Cuba (%)
Place of birth for the foreign-born population - Dominica (%)
Place of birth for the foreign-born population - Dominican Republic (%)
Place of birth for the foreign-born population - Grenada (%)
Place of birth for the foreign-born population - Haiti (%)
Place of birth for the foreign-born population - Jamaica (%)
Place of birth for the foreign-born population - St. Vincent and the Grenadines (%)
Place of birth for the foreign-born population - Trinidad and Tobago (%)
Place of birth for the foreign-born population - West Indies (%)
Place of birth for the foreign-born population - Other Caribbean (%)
Place of birth for the foreign-born population - Belize (%)
Place of birth for the foreign-born population - Costa Rica (%)
Place of birth for the foreign-born population - El Salvador (%)
Place of birth for the foreign-born population - Guatemala (%)
Place of birth for the foreign-born population - Honduras (%)
Place of birth for the foreign-born population - Mexico (%)
Place of birth for the foreign-born population - Nicaragua (%)
Place of birth for the foreign-born population - Panama (%)
Place of birth for the foreign-born population - Other Central America (%)
Place of birth for the foreign-born population - Argentina (%)
Place of birth for the foreign-born population - Bolivia (%)
Place of birth for the foreign-born population - Brazil (%)
Place of birth for the foreign-born population - Chile (%)
Place of birth for the foreign-born population - Colombia (%)
Place of birth for the foreign-born population - Ecuador (%)
Place of birth for the foreign-born population - Guyana (%)
Place of birth for the foreign-born population - Peru (%)
Place of birth for the foreign-born population - Uruguay (%)
Place of birth for the foreign-born population - Venezuela (%)
Place of birth for the foreign-born population - Other South America (%)
Place of birth for the foreign-born population - Canada (%)
Place of birth for the foreign-born population - Other Northern America (%)
Place of birth for the foreign-born population - Other (%)
Latest news about races in Grandview, MO collected exclusively by city-data.com from local newspapers, TV, and radio stations
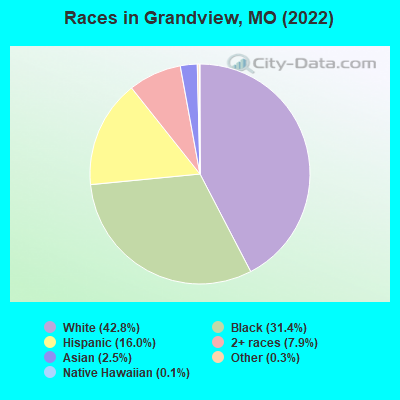
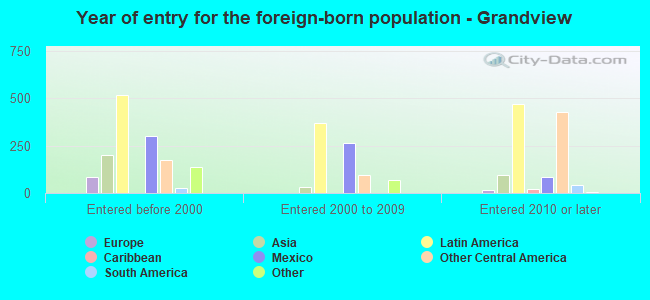
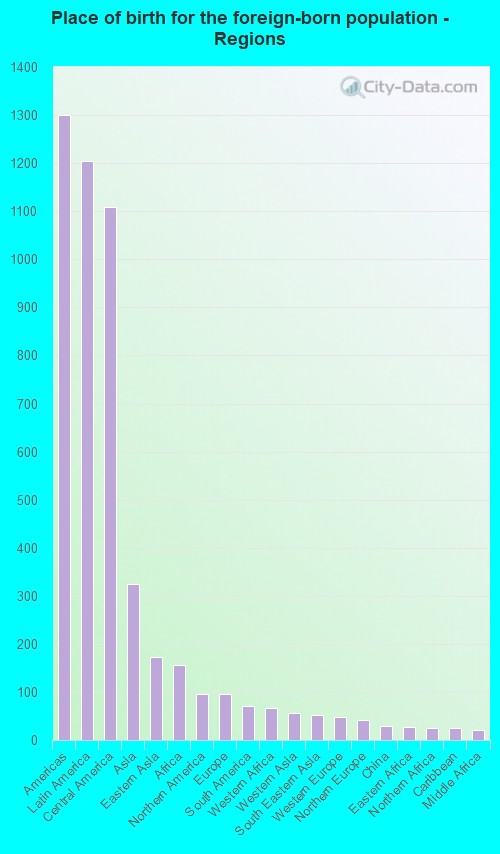
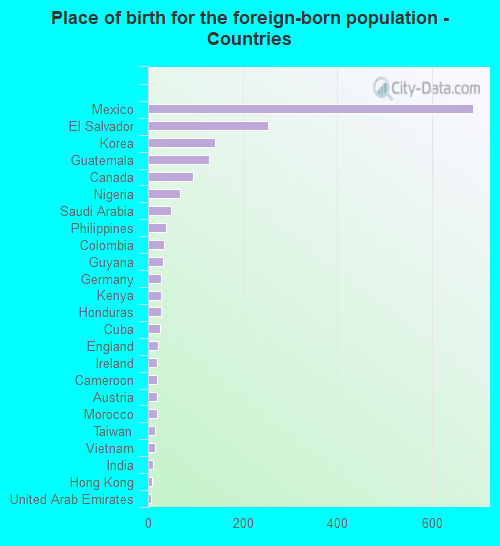
According to 2022 data, the most numerous races in Grandview, MO are White alone (11,103 residents), Black alone (8,159 residents), and Two or more races (2,045 residents). 86.7% of Grandview residents speak English at home. 7.2% of Grandview, MO residents are foreign-born (4.8% born in Latin America, 1.3% born in Asia), which is 44.8% greater than the foreign-born rate of 4.0% across the entire state of Missouri.
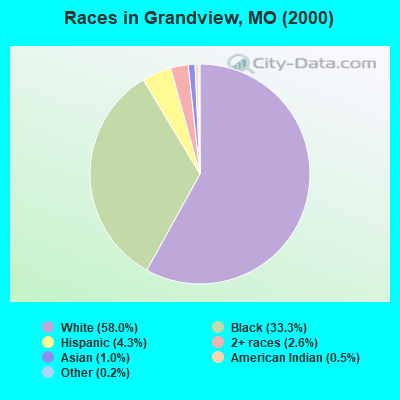
Race distribution in Grandview
2000 2022
4,686,474 83.8% White alone 625,667 11.2% Black alone 118,592 2.1% Hispanic 71,905 1.3% Two or more races 61,041 1.1% Asian alone 23,302 0.4% American Indian alone 5,291 0.09% Other race alone 2,939 0.05% Native Hawaiian and Other
4,733,411 76.6% White alone 656,739 10.6% Black alone 316,300 5.1% Two or more races 291,763 4.7% Hispanic 132,436 2.1% Asian alone 27,467 0.4% Other race alone 12,313 0.2% American Indian alone 7,528 0.1% Native Hawaiian and Other
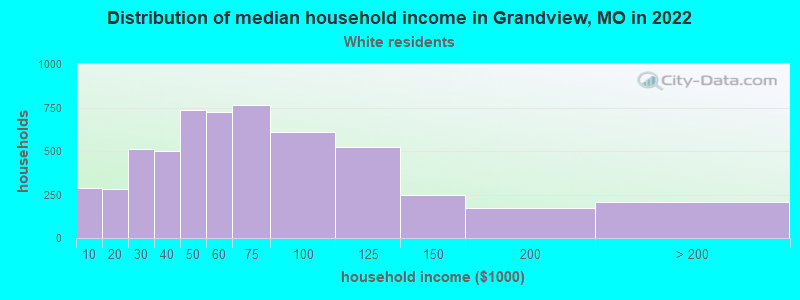
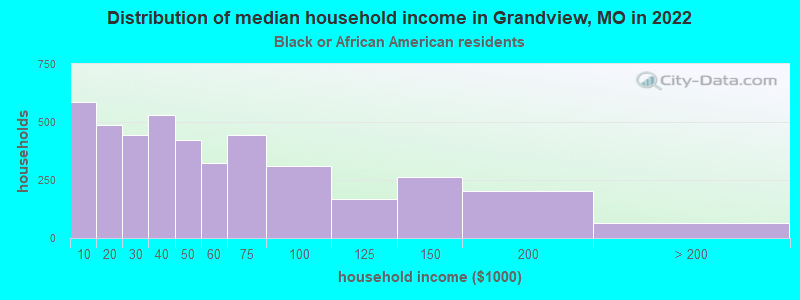
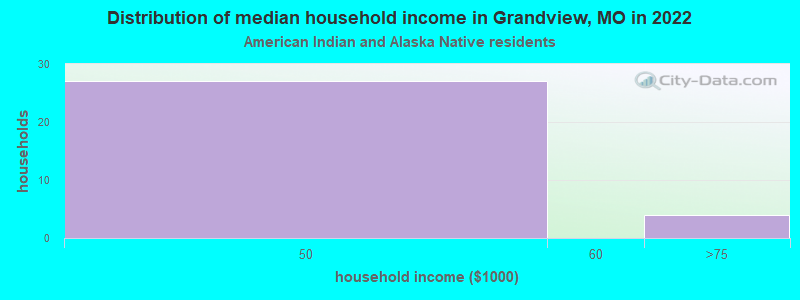
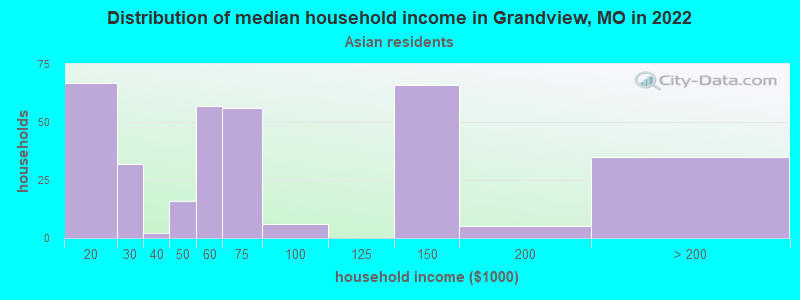
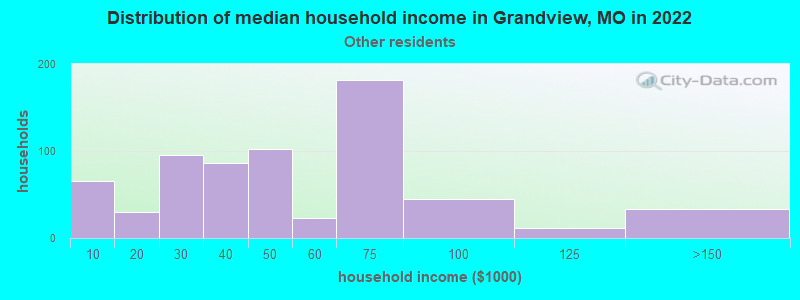
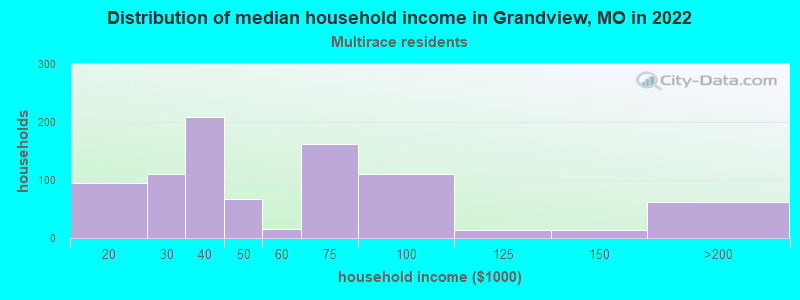
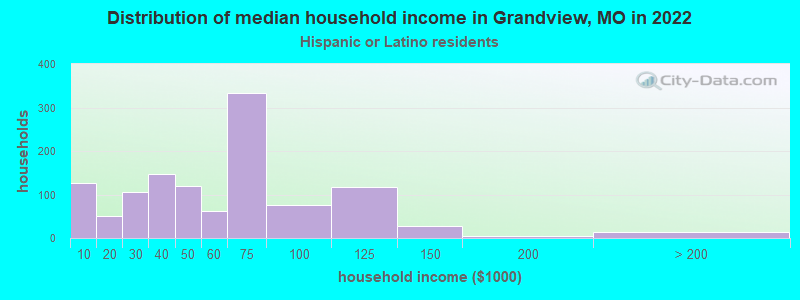
Income and house value in Grandview Median household income in 2022 $54,644 White non-Hispanic householders$43,617 Black householders$55,959 Asian householders$48,096 Some other race householders$39,357 Two or more races householders$59,174 Hispanic or Latino race householdersMedian 2022 house value $163,013 White Non-Hispanic householders$202,430 Black or African American householders$144,752 American Indian or Alaska Native householders $273,693 Asian householders$173,257 Some other race householders$150,765 Two or more races householders$154,773 Hispanic or Latino householders
Median age by race in Grandview
38.4 Median age for White residents35.6 41.2 40.8 Median age for Black or African American residents39.2 42.1 39.4 Median age for American Indian / Alaska Native residents5.9 45.2 39.9 Median age for Asian residents46.7 35.3 -832,285,114.5 Median age for Native Hawaiian / Pacific Islander residents-678,601,874.9 -752,136,751.4 19.7 Median age for Other race residents18.1 24.5 22.1 Median age for Two or more races residents21.1 23.5 40.5 Median age for White alone residents38.0 42.3 21.4 Median age for Hispanic or Latino residents18.0 25.8
Owner/renter occupied households by race in Grandview
House owners and renters - White residents 3,069 56.0% Owner occupied2,409 44.0% Renter occupiedHouse owners and renters - Black or African American residents 1,874 44.1% Owner occupied2,372 55.9% Renter occupiedHouse owners and renters - American Indian / Alaska Native residents 28 100.0% Renter occupiedHouse owners and renters - Asian residents 269 70.4% Owner occupied113 29.6% Renter occupiedHouse owners and renters - Native Hawaiian / Pacific Islander residents 28 100.0% Owner occupiedHouse owners and renters - Other race residents 258 50.7% Owner occupied251 49.3% Renter occupiedHouse owners and renters - Two or more races residents 390 46.2% Owner occupied454 53.8% Renter occupiedHouse owners and renters - White alone residents 3,006 58.3% Owner occupied2,154 41.7% Renter occupiedHouse owners and renters - Hispanic or Latino residents 444 39.1% Owner occupied691 60.9% Renter occupied
Language usage in Grandview
English speakers - Total 86.7% of residents of Grandview speak English at home.
10.3% of residents speak Spanish at home 1,436 57.6% Speak English very well1,055 42.4% Speak English less than very well3.3% of residents speak other language at home 640 81.4% Speak English very well146 18.6% Speak English less than very well
English speakers - Born in the United States 93.6% of residents of Grandview speak English at home.
4.3% of residents speak Spanish at home 411 89.9% Speak English very well46 10.1% Speak English less than very well1.9% of residents speak other language at home 180 87.8% Speak English very well25 12.2% Speak English less than very well
English speakers - Native, born elsewhere 31.3% of residents of Grandview speak English at home.
73.4% of residents speak Spanish at home 195 65.9% Speak English very well101 34.1% Speak English less than very well6.0% of residents speak other language at home 22 91.7% Speak English very well2 8.3% Speak English less than very well
English speakers - Foreign-born 16.4% of residents of Grandview speak English at home.
64.1% of residents speak Spanish at home 344 27.3% Speak English very well917 72.7% Speak English less than very well21.2% of residents speak other language at home 290 69.4% Speak English very well128 30.6% Speak English less than very well
White (Caucasian) - Speak only English Native:
94.2% (10,480)Foreign-born:
38.6% (166)
White (Caucasian) - Speak another language Native:
4.8% (530)Foreign-born:
61.8% (265)
Black or African American - Speak only English Native:
98.2% (7,598)Foreign-born:
76.7% (141)
Black or African American - Speak another language Native:
1.4% (106)Foreign-born:
29.5% (54)
Asian - Speak only English Native:
77.4% (254)Foreign-born:
3.3% (9)
Asian - Speak another language Native:
23.1% (76)Foreign-born:
94.6% (265)
Other race - Speak another language Native:
59.9% (522)Foreign-born:
94.7% (623)
Two or more races - Speak another language Native:
6.2% (128)Foreign-born:
100.0% (210)
White alone - Speak only English Native:
97.6% (10,068)Foreign-born:
55.5% (158)
White alone - Speak another language Native:
2.3% (242)Foreign-born:
44.5% (127)
Hispanic or Latino - Speak only English Native:
48.7% (1,116)Foreign-born:
0.7% (9)
Hispanic or Latino - Speak another language Native:
50.9% (1,166)Foreign-born:
99.2% (1,266)
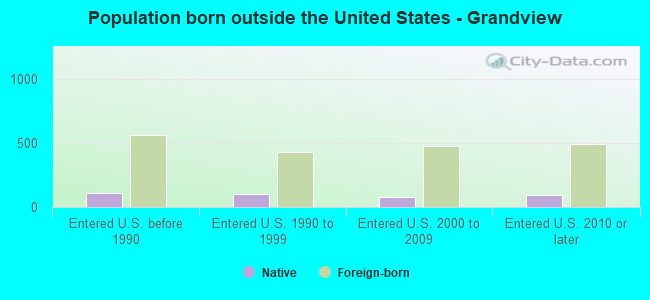
Foreign-born residents in Grandview 1,880 residents are foreign born (4.8% Latin America , 1.3% Asia ).
This city:
7.2%Missouri:
4.2%
Marital status for residents in Grandview Marital status - White (Caucasian) population 15 years and over
Males 39.5% Never married45.8% Now married1.9% Separated2.0% Widowed10.8% DivorcedFemales 31.3% Never married42.4% Now married0.4% Separated9.7% Widowed16.2% DivorcedWomen who gave birth in the past 12 months Now married:
100.0% (147)Unmarried:
0.0% (0)
Women who did not give birth in the past 12 months Now married:
39.3% (1,147)Unmarried:
60.7% (1,767)
Marital status - Black or African American population 15 years and over
Males 47.4% Never married30.2% Now married1.5% Separated2.8% Widowed18.2% DivorcedFemales 44.8% Never married24.3% Now married5.4% Separated10.5% Widowed15.1% DivorcedWomen who gave birth in the past 12 months Now married:
64.1% (71)Unmarried:
35.9% (40)
Women who did not give birth in the past 12 months Now married:
22.8% (509)Unmarried:
77.2% (1,724)
Marital status - American Indian / Alaska Native population 15 years and over
Males 0.0% Never married100.0% Now married0.0% Separated0.0% Widowed0.0% DivorcedFemales 4.4% Never married95.6% Now married0.0% Separated0.0% Widowed0.0% DivorcedWomen who did not give birth in the past 12 months Now married:
95.6% (64)Unmarried:
4.4% (3)
Marital status - Asian population 15 years and over
Males 17.1% Never married54.4% Now married0.0% Separated18.9% Widowed9.6% DivorcedFemales 33.0% Never married34.8% Now married0.0% Separated11.7% Widowed20.5% DivorcedWomen who did not give birth in the past 12 months Now married:
21.2% (38)Unmarried:
78.8% (141)
Marital status - Other race population 15 years and over
Males 58.8% Never married35.2% Now married2.6% Separated0.0% Widowed3.3% DivorcedFemales 65.5% Never married26.7% Now married3.0% Separated0.0% Widowed4.8% DivorcedWomen who gave birth in the past 12 months Now married:
0.0% (0)Unmarried:
100.0% (40)
Women who did not give birth in the past 12 months Now married:
31.4% (162)Unmarried:
68.6% (354)
Marital status - Two or more races population 15 years and over
Males 45.9% Never married50.4% Now married0.0% Separated0.0% Widowed3.7% DivorcedFemales 48.9% Never married28.8% Now married0.0% Separated6.0% Widowed16.2% DivorcedWomen who gave birth in the past 12 months Now married:
100.0% (14)Unmarried:
0.0% (0)
Women who did not give birth in the past 12 months Now married:
27.3% (153)Unmarried:
72.7% (409)
Marital status - White alone, not Hispanic / Latino population 15 years and over
Males 40.8% Never married44.5% Now married1.6% Separated2.3% Widowed10.8% DivorcedFemales 29.6% Never married42.6% Now married0.5% Separated10.5% Widowed16.9% DivorcedWomen who gave birth in the past 12 months Now married:
100.0% (85)Unmarried:
0.0% (0)
Women who did not give birth in the past 12 months Now married:
40.6% (1,081)Unmarried:
59.4% (1,584)
Marital status - Hispanic or Latino population 15 years and over
Males 43.3% Never married47.8% Now married1.9% Separated0.0% Widowed7.1% DivorcedFemales 50.7% Never married38.1% Now married1.5% Separated2.6% Widowed7.0% DivorcedWomen who gave birth in the past 12 months Now married:
62.0% (72)Unmarried:
38.0% (44)
Women who did not give birth in the past 12 months Now married:
38.3% (398)Unmarried:
61.7% (642)
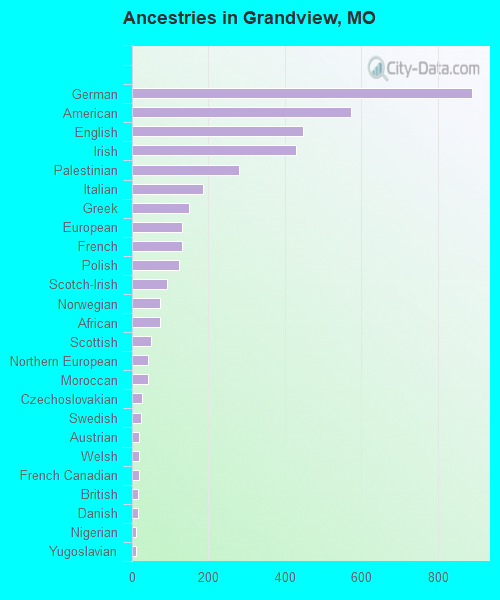
Ancestries in Grandview
889 6.5% German572 4.2% American448 3.3% English429 3.1% Irish280 2.0% Palestinian186 1.4% Italian150 1.1% Greek132 1.0% European132 1.0% French124 0.9% Polish91 0.7% Scotch-Irish74 0.5% Norwegian74 0.5% African50 0.4% Scottish42 0.3% Northern European41 0.3% Moroccan25 0.2% Czechoslovakian24 0.2% Swedish19 0.1% Austrian19 0.1% Welsh17 0.1% French Canadian16 0.1% British16 0.1% Danish11 0.08% Nigerian10 0.07% Yugoslavian9 0.07% Egyptian8 0.06% Eastern European7 0.05% Ukrainian5 0.04% Slovene4 0.03% Dutch4 0.03% Finnish2 0.01% Cypriot
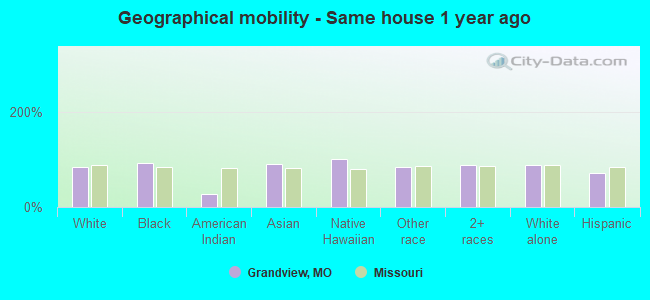
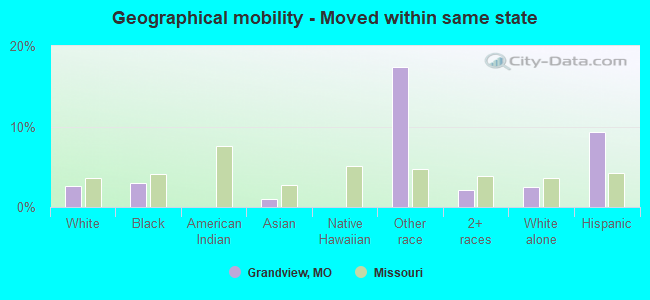
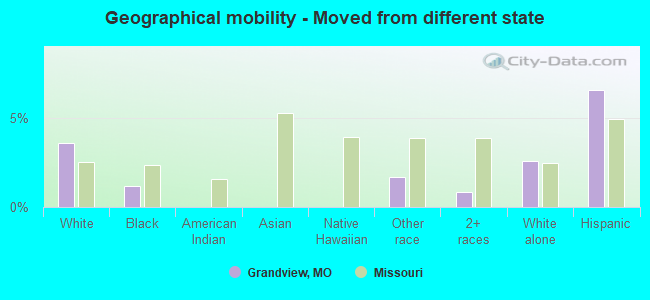
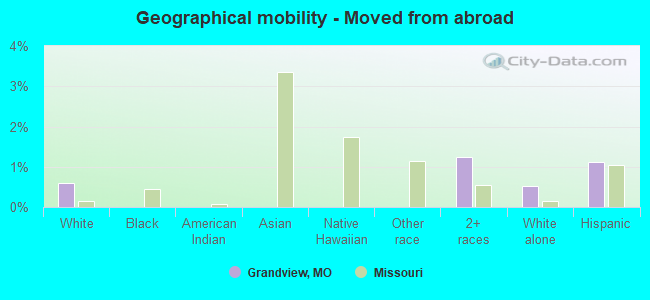
Geographical mobility in Grandview Same house 1 year ago 10,241 84.1% White (Caucasian)7,560 92.2% Black or African American45 28.3% American Indian / Alaska Native595 89.7% Asian44 100.0% Native Hawaiian / Pacific Islander1,448 84.2% Other race2,412 89.2% Two or more races9,772 88.3% White alone, not Hispanic / Latino2,820 70.9% Hispanic or LatinoMoved within same county 1,097 9.0% White / Caucasian430 5.2% Black or African American119 74.3% American Indian / Alaska Native52 7.8% Asian44 2.6% Other race182 6.7% Two or more races630 5.7% White alone, not Hispanic / Latino558 14.0% Hispanic or LatinoMoved within same state 311 2.6% White / Caucasian247 3.0% Black or African American6 1.0% Asian299 17.4% Other race57 2.1% Two or more races269 2.4% White alone, not Hispanic / Latino369 9.3% Hispanic or LatinoMoved from different state 433 3.6% White / Caucasian96 1.2% Black or African American29 1.7% Other race23 0.8% Two or more races286 2.6% White alone, not Hispanic / Latino261 6.6% Hispanic or LatinoMoved from abroad 74 0.6% White33 1.2% Two or more races57 0.5% White alone, not Hispanic / Latino45 1.1% Hispanic or Latino
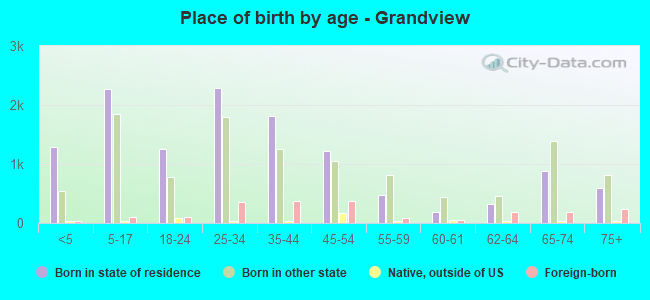
Children Nativity (place of birth) in Grandview
Children under 6 years - Living with two parents Both parents native 1,030 100.0% NativeBoth parents foreign-born 156 83.9% Native30 16.1% Foreign-bornOne native, one foreign-born parent 194 100.0% NativeChildren under 6 years - Living with one parent Native parent 308 100.0% NativeForeign-born parent 227 100.0% NativeChildren 6 to 17 years - Living with two parents Both parents native 1,347 100.0% NativeBoth parents foreign-born 309 98.3% Native5 1.7% Foreign-bornOne native, one foreign-born parent 132 91.1% Native13 8.9% Foreign-bornChildren 6 to 17 years - Living with one parent Native parent 1,102 100.0% NativeForeign-born parent 442 55.0% Native361 45.0% Foreign-born
Grandparents responsible for own grandchildren in Grandview
Grandparents (30 to 59 years) White / Caucasian 22 42.9% Responsible for grandchildren30 57.1% Not responsible for grandchildrenBlack or African American 15 29.4% Responsible for grandchildren36 70.6% Not responsible for grandchildrenTwo or more races 5 100.0% Responsible for grandchildrenWhite alone, not Hispanic / Latino 27 47.8% Responsible for grandchildren30 52.2% Not responsible for grandchildrenGrandparents (60 years and over) White / Caucasian 15 19.7% Responsible for grandchildren60 80.3% Not responsible for grandchildrenBlack or African American 7 20.0% Responsible for grandchildren30 80.0% Not responsible for grandchildrenTwo or more races 39 100.0% Not responsible for grandchildrenWhite alone, not Hispanic / Latino 7 12.9% Responsible for grandchildren45 87.1% Not responsible for grandchildren