Races in Grandville, Michigan (MI) Detailed Stats
Ancestries, Foreign-born residents, place of birth
Settings
X


Recent posts about races in Grandville, Michigan on our local forum with over 2,400,000 registered users:
 | Possibly relocating to Grandville pros and any cons? (4 replies) |
| Grand Rapids a good fit? (16 replies) |
| Grand Rapids for Dummies (16 replies) |
| Latino district in Grand Rapids (3 replies) |
| Alabama to Grand Rapids (8 replies) |
| Michiganders, I need compare contrast on Kent County vs. Ottawa County burbs surrounding Grand Rapids (7 replies) |
Latest news about races in Grandville, MI collected exclusively by city-data.com from local newspapers, TV, and radio stations
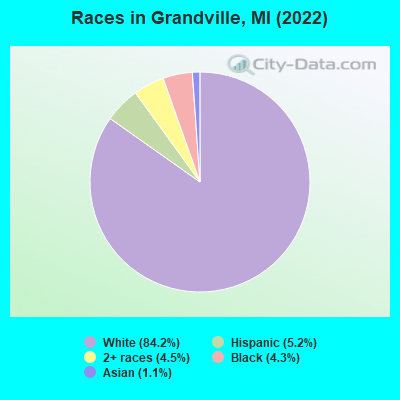
According to 2022 data, the most numerous races in Grandville, MI are White alone (13,524 residents), Black alone (696 residents), and Hispanic (834 residents). 95.0% of Grandville residents speak English at home. 3.3% of Grandville, MI residents are foreign-born (1.3% born in Latin America, 0.9% born in Europe, 0.9% born in Asia), which is 80.8% less than the foreign-born rate of 6.0% across the entire state of Michigan.
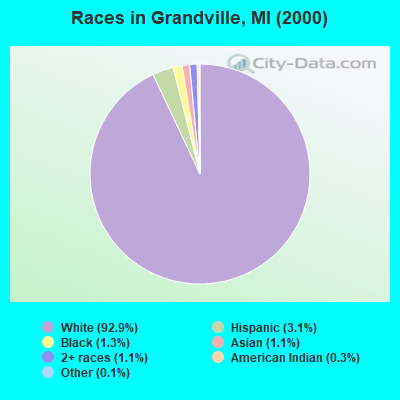
Race distribution in Grandville
2000
2022

- 15,11392.9%White alone
- 5013.1%Hispanic
- 2171.3%Black alone
- 1821.1%Two or more races
- 1871.1%Asian alone
- 420.3%American Indian alone
- 170.1%Other race alone
- 40.02%Native Hawaiian and Other
Pacific Islander alone
-
- 13,52484.2%White alone
- 8345.2%Hispanic
- 7214.5%Two or more races
- 6964.3%Black alone
- 1811.1%Asian alone
- 130.08%Other race alone
- 110.07%American Indian alone
2000
2022
-
- 7,806,69178.6%White alone
- 1,402,04714.1%Black alone
- 323,8773.3%Hispanic
- 175,3111.8%Asian alone
- 163,4871.6%Two or more races
- 53,4210.5%American Indian alone
- 11,4650.1%Other race alone
- 2,1450.02%Native Hawaiian and Other
Pacific Islander alone

-
- 7,289,05172.6%White alone
- 1,310,46413.1%Black alone
- 572,4055.7%Hispanic
- 450,0314.5%Two or more races
- 335,7323.3%Asian alone
- 45,2170.5%Other race alone
- 29,0110.3%American Indian alone
- 2,2070.02%Native Hawaiian and Other
Pacific Islander alone

Income and house value in Grandville
- Median household income in 2022
- $77,135White non-Hispanic householders
- $57,431Some other race householders
- $109,605Two or more races householders
- $81,537Hispanic or Latino race householders
- Median 2022 house value
- $266,592White Non-Hispanic householders
- $392,035Black or African American householders
- $288,190American Indian or Alaska Native householders
- $207,252Asian householders
- $245,431Some other race householders
- $163,620Two or more races householders
- $221,651Hispanic or Latino householders
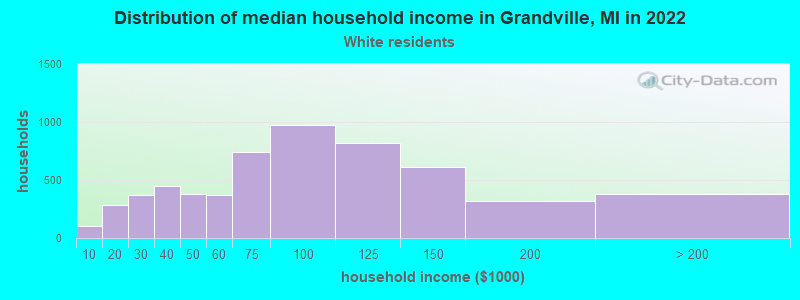
Household income for White non-Hispanic householders
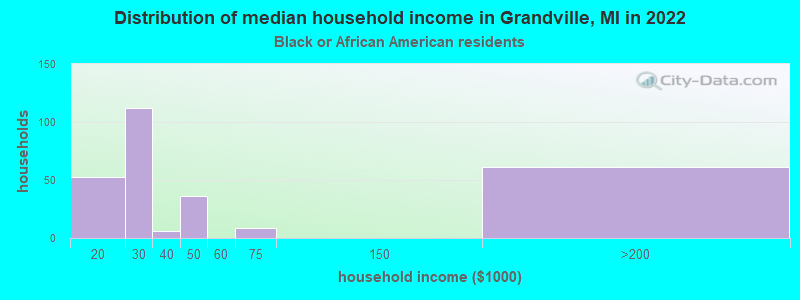
Household income for Black householders
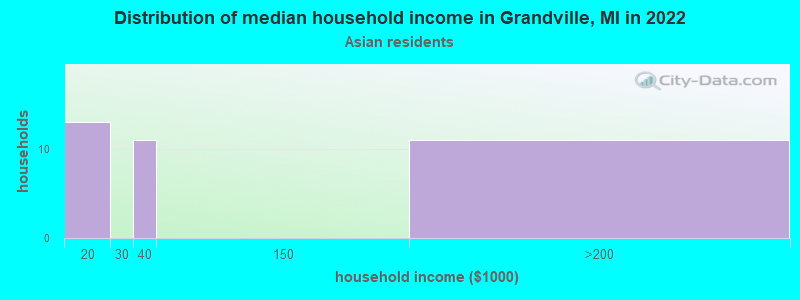
Household income for Asian householders
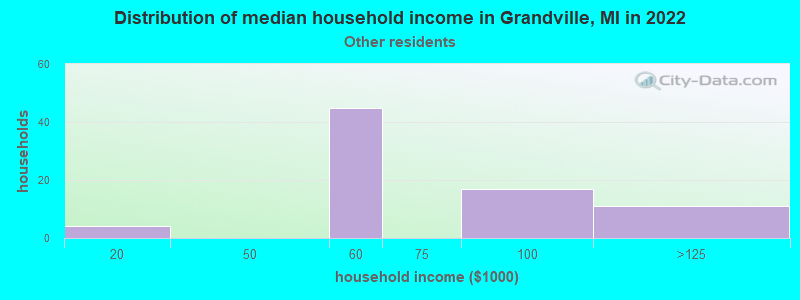
Household income for Some other race householders
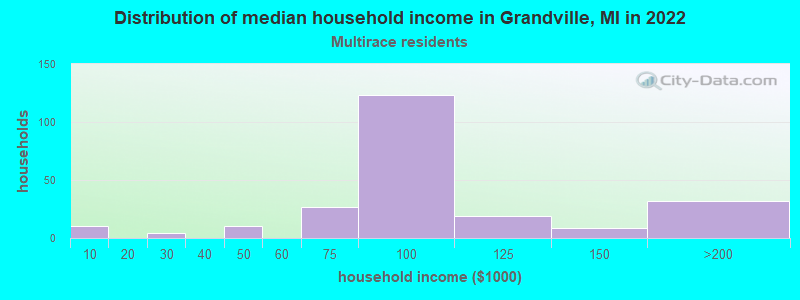
Household income for Two or more races householders
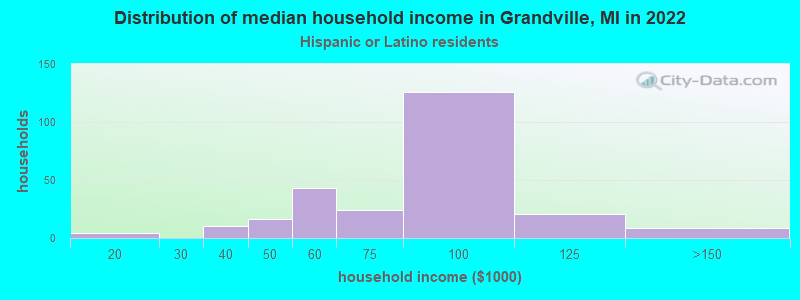
Household income for Hispanic or Latino race householders
Median age by race in Grandville
- 38.9Median age for White residents
- 35.3Males
- 41.4Females
- 27.1Median age for Black or African American residents
- 23.8Males
- 26.5Females
- -697,722,566.6Median age for American Indian / Alaska Native residents
- -697,626,418.3Males
- -677,018,632.9Females
- 29.8Median age for Asian residents
- 42.3Males
- 27.5Females
- -670,531,400.3Median age for Native Hawaiian / Pacific Islander residents
- -674,772,035.8Males
- -699,588,476.7Females
- 25.8Median age for Other race residents
- 30.5Males
- 21.6Females
- 29.6Median age for Two or more races residents
- 35.8Males
- 25.9Females
- 38.4Median age for White alone residents
- 35.0Males
- 41.3Females
- 37.2Median age for Hispanic or Latino residents
- 41.9Males
- 24.2Females
Owner/renter occupied households by race in Grandville
- House owners and renters - White residents
- 4,40275.5%Owner occupied
- 1,43024.5%Renter occupied
- House owners and renters - Black or African American residents
- 5223.8%Owner occupied
- 16676.2%Renter occupied
- House owners and renters - American Indian / Alaska Native residents
- 14100.0%Renter occupied
- House owners and renters - Asian residents
- 1629.9%Owner occupied
- 3870.1%Renter occupied
- House owners and renters - Other race residents
- 1834.7%Owner occupied
- 3465.3%Renter occupied
- House owners and renters - Two or more races residents
- 11861.5%Owner occupied
- 7438.5%Renter occupied
- House owners and renters - White alone residents
- 4,40776.8%Owner occupied
- 1,33223.2%Renter occupied
- House owners and renters - Hispanic or Latino residents
- 6123.7%Owner occupied
- 19576.3%Renter occupied
Language usage in Grandville
- English speakers - Total
- 95.0% of residents of Grandville speak English at home.
- 1.8% of residents speak Spanish at home
- 23787.5%Speak English very well
- 3412.5%Speak English less than very well
- 2.5% of residents speak other language at home
- 28174.3%Speak English very well
- 9725.7%Speak English less than very well
- English speakers - Born in the United States
- 99.9% of residents of Grandville speak English at home.
- 0.2% of residents speak Spanish at home
- 3100.0%Speak English very well
- 1.1% of residents speak other language at home
- 18100.0%Speak English very well
- English speakers - Native, born elsewhere
- 96.8% of residents of Grandville speak English at home.
- 16.7% of residents speak Spanish at home
- 838.1%Speak English very well
- 1361.9%Speak English less than very well
- English speakers - Foreign-born
- 38.1% of residents of Grandville speak English at home.
- 21.4% of residents speak Spanish at home
- 10994.0%Speak English very well
- 76.0%Speak English less than very well
- 35.4% of residents speak other language at home
- 11760.9%Speak English very well
- 7539.1%Speak English less than very well
White (Caucasian) - Speak only English
| Native: | 98.4% (12,500) |
| Foreign-born: | 37.8% (111) |
White (Caucasian) - Speak another language
| Native: | 1.7% (212) |
| Foreign-born: | 62.6% (184) |
Asian - Speak only English
| Native: | 46.8% (13) |
| Foreign-born: | 11.5% (13) |
Asian - Speak another language
| Native: | 53.3% (14) |
| Foreign-born: | 88.5% (102) |
Other race - Speak only English
| Native: | 97.0% (88) |
| Foreign-born: | 100.0% (56) |
Two or more races - Speak another language
| Native: | 1.2% (12) |
| Foreign-born: | 100.0% (14) |
White alone - Speak only English
| Native: | 98.7% (12,407) |
| Foreign-born: | 46.7% (105) |
White alone - Speak another language
| Native: | 1.3% (159) |
| Foreign-born: | 49.4% (111) |
Hispanic or Latino - Speak only English
| Native: | 83.8% (511) |
| Foreign-born: | 45.7% (97) |
Hispanic or Latino - Speak another language
| Native: | 19.6% (119) |
| Foreign-born: | 56.2% (119) |
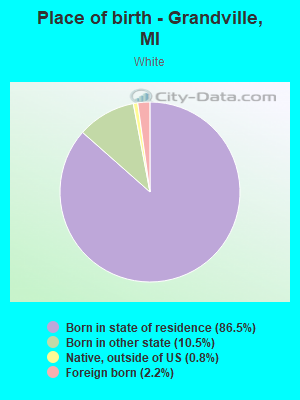
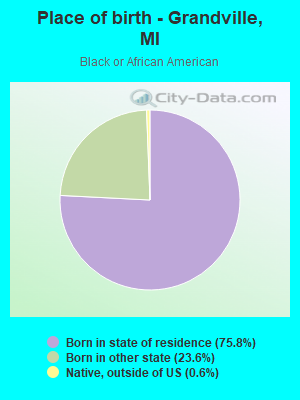
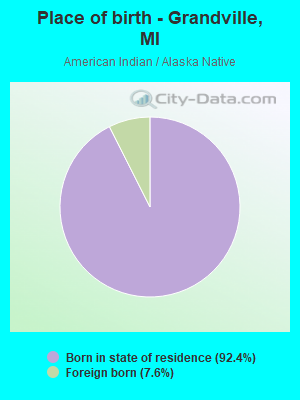
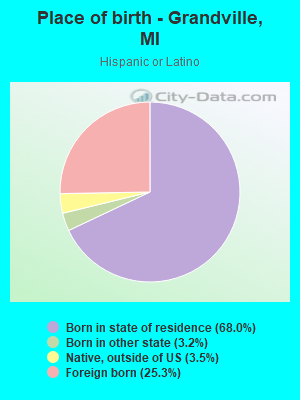
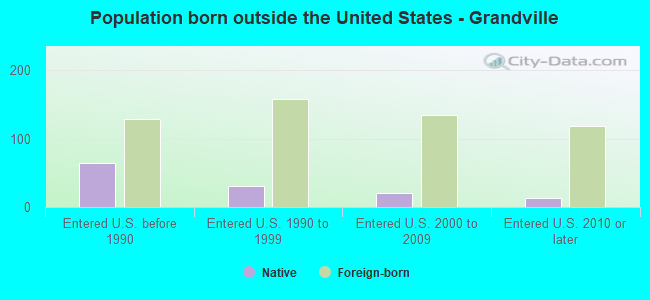
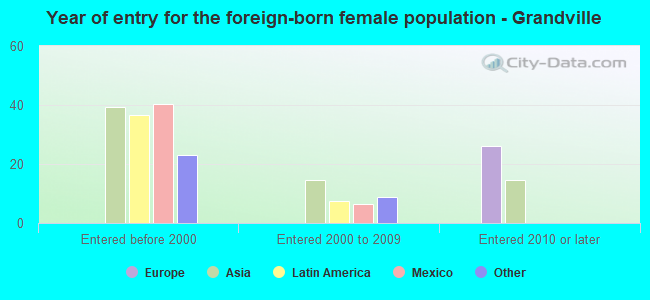
Foreign-born residents in Grandville
533 residents are foreign born (1.3% Latin America, 0.9% Europe, 0.9% Asia).
| This city: | 3.3% |
| Michigan: | 6.9% |
Marital status for residents in Grandville
Marital status - White (Caucasian) population 15 years and over
- Males
- 30.1%Never married
- 61.2%Now married
- 0.0%Separated
- 1.7%Widowed
- 7.0%Divorced
- Females
- 27.3%Never married
- 54.0%Now married
- 0.5%Separated
- 5.3%Widowed
- 12.9%Divorced
Women who gave birth in the past 12 months
| Now married: | 94.6% (151) |
| Unmarried: | 5.4% (9) |
Women who did not give birth in the past 12 months
| Now married: | 44.3% (1,398) |
| Unmarried: | 55.7% (1,759) |
Marital status - Black or African American population 15 years and over
- Males
- 64.7%Never married
- 35.3%Now married
- 0.0%Separated
- 0.0%Widowed
- 0.0%Divorced
- Females
- 69.5%Never married
- 0.0%Now married
- 0.0%Separated
- 1.4%Widowed
- 29.1%Divorced
Women who did not give birth in the past 12 months
| Now married: | 0.0% (0) |
| Unmarried: | 100.0% (170) |
Marital status - American Indian / Alaska Native population 15 years and over
- Males
- 0.0%Never married
- 0.0%Now married
- 0.0%Separated
- 0.0%Widowed
- 100.0%Divorced
- Females
- 100.0%Never married
- 0.0%Now married
- 0.0%Separated
- 0.0%Widowed
- 0.0%Divorced
Marital status - Asian population 15 years and over
- Males
- 8.1%Never married
- 91.9%Now married
- 0.0%Separated
- 0.0%Widowed
- 0.0%Divorced
- Females
- 37.7%Never married
- 62.3%Now married
- 0.0%Separated
- 0.0%Widowed
- 0.0%Divorced
Women who gave birth in the past 12 months
| Now married: | 100.0% (35) |
| Unmarried: | 0.0% (0) |
Women who did not give birth in the past 12 months
| Now married: | 34.1% (16) |
| Unmarried: | 65.9% (30) |
Marital status - Other race population 15 years and over
- Males
- 39.7%Never married
- 60.3%Now married
- 0.0%Separated
- 0.0%Widowed
- 0.0%Divorced
- Females
- 47.5%Never married
- 44.1%Now married
- 8.5%Separated
- 0.0%Widowed
- 0.0%Divorced
Women who did not give birth in the past 12 months
| Now married: | 45.1% (18) |
| Unmarried: | 54.9% (22) |
Marital status - Two or more races population 15 years and over
- Males
- 32.8%Never married
- 67.2%Now married
- 0.0%Separated
- 0.0%Widowed
- 0.0%Divorced
- Females
- 63.7%Never married
- 27.3%Now married
- 0.0%Separated
- 0.0%Widowed
- 9.0%Divorced
Women who did not give birth in the past 12 months
| Now married: | 14.6% (44) |
| Unmarried: | 85.4% (260) |
Marital status - White alone, not Hispanic / Latino population 15 years and over
- Males
- 29.9%Never married
- 61.1%Now married
- 0.0%Separated
- 1.7%Widowed
- 7.2%Divorced
- Females
- 27.1%Never married
- 54.2%Now married
- 0.5%Separated
- 5.4%Widowed
- 12.8%Divorced
Women who gave birth in the past 12 months
| Now married: | 94.6% (153) |
| Unmarried: | 5.4% (9) |
Women who did not give birth in the past 12 months
| Now married: | 44.6% (1,379) |
| Unmarried: | 55.4% (1,711) |
Marital status - Hispanic or Latino population 15 years and over
- Males
- 27.2%Never married
- 72.8%Now married
- 0.0%Separated
- 0.0%Widowed
- 0.0%Divorced
- Females
- 53.6%Never married
- 35.0%Now married
- 2.1%Separated
- 0.0%Widowed
- 9.3%Divorced
Women who did not give birth in the past 12 months
| Now married: | 28.7% (63) |
| Unmarried: | 71.3% (156) |
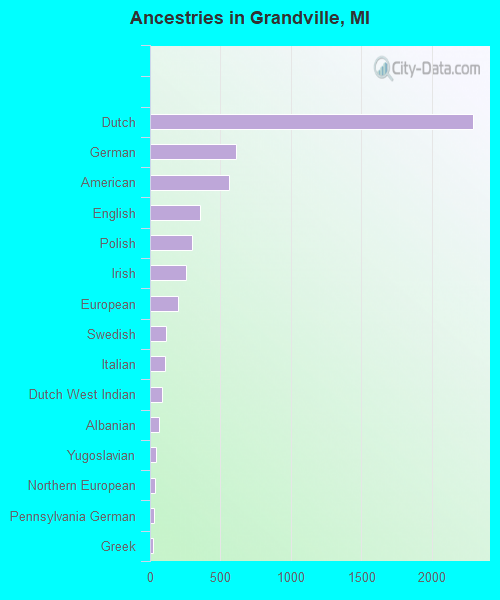
Ancestries in Grandville

- 2,29335.2%Dutch
- 6129.4%German
- 5598.6%American
- 3575.5%English
- 3014.6%Polish
- 2563.9%Irish
- 1973.0%European
- 1151.8%Swedish
- 1031.6%Italian
- 881.4%Dutch West Indian
- 631.0%Albanian
- 420.6%Yugoslavian
- 340.5%Northern European
- 270.4%Pennsylvania German
- 210.3%Greek
- 190.3%French
- 180.3%Belgian
- 170.3%French Canadian
- 150.2%Danish
- 150.2%Liberian
- 140.2%Eastern European
- 130.2%Latvian
- 80.1%Norwegian
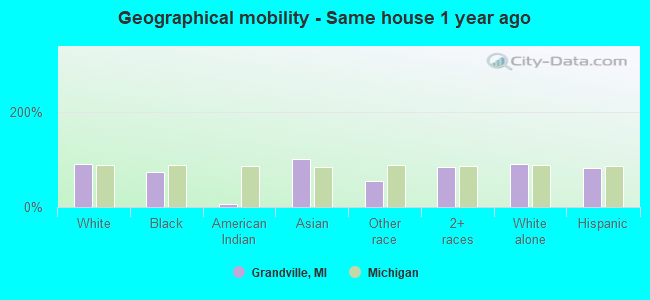
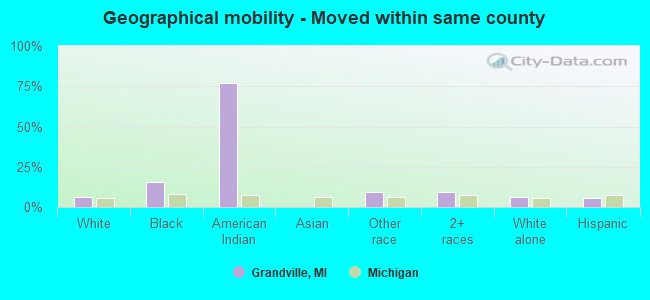
Geographical mobility in Grandville

- Same house 1 year ago
- 12,12489.6%White (Caucasian)
- 50872.7%Black or African American
- 16.8%American Indian / Alaska Native
- 171100.0%Asian
- 8255.0%Other race
- 99283.7%Two or more races
- 11,96889.6%White alone, not Hispanic / Latino
- 68782.1%Hispanic or Latino
-
- Moved within same county
- 8416.2%White / Caucasian
- 11115.8%Black or African American
- 1277.3%American Indian / Alaska Native
- 149.6%Other race
- 1139.5%Two or more races
- 8636.5%White alone, not Hispanic / Latino
- 485.7%Hispanic or Latino
-
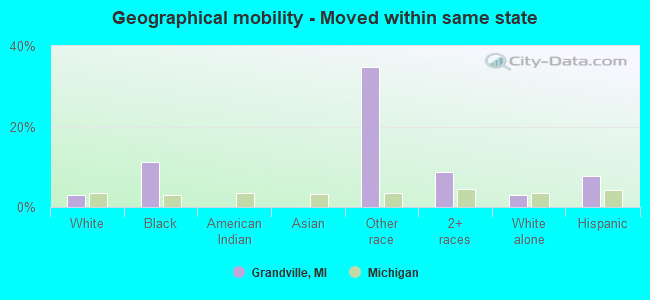
- Moved within same state
- 4133.1%White / Caucasian
- 7911.2%Black or African American
- 5234.8%Other race
- 1048.7%Two or more races
- 4033.0%White alone, not Hispanic / Latino
- 657.8%Hispanic or Latino
-
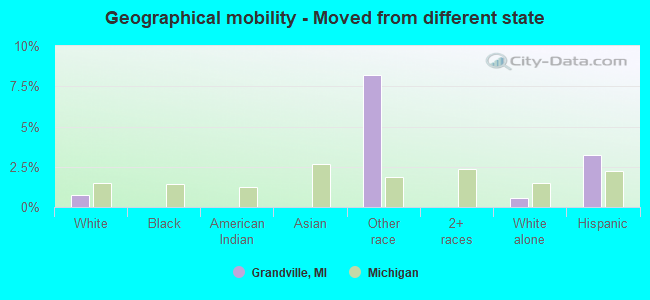
- Moved from different state
- 1000.7%White / Caucasian
- 128.2%Other race
- 750.6%White alone, not Hispanic / Latino
- 273.2%Hispanic or Latino
-
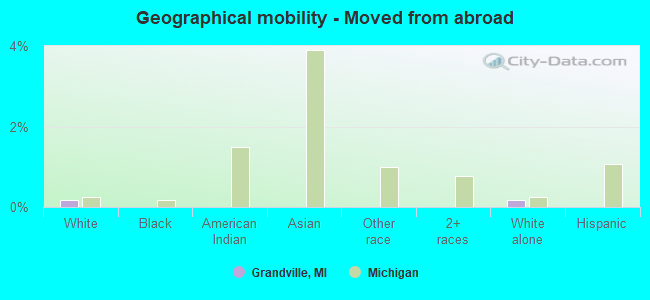
- Moved from abroad
- 230.2%White
- 230.2%White alone, not Hispanic / Latino
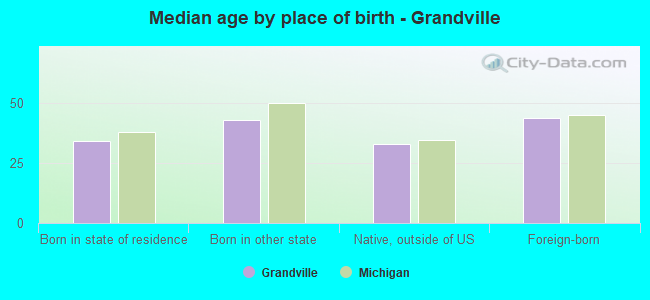
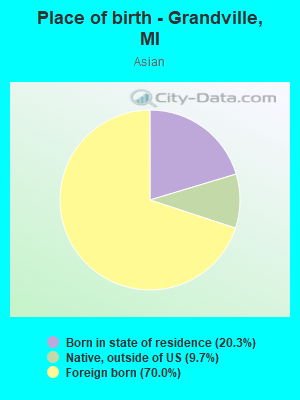
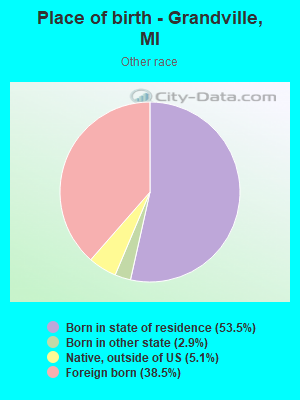
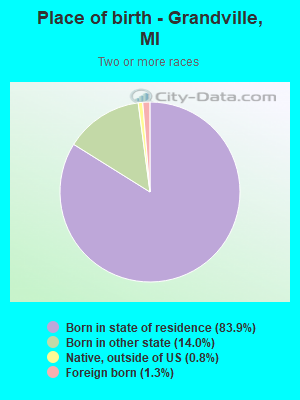
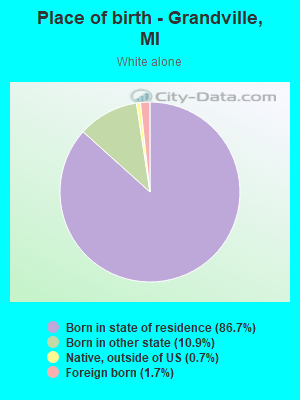
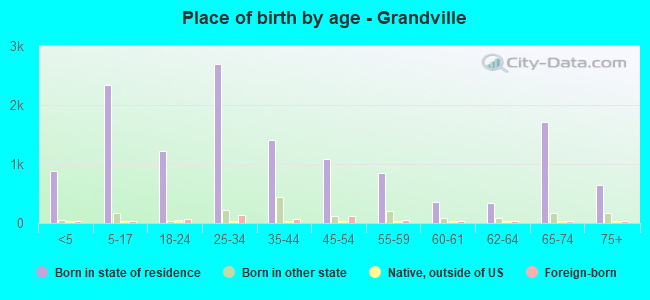
Children Nativity (place of birth) in Grandville
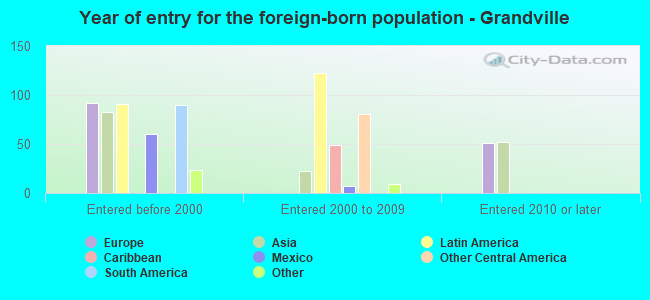
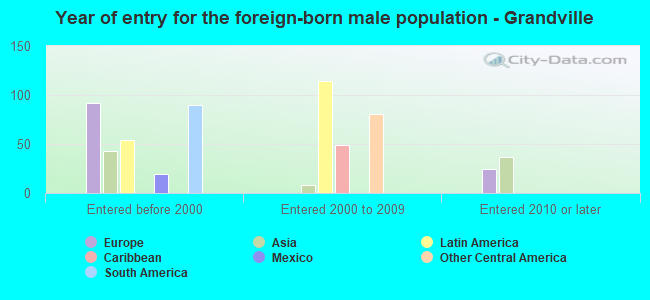
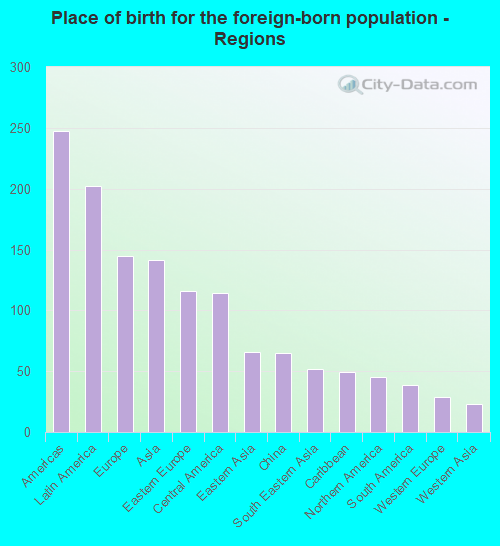
Place of birth for residents in Grandville
![Place of birth for the foreign-born population - Regions]()
- 247Americas
- 202Latin America
- 145Europe
- 141Asia
- 116Eastern Europe
- 114Central America
- 66Eastern Asia
- 65China
- 52South Eastern Asia
- 49Caribbean
- 45Northern America
- 39South America
- 29Western Europe
- 23Western Asia
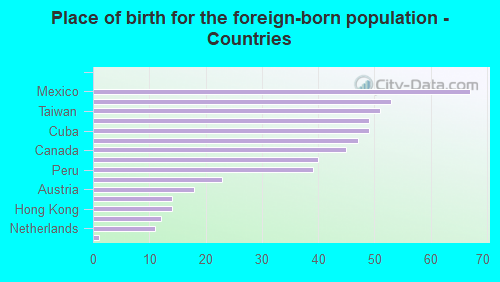
![Place of birth for the foreign-born population - Countries]()
- 67Mexico
- 53Albania
- 51Taiwan
- 49Bosnia and Herzegovina
- 49Cuba
- 47Guatemala
- 45Canada
- 40Singapore
- 39Peru
- 23Saudi Arabia
- 18Austria
- 14Serbia
- 14Hong Kong
- 12Cambodia
- 11Netherlands
- 1Korea
Grandparents responsible for own grandchildren in Grandville
Zip codes: 49418.