Races in Grants Pass, Oregon (OR) Detailed Stats
Data:
Races - White alone (%)
Races - White alone (% change since 2000)
Races - Black alone (%)
Races - Black alone (% change since 2000)
Races - American Indian alone (%)
Races - American Indian alone (% change since 2000)
Races - Asian alone (%)
Races - Asian alone (% change since 2000)
Races - Hispanic (%)
Races - Hispanic (% change since 2000)
Races - Native Hawaiian and Other Pacific Islander alone (%)
Races - Native Hawaiian and Other Pacific Islander alone (% change since 2000)
Races - Two or more races(%)
Races - Two or more races(% change since 2000)
Races - Other race alone (%)
Races - Other race alone (% change since 2000)
Racial diversity
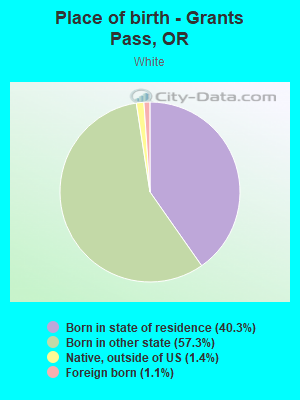
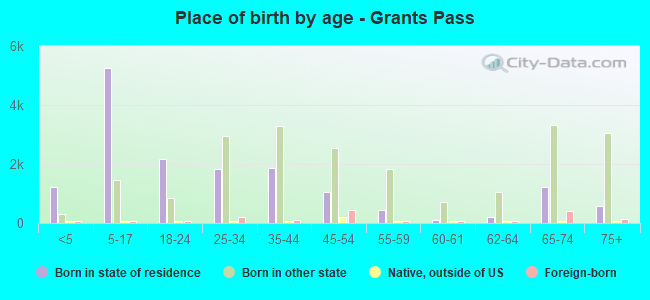
Place of birth - Born in state of residence (%)
Place of birth - Born in state of residence (%) - White
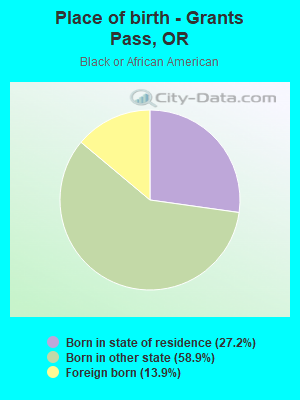
Place of birth - Born in state of residence (%) - Black or African American
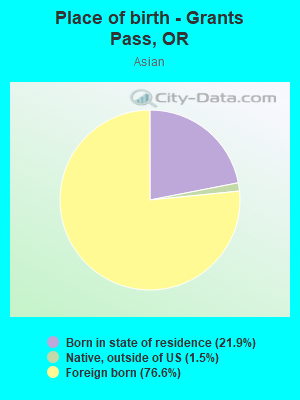
Place of birth - Born in state of residence (%) - Asian
Place of birth - Born in state of residence (%) - Hispanic or Latino
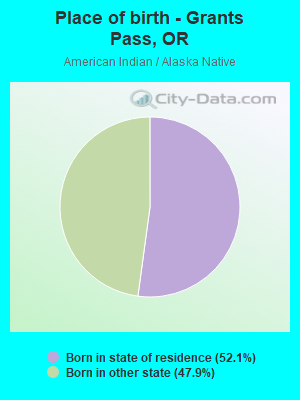
Place of birth - Born in state of residence (%) - American Indian and Alaska Native
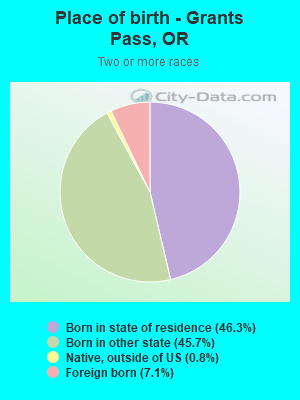
Place of birth - Born in state of residence (%) - Multirace
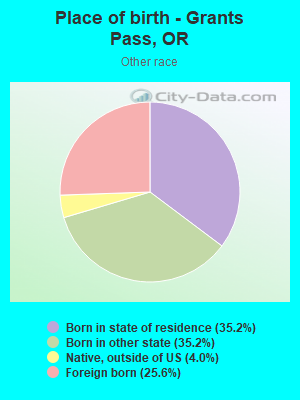
Place of birth - Born in state of residence (%) - Other Race
Place of birth - Born in other state (%)
Place of birth - Born in other state (%) - White
Place of birth - Born in other state (%) - Black or African American
Place of birth - Born in other state (%) - Asian
Place of birth - Born in other state (%) - Hispanic or Latino
Place of birth - Born in other state (%) - American Indian and Alaska Native
Place of birth - Born in other state (%) - Multirace
Place of birth - Born in other state (%) - Other Race
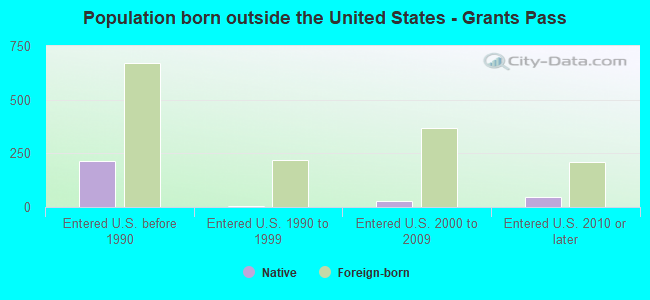
Place of birth - Native, outside of US (%)
Place of birth - Native, outside of US (%) - White
Place of birth - Native, outside of US (%) - Black or African American
Place of birth - Native, outside of US (%) - Asian
Place of birth - Native, outside of US (%) - Hispanic or Latino
Place of birth - Native, outside of US (%) - American Indian and Alaska Native
Place of birth - Native, outside of US (%) - Multirace
Place of birth - Native, outside of US (%) - Other Race
Place of birth - Foreign born (%)
Place of birth - Foreign born (%) - White
Place of birth - Foreign born (%) - Black or African American
Place of birth - Foreign born (%) - Asian
Place of birth - Foreign born (%) - Hispanic or Latino
Place of birth - Foreign born (%) - American Indian and Alaska Native
Place of birth - Foreign born (%) - Multirace
Place of birth - Foreign born (%) - Other Race
Residents speaking English at home (%)
Residents speaking English at home - Born in the United States (%)
Residents speaking English at home - Native, born elsewhere (%)
Residents speaking English at home - Foreign born (%)
Residents speaking Spanish at home (%)
Residents speaking Spanish at home - Born in the United States (%)
Residents speaking Spanish at home - Native, born elsewhere (%)
Residents speaking Spanish at home - Foreign born (%)
Residents speaking other language at home (%)
Residents speaking other language at home - Born in the United States (%)
Residents speaking other language at home - Native, born elsewhere (%)
Residents speaking other language at home - Foreign born (%)
Marital status - Never married (%)
Marital status - Now married (%)
Marital status - Separated (%)
Marital status - Widowed (%)
Marital status - Divorced (%)
Ancestries Reported - Arab (%)
Ancestries Reported - Czech (%)
Ancestries Reported - Danish (%)
Ancestries Reported - Dutch (%)
Ancestries Reported - English (%)
Ancestries Reported - French (%)
Ancestries Reported - French Canadian (%)
Ancestries Reported - German (%)
Ancestries Reported - Greek (%)
Ancestries Reported - Hungarian (%)
Ancestries Reported - Irish (%)
Ancestries Reported - Italian (%)
Ancestries Reported - Lithuanian (%)
Ancestries Reported - Norwegian (%)
Ancestries Reported - Polish (%)
Ancestries Reported - Portuguese (%)
Ancestries Reported - Russian (%)
Ancestries Reported - Scotch-Irish (%)
Ancestries Reported - Scottish (%)
Ancestries Reported - Slovak (%)
Ancestries Reported - Subsaharan African (%)
Ancestries Reported - Swedish (%)
Ancestries Reported - Swiss (%)
Ancestries Reported - Ukrainian (%)
Ancestries Reported - United States (%)
Ancestries Reported - Welsh (%)
Ancestries Reported - West Indian (%)
Ancestries Reported - Other (%)
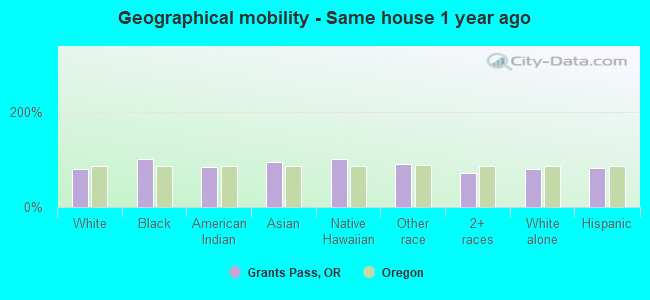
Geographical mobility - Same house 1 year ago (%)
Geographical mobility - Same house 1 year ago (%) - White
Geographical mobility - Same house 1 year ago (%) - Black or African American
Geographical mobility - Same house 1 year ago (%) - Asian
Geographical mobility - Same house 1 year ago (%) - Hispanic or Latino
Geographical mobility - Same house 1 year ago (%) - American Indian and Alaska Native
Geographical mobility - Same house 1 year ago (%) - Multirace
Geographical mobility - Same house 1 year ago (%) - Other Race
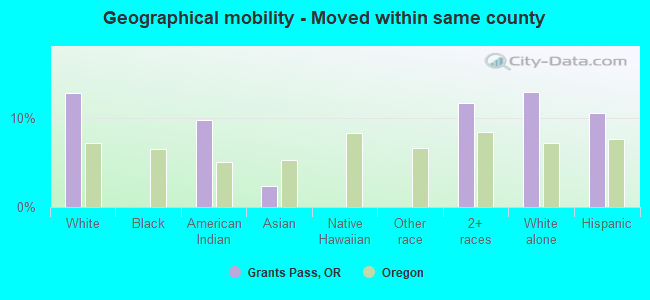
Geographical mobility - Moved within same county (%)
Geographical mobility - Moved within same county (%) - White
Geographical mobility - Moved within same county (%) - Black or African American
Geographical mobility - Moved within same county (%) - Asian
Geographical mobility - Moved within same county (%) - Hispanic or Latino
Geographical mobility - Moved within same county (%) - American Indian and Alaska Native
Geographical mobility - Moved within same county (%) - Multirace
Geographical mobility - Moved within same county (%) - Other Race
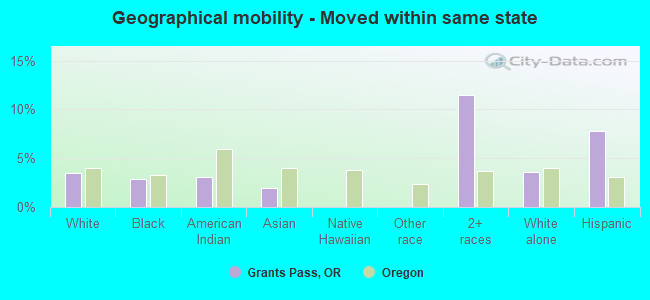
Geographical mobility - Moved from different county within same state (%)
Geographical mobility - Moved from different county within same state (%) - White
Geographical mobility - Moved from different county within same state (%) - Black or African American
Geographical mobility - Moved from different county within same state (%) - Asian
Geographical mobility - Moved from different county within same state (%) - Hispanic or Latino
Geographical mobility - Moved from different county within same state (%) - American Indian and Alaska Native
Geographical mobility - Moved from different county within same state (%) - Multirace
Geographical mobility - Moved from different county within same state (%) - Other Race
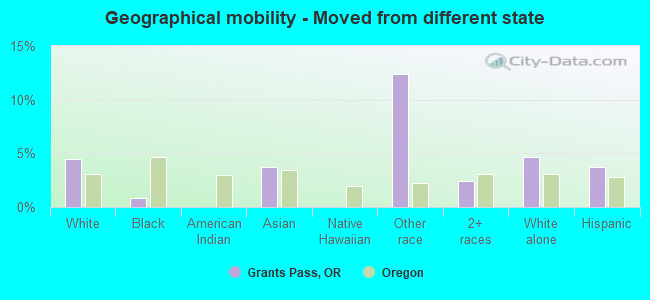
Geographical mobility - Moved from different state (%)
Geographical mobility - Moved from different state (%) - White
Geographical mobility - Moved from different state (%) - Black or African American
Geographical mobility - Moved from different state (%) - Asian
Geographical mobility - Moved from different state (%) - Hispanic or Latino
Geographical mobility - Moved from different state (%) - American Indian and Alaska Native
Geographical mobility - Moved from different state (%) - Multirace
Geographical mobility - Moved from different state (%) - Other Race
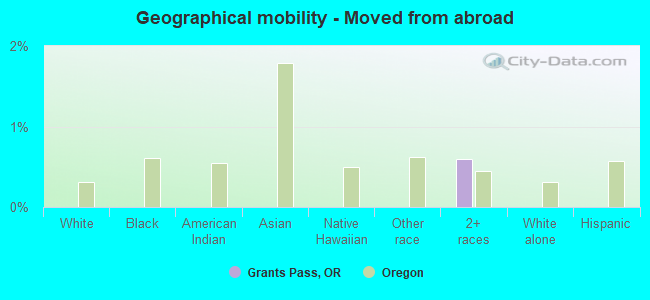
Geographical mobility - Moved from abroad (%)
Geographical mobility - Moved from abroad (%) - White
Geographical mobility - Moved from abroad (%) - Black or African American
Geographical mobility - Moved from abroad (%) - Asian
Geographical mobility - Moved from abroad (%) - Hispanic or Latino
Geographical mobility - Moved from abroad (%) - American Indian and Alaska Native
Geographical mobility - Moved from abroad (%) - Multirace
Geographical mobility - Moved from abroad (%) - Other Race
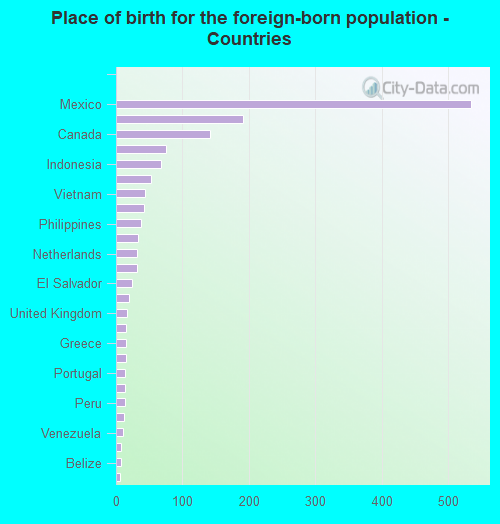
Place of birth for the foreign-born population - Ireland (%)
Place of birth for the foreign-born population - Denmark (%)
Place of birth for the foreign-born population - Norway (%)
Place of birth for the foreign-born population - Sweden (%)
Place of birth for the foreign-born population - United Kingdom (%)
Place of birth for the foreign-born population - England (%)
Place of birth for the foreign-born population - Scotland (%)
Place of birth for the foreign-born population - Other Northern Europe (%)
Place of birth for the foreign-born population - Austria (%)
Place of birth for the foreign-born population - Belgium (%)
Place of birth for the foreign-born population - France (%)
Place of birth for the foreign-born population - Germany (%)
Place of birth for the foreign-born population - Netherlands (%)
Place of birth for the foreign-born population - Switzerland (%)
Place of birth for the foreign-born population - Other Western Europe (%)
Place of birth for the foreign-born population - Greece (%)
Place of birth for the foreign-born population - Italy (%)
Place of birth for the foreign-born population - Portugal (%)
Place of birth for the foreign-born population - Spain (%)
Place of birth for the foreign-born population - Other Southern Europe (%)
Place of birth for the foreign-born population - Albania (%)
Place of birth for the foreign-born population - Belarus (%)
Place of birth for the foreign-born population - Bosnia and Herzegovina (%)
Place of birth for the foreign-born population - Bulgaria (%)
Place of birth for the foreign-born population - Croatia (%)
Place of birth for the foreign-born population - Czechoslovakia (%)
Place of birth for the foreign-born population - Hungary (%)
Place of birth for the foreign-born population - Latvia (%)
Place of birth for the foreign-born population - Lithuania (%)
Place of birth for the foreign-born population - North Macedonia (Macedonia) (%)
Place of birth for the foreign-born population - Moldova (%)
Place of birth for the foreign-born population - Poland (%)
Place of birth for the foreign-born population - Romania (%)
Place of birth for the foreign-born population - Russia (%)
Place of birth for the foreign-born population - Serbia (%)
Place of birth for the foreign-born population - Ukraine (%)
Place of birth for the foreign-born population - Other Eastern Europe (%)
Place of birth for the foreign-born population - China (%)
Place of birth for the foreign-born population - Hong Kong (%)
Place of birth for the foreign-born population - Taiwan (%)
Place of birth for the foreign-born population - Japan (%)
Place of birth for the foreign-born population - Korea (%)
Place of birth for the foreign-born population - Other Eastern Asia (%)
Place of birth for the foreign-born population - Afghanistan (%)
Place of birth for the foreign-born population - Bangladesh (%)
Place of birth for the foreign-born population - India (%)
Place of birth for the foreign-born population - Iran (%)
Place of birth for the foreign-born population - Kazakhstan (%)
Place of birth for the foreign-born population - Nepal (%)
Place of birth for the foreign-born population - Pakistan (%)
Place of birth for the foreign-born population - Sri Lanka (%)
Place of birth for the foreign-born population - Uzbekistan (%)
Place of birth for the foreign-born population - Other South Central Asia (%)
Place of birth for the foreign-born population - Burma (%)
Place of birth for the foreign-born population - Cambodia (%)
Place of birth for the foreign-born population - Indonesia (%)
Place of birth for the foreign-born population - Laos (%)
Place of birth for the foreign-born population - Malaysia (%)
Place of birth for the foreign-born population - Philippines (%)
Place of birth for the foreign-born population - Singapore (%)
Place of birth for the foreign-born population - Thailand (%)
Place of birth for the foreign-born population - Vietnam (%)
Place of birth for the foreign-born population - Other South Eastern Asia (%)
Place of birth for the foreign-born population - Armenia (%)
Place of birth for the foreign-born population - Iraq (%)
Place of birth for the foreign-born population - Israel (%)
Place of birth for the foreign-born population - Jordan (%)
Place of birth for the foreign-born population - Kuwait (%)
Place of birth for the foreign-born population - Lebanon (%)
Place of birth for the foreign-born population - Saudi Arabia (%)
Place of birth for the foreign-born population - Syria (%)
Place of birth for the foreign-born population - Turkey (%)
Place of birth for the foreign-born population - Yemen (%)
Place of birth for the foreign-born population - Other Western Asia (%)
Place of birth for the foreign-born population - Eritrea (%)
Place of birth for the foreign-born population - Ethiopia (%)
Place of birth for the foreign-born population - Kenya (%)
Place of birth for the foreign-born population - Somalia (%)
Place of birth for the foreign-born population - Uganda (%)
Place of birth for the foreign-born population - Zimbabwe (%)
Place of birth for the foreign-born population - Other Eastern Africa (%)
Place of birth for the foreign-born population - Cameroon (%)
Place of birth for the foreign-born population - Congo (%)
Place of birth for the foreign-born population - Democratic Republic of Congo (Zaire) (%)
Place of birth for the foreign-born population - Other Middle Africa (%)
Place of birth for the foreign-born population - Egypt (%)
Place of birth for the foreign-born population - Morocco (%)
Place of birth for the foreign-born population - Sudan (%)
Place of birth for the foreign-born population - Other Northern Africa (%)
Place of birth for the foreign-born population - South Africa (%)
Place of birth for the foreign-born population - Other Southern Africa (%)
Place of birth for the foreign-born population - Cabo Verde (%)
Place of birth for the foreign-born population - Ghana (%)
Place of birth for the foreign-born population - Liberia (%)
Place of birth for the foreign-born population - Nigeria (%)
Place of birth for the foreign-born population - Senegal (%)
Place of birth for the foreign-born population - Sierra Leone (%)
Place of birth for the foreign-born population - Other Western Africa (%)
Place of birth for the foreign-born population - Australia (%)
Place of birth for the foreign-born population - New Zealand (%)
Place of birth for the foreign-born population - Fiji (%)
Place of birth for the foreign-born population - Micronesia (%)
Place of birth for the foreign-born population - Bahamas (%)
Place of birth for the foreign-born population - Barbados (%)
Place of birth for the foreign-born population - Cuba (%)
Place of birth for the foreign-born population - Dominica (%)
Place of birth for the foreign-born population - Dominican Republic (%)
Place of birth for the foreign-born population - Grenada (%)
Place of birth for the foreign-born population - Haiti (%)
Place of birth for the foreign-born population - Jamaica (%)
Place of birth for the foreign-born population - St. Vincent and the Grenadines (%)
Place of birth for the foreign-born population - Trinidad and Tobago (%)
Place of birth for the foreign-born population - West Indies (%)
Place of birth for the foreign-born population - Other Caribbean (%)
Place of birth for the foreign-born population - Belize (%)
Place of birth for the foreign-born population - Costa Rica (%)
Place of birth for the foreign-born population - El Salvador (%)
Place of birth for the foreign-born population - Guatemala (%)
Place of birth for the foreign-born population - Honduras (%)
Place of birth for the foreign-born population - Mexico (%)
Place of birth for the foreign-born population - Nicaragua (%)
Place of birth for the foreign-born population - Panama (%)
Place of birth for the foreign-born population - Other Central America (%)
Place of birth for the foreign-born population - Argentina (%)
Place of birth for the foreign-born population - Bolivia (%)
Place of birth for the foreign-born population - Brazil (%)
Place of birth for the foreign-born population - Chile (%)
Place of birth for the foreign-born population - Colombia (%)
Place of birth for the foreign-born population - Ecuador (%)
Place of birth for the foreign-born population - Guyana (%)
Place of birth for the foreign-born population - Peru (%)
Place of birth for the foreign-born population - Uruguay (%)
Place of birth for the foreign-born population - Venezuela (%)
Place of birth for the foreign-born population - Other South America (%)
Place of birth for the foreign-born population - Canada (%)
Place of birth for the foreign-born population - Other Northern America (%)
Place of birth for the foreign-born population - Other (%)
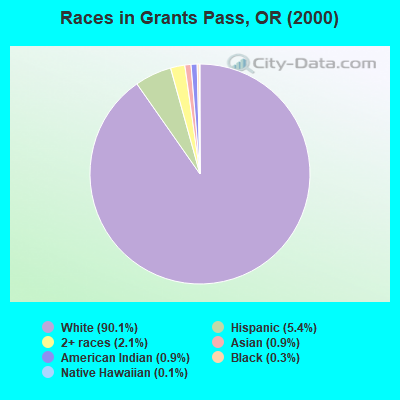
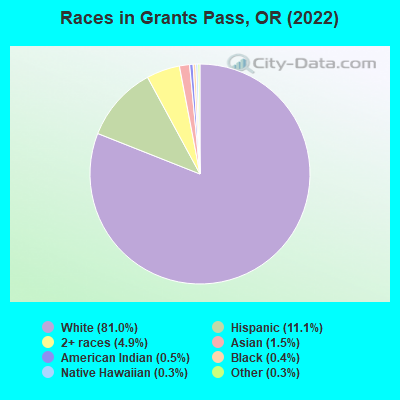
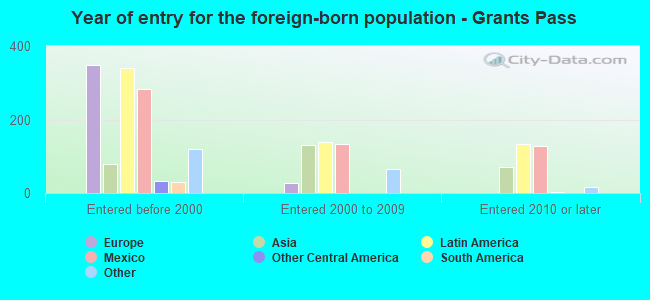
According to 2022 data, the most numerous races in Grants Pass, OR are White alone (31,609 residents), Hispanic (4,329 residents), and Two or more races (1,925 residents). 95.0% of Grants Pass residents speak English at home. 3.9% of Grants Pass, OR residents are foreign-born (1.5% born in Latin America, 1.0% born in Europe, 0.7% born in Asia), which is 132.7% less than the foreign-born rate of 9.0% across the entire state of Oregon.
Race distribution in Grants Pass
2000 2022
2,857,616 83.5% White alone 275,314 8.0% Hispanic 100,333 2.9% Asian alone 82,733 2.4% Two or more races 53,325 1.6% Black alone 40,130 1.2% American Indian alone 7,398 0.2% Native Hawaiian and Other 4,550 0.1% Other race alone
3,037,571 71.6% White alone 609,538 14.4% Hispanic 252,744 6.0% Two or more races 191,283 4.5% Asian alone 78,228 1.8% Black alone 29,399 0.7% American Indian alone 25,731 0.6% Other race alone 15,643 0.4% Native Hawaiian and Other
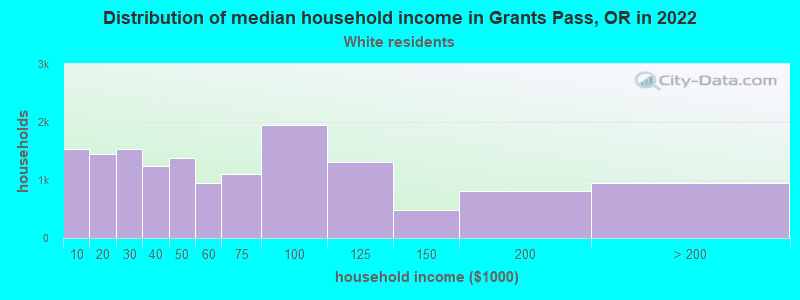
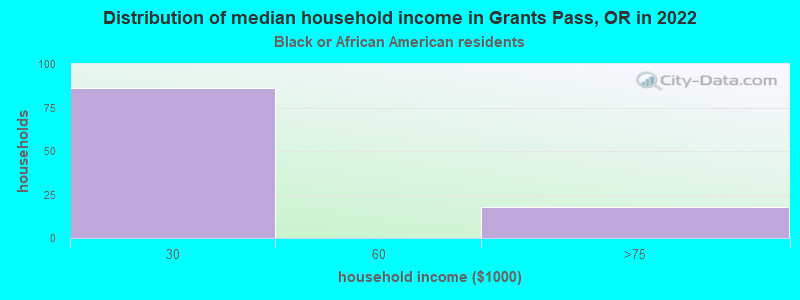
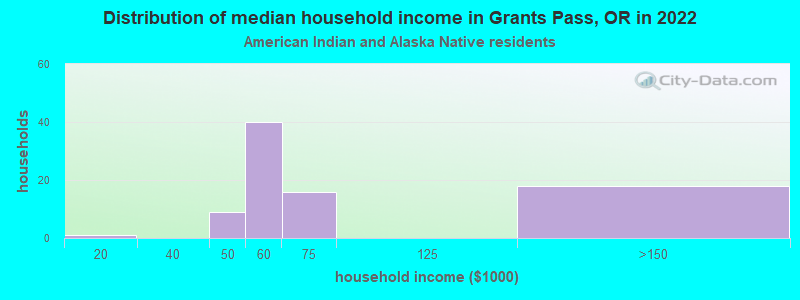
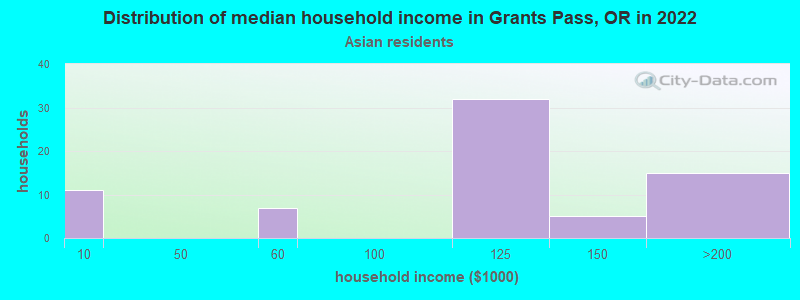
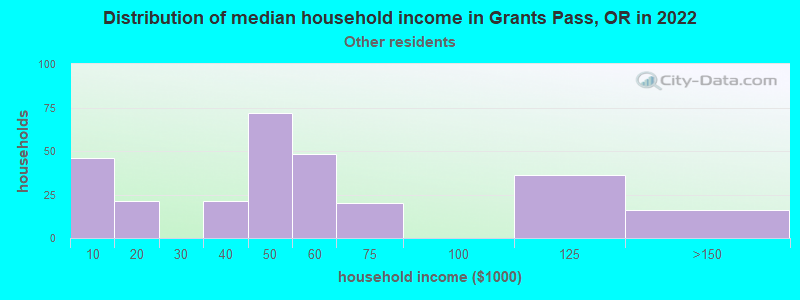
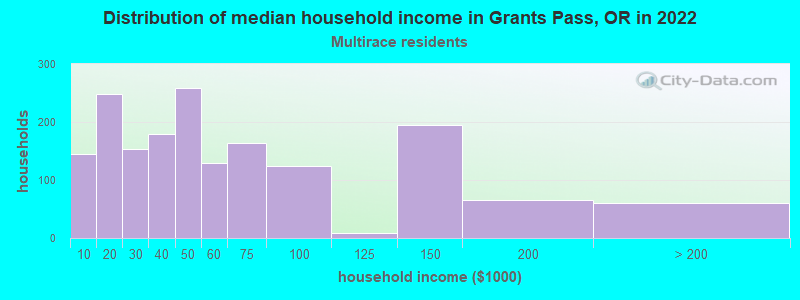
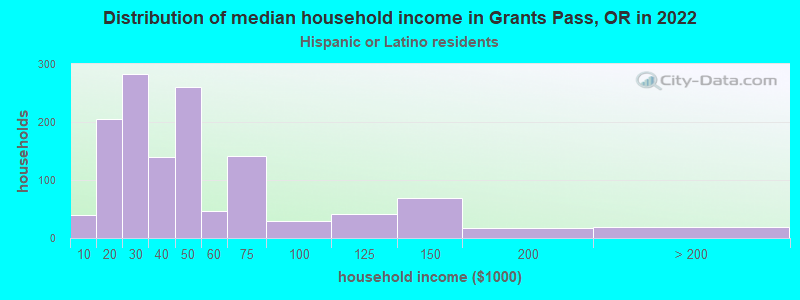
Income and house value in Grants Pass Median household income in 2022 $53,002 White non-Hispanic householders$25,205 Black householders$52,024 American Indian and Alaska Native householders$115,739 Asian householders$41,104 Some other race householders$40,161 Two or more races householders$36,343 Hispanic or Latino race householdersMedian 2022 house value $385,799 White Non-Hispanic householders$218,863 American Indian or Alaska Native householders $466,653 Asian householders$392,072 Some other race householders$490,003 Two or more races householders$485,821 Hispanic or Latino householders
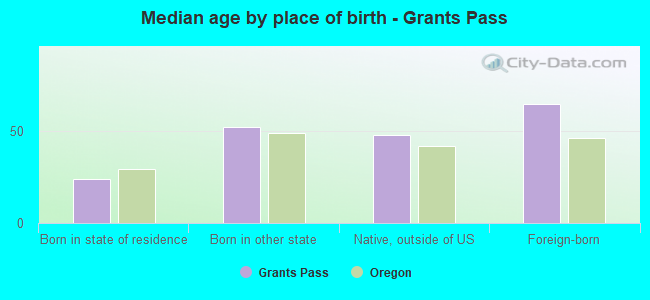
Median age by race in Grants Pass
42.9 Median age for White residents40.1 44.3 53.4 Median age for Black or African American residents76.5 36.7 40.3 Median age for American Indian / Alaska Native residents31.7 42.4 50.8 Median age for Asian residents57.4 49.2 16.1 Median age for Native Hawaiian / Pacific Islander residents-764,119,600.6 16.0 36.1 Median age for Other race residents35.1 48.1 34.5 Median age for Two or more races residents34.1 34.1 42.9 Median age for White alone residents40.3 44.8 39.8 Median age for Hispanic or Latino residents39.3 43.1
Owner/renter occupied households by race in Grants Pass
House owners and renters - White residents 8,233 55.3% Owner occupied6,647 44.7% Renter occupiedHouse owners and renters - Black or African American residents 37 33.1% Owner occupied76 66.9% Renter occupiedHouse owners and renters - American Indian / Alaska Native residents 57 61.2% Owner occupied36 38.8% Renter occupiedHouse owners and renters - Asian residents 9 12.2% Owner occupied62 87.8% Renter occupiedHouse owners and renters - Other race residents 96 34.6% Owner occupied181 65.4% Renter occupiedHouse owners and renters - Two or more races residents 654 50.2% Owner occupied648 49.8% Renter occupiedHouse owners and renters - White alone residents 8,079 55.2% Owner occupied6,560 44.8% Renter occupiedHouse owners and renters - Hispanic or Latino residents 650 62.1% Owner occupied397 37.9% Renter occupied
Language usage in Grants Pass
English speakers - Total 95.0% of residents of Grants Pass speak English at home.
3.9% of residents speak Spanish at home 901 61.4% Speak English very well566 38.6% Speak English less than very well1.1% of residents speak other language at home 224 55.3% Speak English very well181 44.7% Speak English less than very well
English speakers - Born in the United States 97.1% of residents of Grants Pass speak English at home.
2.7% of residents speak Spanish at home 507 85.9% Speak English very well83 14.1% Speak English less than very well0.1% of residents speak other language at home 29 100.0% Speak English very well
All residents speak only English at home
English speakers - Foreign-born 46.8% of residents of Grants Pass speak English at home.
34.4% of residents speak Spanish at home 95 18.3% Speak English very well425 81.7% Speak English less than very well20.5% of residents speak other language at home 130 41.9% Speak English very well180 58.1% Speak English less than very well
White (Caucasian) - Speak only English Native:
97.7% (30,252)Foreign-born:
84.4% (296)
White (Caucasian) - Speak another language Native:
2.3% (700)Foreign-born:
39.9% (140)
Black or African American - Speak only English Native:
99.5% (194)Foreign-born:
100.0% (32)
Asian - Speak only English Native:
100.0% (108)Foreign-born:
33.2% (112)
Other race - Speak only English Native:
74.1% (357)Foreign-born:
27.4% (78)
Other race - Speak another language Native:
30.0% (145)Foreign-born:
72.4% (205)
Two or more races - Speak only English Native:
89.0% (3,719)Foreign-born:
11.3% (38)
Two or more races - Speak another language Native:
10.2% (427)Foreign-born:
88.7% (297)
White alone - Speak only English Native:
98.1% (29,265)Foreign-born:
88.2% (317)
White alone - Speak another language Native:
1.6% (478)Foreign-born:
13.5% (49)
Hispanic or Latino - Speak only English Native:
84.9% (2,845)Foreign-born:
16.3% (100)
Hispanic or Latino - Speak another language Native:
17.4% (583)Foreign-born:
84.4% (517)
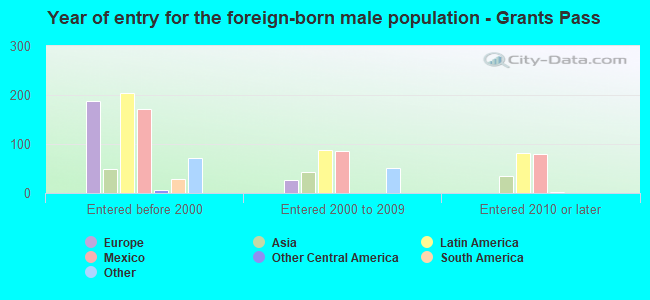
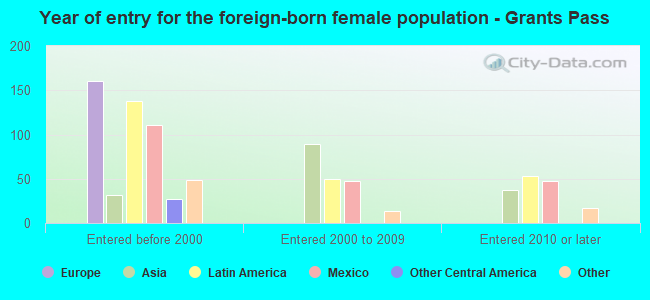
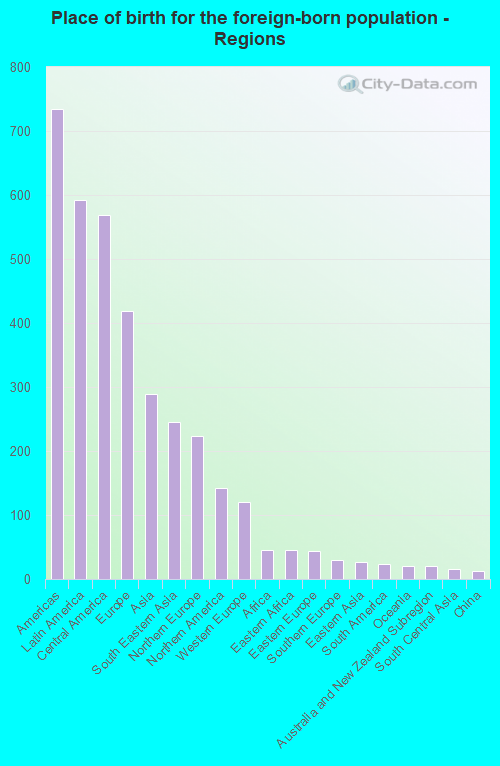
Foreign-born residents in Grants Pass 1,509 residents are foreign born (1.5% Latin America , 1.0% Europe , 0.7% Asia ).
This city:
3.9%Oregon:
9.8%
Marital status for residents in Grants Pass Marital status - White (Caucasian) population 15 years and over
Males 34.5% Never married48.2% Now married1.0% Separated5.2% Widowed11.0% DivorcedFemales 27.4% Never married42.3% Now married1.7% Separated9.6% Widowed19.0% DivorcedWomen who gave birth in the past 12 months Now married:
71.8% (251)Unmarried:
28.2% (99)
Women who did not give birth in the past 12 months Now married:
38.8% (2,796)Unmarried:
61.2% (4,414)
Marital status - Black or African American population 15 years and over
Males 63.5% Never married6.0% Now married0.0% Separated0.0% Widowed30.5% DivorcedFemales 65.0% Never married0.0% Now married0.0% Separated0.0% Widowed35.0% DivorcedWomen who did not give birth in the past 12 months Now married:
0.0% (0)Unmarried:
100.0% (28)
Marital status - American Indian / Alaska Native population 15 years and over
Males 21.8% Never married77.3% Now married0.0% Separated0.0% Widowed0.8% DivorcedFemales 0.0% Never married84.4% Now married15.6% Separated0.0% Widowed0.0% DivorcedWomen who did not give birth in the past 12 months Now married:
100.0% (9)Unmarried:
0.0% (0)
Marital status - Asian population 15 years and over
Males 8.6% Never married60.9% Now married0.0% Separated30.5% Widowed0.0% DivorcedFemales 16.8% Never married45.5% Now married15.2% Separated0.0% Widowed22.5% DivorcedWomen who did not give birth in the past 12 months Now married:
43.4% (37)Unmarried:
56.6% (49)
Marital status - Native Hawaiian / Pacific Islander population 15 years and over
Males 100.0% Never married0.0% Now married0.0% Separated0.0% Widowed0.0% DivorcedFemales 0.0% Never married100.0% Now married0.0% Separated0.0% Widowed0.0% DivorcedMarital status - Other race population 15 years and over
Males 19.0% Never married63.3% Now married0.0% Separated0.0% Widowed17.7% DivorcedFemales 0.0% Never married76.2% Now married0.0% Separated15.0% Widowed8.8% DivorcedWomen who did not give birth in the past 12 months Now married:
100.0% (124)Unmarried:
0.0% (0)
Marital status - Two or more races population 15 years and over
Males 38.4% Never married32.0% Now married4.6% Separated1.8% Widowed23.3% DivorcedFemales 29.6% Never married33.4% Now married8.9% Separated13.2% Widowed14.9% DivorcedWomen who gave birth in the past 12 months Now married:
100.0% (9)Unmarried:
0.0% (0)
Women who did not give birth in the past 12 months Now married:
41.0% (413)Unmarried:
59.0% (593)
Marital status - White alone, not Hispanic / Latino population 15 years and over
Males 32.6% Never married49.5% Now married1.0% Separated5.4% Widowed11.5% DivorcedFemales 26.2% Never married42.9% Now married1.7% Separated9.7% Widowed19.5% DivorcedWomen who gave birth in the past 12 months Now married:
71.2% (249)Unmarried:
28.8% (100)
Women who did not give birth in the past 12 months Now married:
39.8% (2,703)Unmarried:
60.2% (4,091)
Marital status - Hispanic or Latino population 15 years and over
Males 49.8% Never married34.8% Now married0.0% Separated2.1% Widowed13.4% DivorcedFemales 37.7% Never married34.0% Now married6.4% Separated11.2% Widowed10.8% DivorcedWomen who gave birth in the past 12 months Now married:
100.0% (7)Unmarried:
0.0% (0)
Women who did not give birth in the past 12 months Now married:
42.9% (423)Unmarried:
57.1% (562)
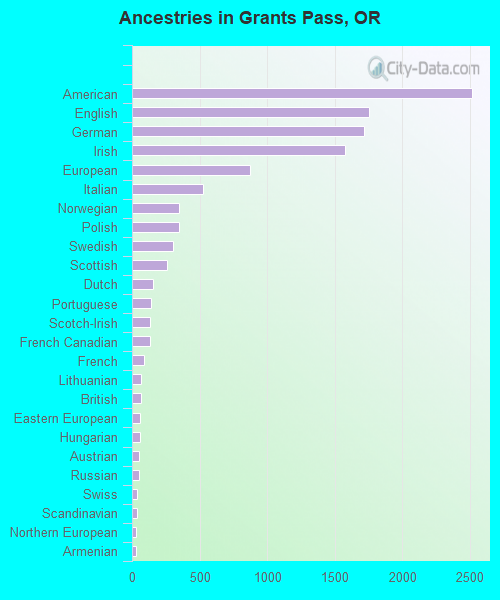
Ancestries in Grants Pass
2,518 16.5% American1,758 11.5% English1,721 11.3% German1,576 10.3% Irish873 5.7% European527 3.5% Italian349 2.3% Norwegian347 2.3% Polish302 2.0% Swedish260 1.7% Scottish158 1.0% Dutch138 0.9% Portuguese135 0.9% Scotch-Irish135 0.9% French Canadian91 0.6% French64 0.4% Lithuanian63 0.4% British61 0.4% Eastern European58 0.4% Hungarian52 0.3% Austrian49 0.3% Russian36 0.2% Swiss35 0.2% Scandinavian32 0.2% Northern European32 0.2% Armenian27 0.2% Danish21 0.1% Welsh20 0.1% African17 0.1% Canadian14 0.09% Finnish12 0.08% Estonian11 0.07% Lebanese8 0.05% Romanian6 0.04% Czech5 0.03% South African
Geographical mobility in Grants Pass Same house 1 year ago 25,765 80.2% White (Caucasian)227 100.0% Black or African American153 82.6% American Indian / Alaska Native420 93.7% Asian110 100.0% Native Hawaiian / Pacific Islander781 90.9% Other race3,452 72.0% Two or more races24,886 79.9% White alone, not Hispanic / Latino3,561 81.9% Hispanic or LatinoMoved within same county 4,108 12.8% White / Caucasian18 9.7% American Indian / Alaska Native10 2.3% Asian555 11.6% Two or more races3,998 12.8% White alone, not Hispanic / Latino456 10.5% Hispanic or LatinoMoved within same state 1,114 3.5% White / Caucasian7 2.9% Black or African American6 3.1% American Indian / Alaska Native9 1.9% Asian551 11.5% Two or more races1,104 3.5% White alone, not Hispanic / Latino341 7.8% Hispanic or LatinoMoved from different state 1,440 4.5% White / Caucasian2 0.9% Black or African American17 3.8% Asian106 12.4% Other race114 2.4% Two or more races1,454 4.7% White alone, not Hispanic / Latino164 3.8% Hispanic or LatinoMoved from abroad 29 0.6% Two or more races
Children Nativity (place of birth) in Grants Pass
Children under 6 years - Living with two parents Both parents native 1,011 100.0% NativeBoth parents foreign-born 73 100.0% NativeOne native, one foreign-born parent 14 100.0% NativeChildren under 6 years - Living with one parent Native parent 830 100.0% NativeChildren 6 to 17 years - Living with two parents Both parents native 2,840 100.0% NativeBoth parents foreign-born 40 61.5% Native25 38.5% Foreign-bornOne native, one foreign-born parent 533 100.0% NativeChildren 6 to 17 years - Living with one parent Native parent 2,198 100.0% NativeForeign-born parent 41 50.1% Native40 49.9% Foreign-born
Grandparents responsible for own grandchildren in Grants Pass
Grandparents (30 to 59 years) White / Caucasian 39 49.0% Responsible for grandchildren41 51.0% Not responsible for grandchildrenTwo or more races 43 100.0% Not responsible for grandchildrenWhite alone, not Hispanic / Latino 41 46.5% Responsible for grandchildren47 53.5% Not responsible for grandchildrenGrandparents (60 years and over) White / Caucasian 104 42.2% Responsible for grandchildren142 57.8% Not responsible for grandchildrenTwo or more races 4 11.9% Responsible for grandchildren32 88.1% Not responsible for grandchildrenWhite alone, not Hispanic / Latino 108 42.0% Responsible for grandchildren150 58.0% Not responsible for grandchildren