Races in Great Bend, Kansas (KS) Detailed Stats
Data:
Races - White alone (%)
Races - White alone (% change since 2000)
Races - Black alone (%)
Races - Black alone (% change since 2000)
Races - American Indian alone (%)
Races - American Indian alone (% change since 2000)
Races - Asian alone (%)
Races - Asian alone (% change since 2000)
Races - Hispanic (%)
Races - Hispanic (% change since 2000)
Races - Native Hawaiian and Other Pacific Islander alone (%)
Races - Native Hawaiian and Other Pacific Islander alone (% change since 2000)
Races - Two or more races(%)
Races - Two or more races(% change since 2000)
Races - Other race alone (%)
Races - Other race alone (% change since 2000)
Racial diversity
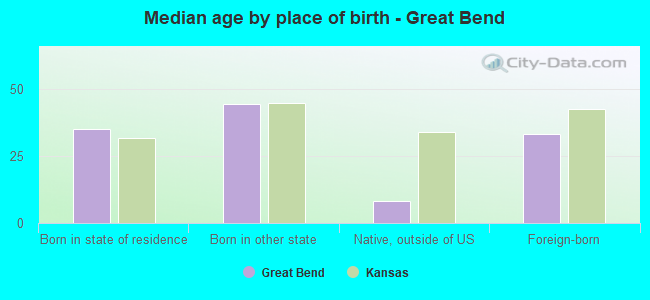
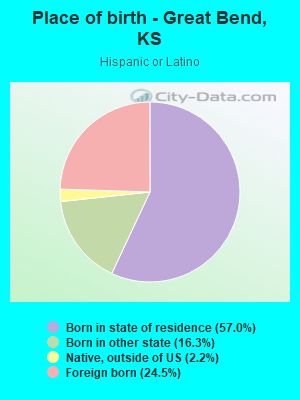
Place of birth - Born in state of residence (%)
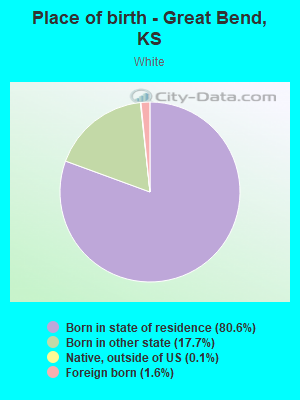
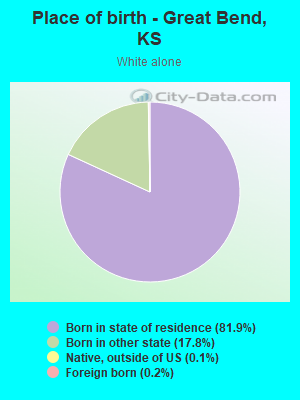
Place of birth - Born in state of residence (%) - White
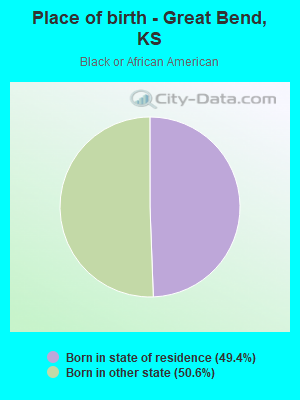
Place of birth - Born in state of residence (%) - Black or African American
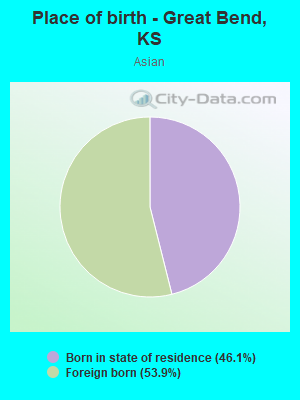
Place of birth - Born in state of residence (%) - Asian
Place of birth - Born in state of residence (%) - Hispanic or Latino
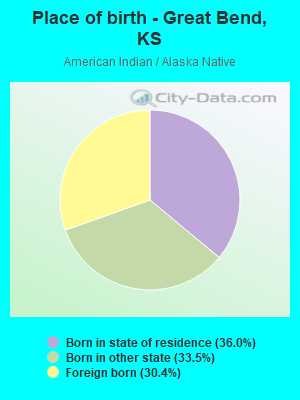
Place of birth - Born in state of residence (%) - American Indian and Alaska Native
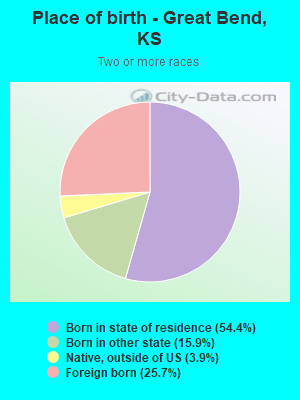
Place of birth - Born in state of residence (%) - Multirace
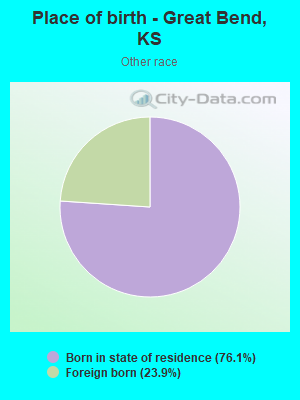
Place of birth - Born in state of residence (%) - Other Race
Place of birth - Born in other state (%)
Place of birth - Born in other state (%) - White
Place of birth - Born in other state (%) - Black or African American
Place of birth - Born in other state (%) - Asian
Place of birth - Born in other state (%) - Hispanic or Latino
Place of birth - Born in other state (%) - American Indian and Alaska Native
Place of birth - Born in other state (%) - Multirace
Place of birth - Born in other state (%) - Other Race
Place of birth - Native, outside of US (%)
Place of birth - Native, outside of US (%) - White
Place of birth - Native, outside of US (%) - Black or African American
Place of birth - Native, outside of US (%) - Asian
Place of birth - Native, outside of US (%) - Hispanic or Latino
Place of birth - Native, outside of US (%) - American Indian and Alaska Native
Place of birth - Native, outside of US (%) - Multirace
Place of birth - Native, outside of US (%) - Other Race
Place of birth - Foreign born (%)
Place of birth - Foreign born (%) - White
Place of birth - Foreign born (%) - Black or African American
Place of birth - Foreign born (%) - Asian
Place of birth - Foreign born (%) - Hispanic or Latino
Place of birth - Foreign born (%) - American Indian and Alaska Native
Place of birth - Foreign born (%) - Multirace
Place of birth - Foreign born (%) - Other Race
Residents speaking English at home (%)
Residents speaking English at home - Born in the United States (%)
Residents speaking English at home - Native, born elsewhere (%)
Residents speaking English at home - Foreign born (%)
Residents speaking Spanish at home (%)
Residents speaking Spanish at home - Born in the United States (%)
Residents speaking Spanish at home - Native, born elsewhere (%)
Residents speaking Spanish at home - Foreign born (%)
Residents speaking other language at home (%)
Residents speaking other language at home - Born in the United States (%)
Residents speaking other language at home - Native, born elsewhere (%)
Residents speaking other language at home - Foreign born (%)
Marital status - Never married (%)
Marital status - Now married (%)
Marital status - Separated (%)
Marital status - Widowed (%)
Marital status - Divorced (%)
Ancestries Reported - Arab (%)
Ancestries Reported - Czech (%)
Ancestries Reported - Danish (%)
Ancestries Reported - Dutch (%)
Ancestries Reported - English (%)
Ancestries Reported - French (%)
Ancestries Reported - French Canadian (%)
Ancestries Reported - German (%)
Ancestries Reported - Greek (%)
Ancestries Reported - Hungarian (%)
Ancestries Reported - Irish (%)
Ancestries Reported - Italian (%)
Ancestries Reported - Lithuanian (%)
Ancestries Reported - Norwegian (%)
Ancestries Reported - Polish (%)
Ancestries Reported - Portuguese (%)
Ancestries Reported - Russian (%)
Ancestries Reported - Scotch-Irish (%)
Ancestries Reported - Scottish (%)
Ancestries Reported - Slovak (%)
Ancestries Reported - Subsaharan African (%)
Ancestries Reported - Swedish (%)
Ancestries Reported - Swiss (%)
Ancestries Reported - Ukrainian (%)
Ancestries Reported - United States (%)
Ancestries Reported - Welsh (%)
Ancestries Reported - West Indian (%)
Ancestries Reported - Other (%)
Geographical mobility - Same house 1 year ago (%)
Geographical mobility - Same house 1 year ago (%) - White
Geographical mobility - Same house 1 year ago (%) - Black or African American
Geographical mobility - Same house 1 year ago (%) - Asian
Geographical mobility - Same house 1 year ago (%) - Hispanic or Latino
Geographical mobility - Same house 1 year ago (%) - American Indian and Alaska Native
Geographical mobility - Same house 1 year ago (%) - Multirace
Geographical mobility - Same house 1 year ago (%) - Other Race
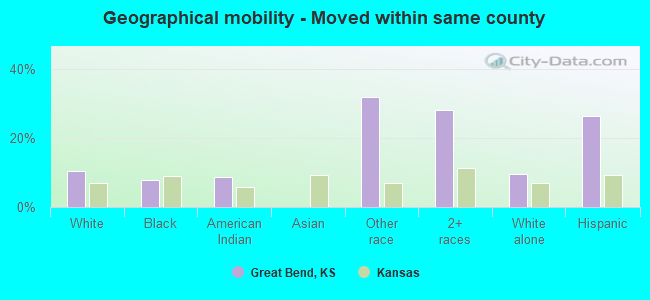
Geographical mobility - Moved within same county (%)
Geographical mobility - Moved within same county (%) - White
Geographical mobility - Moved within same county (%) - Black or African American
Geographical mobility - Moved within same county (%) - Asian
Geographical mobility - Moved within same county (%) - Hispanic or Latino
Geographical mobility - Moved within same county (%) - American Indian and Alaska Native
Geographical mobility - Moved within same county (%) - Multirace
Geographical mobility - Moved within same county (%) - Other Race
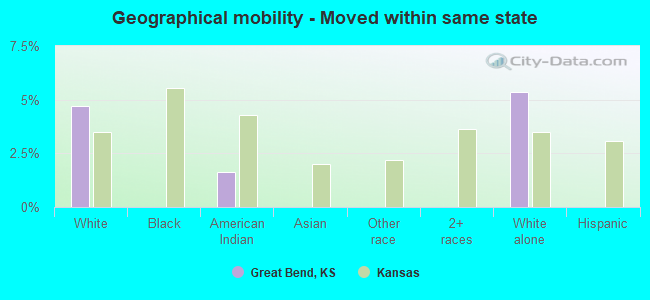
Geographical mobility - Moved from different county within same state (%)
Geographical mobility - Moved from different county within same state (%) - White
Geographical mobility - Moved from different county within same state (%) - Black or African American
Geographical mobility - Moved from different county within same state (%) - Asian
Geographical mobility - Moved from different county within same state (%) - Hispanic or Latino
Geographical mobility - Moved from different county within same state (%) - American Indian and Alaska Native
Geographical mobility - Moved from different county within same state (%) - Multirace
Geographical mobility - Moved from different county within same state (%) - Other Race
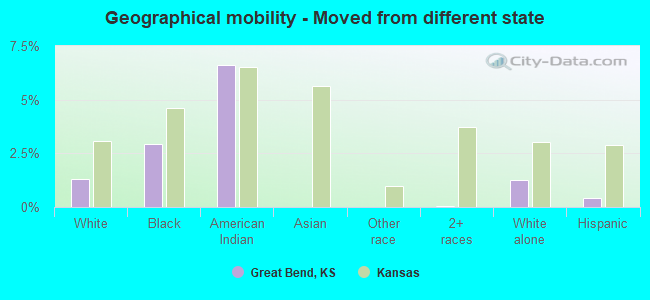
Geographical mobility - Moved from different state (%)
Geographical mobility - Moved from different state (%) - White
Geographical mobility - Moved from different state (%) - Black or African American
Geographical mobility - Moved from different state (%) - Asian
Geographical mobility - Moved from different state (%) - Hispanic or Latino
Geographical mobility - Moved from different state (%) - American Indian and Alaska Native
Geographical mobility - Moved from different state (%) - Multirace
Geographical mobility - Moved from different state (%) - Other Race
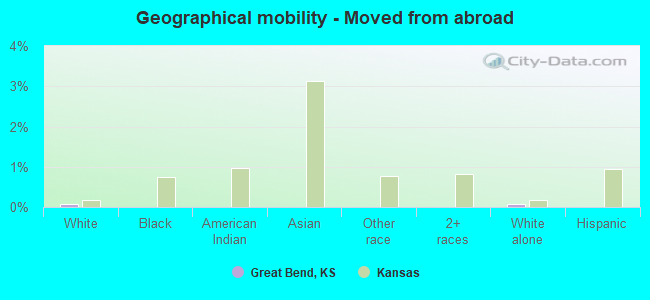
Geographical mobility - Moved from abroad (%)
Geographical mobility - Moved from abroad (%) - White
Geographical mobility - Moved from abroad (%) - Black or African American
Geographical mobility - Moved from abroad (%) - Asian
Geographical mobility - Moved from abroad (%) - Hispanic or Latino
Geographical mobility - Moved from abroad (%) - American Indian and Alaska Native
Geographical mobility - Moved from abroad (%) - Multirace
Geographical mobility - Moved from abroad (%) - Other Race
Place of birth for the foreign-born population - Ireland (%)
Place of birth for the foreign-born population - Denmark (%)
Place of birth for the foreign-born population - Norway (%)
Place of birth for the foreign-born population - Sweden (%)
Place of birth for the foreign-born population - United Kingdom (%)
Place of birth for the foreign-born population - England (%)
Place of birth for the foreign-born population - Scotland (%)
Place of birth for the foreign-born population - Other Northern Europe (%)
Place of birth for the foreign-born population - Austria (%)
Place of birth for the foreign-born population - Belgium (%)
Place of birth for the foreign-born population - France (%)
Place of birth for the foreign-born population - Germany (%)
Place of birth for the foreign-born population - Netherlands (%)
Place of birth for the foreign-born population - Switzerland (%)
Place of birth for the foreign-born population - Other Western Europe (%)
Place of birth for the foreign-born population - Greece (%)
Place of birth for the foreign-born population - Italy (%)
Place of birth for the foreign-born population - Portugal (%)
Place of birth for the foreign-born population - Spain (%)
Place of birth for the foreign-born population - Other Southern Europe (%)
Place of birth for the foreign-born population - Albania (%)
Place of birth for the foreign-born population - Belarus (%)
Place of birth for the foreign-born population - Bosnia and Herzegovina (%)
Place of birth for the foreign-born population - Bulgaria (%)
Place of birth for the foreign-born population - Croatia (%)
Place of birth for the foreign-born population - Czechoslovakia (%)
Place of birth for the foreign-born population - Hungary (%)
Place of birth for the foreign-born population - Latvia (%)
Place of birth for the foreign-born population - Lithuania (%)
Place of birth for the foreign-born population - North Macedonia (Macedonia) (%)
Place of birth for the foreign-born population - Moldova (%)
Place of birth for the foreign-born population - Poland (%)
Place of birth for the foreign-born population - Romania (%)
Place of birth for the foreign-born population - Russia (%)
Place of birth for the foreign-born population - Serbia (%)
Place of birth for the foreign-born population - Ukraine (%)
Place of birth for the foreign-born population - Other Eastern Europe (%)
Place of birth for the foreign-born population - China (%)
Place of birth for the foreign-born population - Hong Kong (%)
Place of birth for the foreign-born population - Taiwan (%)
Place of birth for the foreign-born population - Japan (%)
Place of birth for the foreign-born population - Korea (%)
Place of birth for the foreign-born population - Other Eastern Asia (%)
Place of birth for the foreign-born population - Afghanistan (%)
Place of birth for the foreign-born population - Bangladesh (%)
Place of birth for the foreign-born population - India (%)
Place of birth for the foreign-born population - Iran (%)
Place of birth for the foreign-born population - Kazakhstan (%)
Place of birth for the foreign-born population - Nepal (%)
Place of birth for the foreign-born population - Pakistan (%)
Place of birth for the foreign-born population - Sri Lanka (%)
Place of birth for the foreign-born population - Uzbekistan (%)
Place of birth for the foreign-born population - Other South Central Asia (%)
Place of birth for the foreign-born population - Burma (%)
Place of birth for the foreign-born population - Cambodia (%)
Place of birth for the foreign-born population - Indonesia (%)
Place of birth for the foreign-born population - Laos (%)
Place of birth for the foreign-born population - Malaysia (%)
Place of birth for the foreign-born population - Philippines (%)
Place of birth for the foreign-born population - Singapore (%)
Place of birth for the foreign-born population - Thailand (%)
Place of birth for the foreign-born population - Vietnam (%)
Place of birth for the foreign-born population - Other South Eastern Asia (%)
Place of birth for the foreign-born population - Armenia (%)
Place of birth for the foreign-born population - Iraq (%)
Place of birth for the foreign-born population - Israel (%)
Place of birth for the foreign-born population - Jordan (%)
Place of birth for the foreign-born population - Kuwait (%)
Place of birth for the foreign-born population - Lebanon (%)
Place of birth for the foreign-born population - Saudi Arabia (%)
Place of birth for the foreign-born population - Syria (%)
Place of birth for the foreign-born population - Turkey (%)
Place of birth for the foreign-born population - Yemen (%)
Place of birth for the foreign-born population - Other Western Asia (%)
Place of birth for the foreign-born population - Eritrea (%)
Place of birth for the foreign-born population - Ethiopia (%)
Place of birth for the foreign-born population - Kenya (%)
Place of birth for the foreign-born population - Somalia (%)
Place of birth for the foreign-born population - Uganda (%)
Place of birth for the foreign-born population - Zimbabwe (%)
Place of birth for the foreign-born population - Other Eastern Africa (%)
Place of birth for the foreign-born population - Cameroon (%)
Place of birth for the foreign-born population - Congo (%)
Place of birth for the foreign-born population - Democratic Republic of Congo (Zaire) (%)
Place of birth for the foreign-born population - Other Middle Africa (%)
Place of birth for the foreign-born population - Egypt (%)
Place of birth for the foreign-born population - Morocco (%)
Place of birth for the foreign-born population - Sudan (%)
Place of birth for the foreign-born population - Other Northern Africa (%)
Place of birth for the foreign-born population - South Africa (%)
Place of birth for the foreign-born population - Other Southern Africa (%)
Place of birth for the foreign-born population - Cabo Verde (%)
Place of birth for the foreign-born population - Ghana (%)
Place of birth for the foreign-born population - Liberia (%)
Place of birth for the foreign-born population - Nigeria (%)
Place of birth for the foreign-born population - Senegal (%)
Place of birth for the foreign-born population - Sierra Leone (%)
Place of birth for the foreign-born population - Other Western Africa (%)
Place of birth for the foreign-born population - Australia (%)
Place of birth for the foreign-born population - New Zealand (%)
Place of birth for the foreign-born population - Fiji (%)
Place of birth for the foreign-born population - Micronesia (%)
Place of birth for the foreign-born population - Bahamas (%)
Place of birth for the foreign-born population - Barbados (%)
Place of birth for the foreign-born population - Cuba (%)
Place of birth for the foreign-born population - Dominica (%)
Place of birth for the foreign-born population - Dominican Republic (%)
Place of birth for the foreign-born population - Grenada (%)
Place of birth for the foreign-born population - Haiti (%)
Place of birth for the foreign-born population - Jamaica (%)
Place of birth for the foreign-born population - St. Vincent and the Grenadines (%)
Place of birth for the foreign-born population - Trinidad and Tobago (%)
Place of birth for the foreign-born population - West Indies (%)
Place of birth for the foreign-born population - Other Caribbean (%)
Place of birth for the foreign-born population - Belize (%)
Place of birth for the foreign-born population - Costa Rica (%)
Place of birth for the foreign-born population - El Salvador (%)
Place of birth for the foreign-born population - Guatemala (%)
Place of birth for the foreign-born population - Honduras (%)
Place of birth for the foreign-born population - Mexico (%)
Place of birth for the foreign-born population - Nicaragua (%)
Place of birth for the foreign-born population - Panama (%)
Place of birth for the foreign-born population - Other Central America (%)
Place of birth for the foreign-born population - Argentina (%)
Place of birth for the foreign-born population - Bolivia (%)
Place of birth for the foreign-born population - Brazil (%)
Place of birth for the foreign-born population - Chile (%)
Place of birth for the foreign-born population - Colombia (%)
Place of birth for the foreign-born population - Ecuador (%)
Place of birth for the foreign-born population - Guyana (%)
Place of birth for the foreign-born population - Peru (%)
Place of birth for the foreign-born population - Uruguay (%)
Place of birth for the foreign-born population - Venezuela (%)
Place of birth for the foreign-born population - Other South America (%)
Place of birth for the foreign-born population - Canada (%)
Place of birth for the foreign-born population - Other Northern America (%)
Place of birth for the foreign-born population - Other (%)
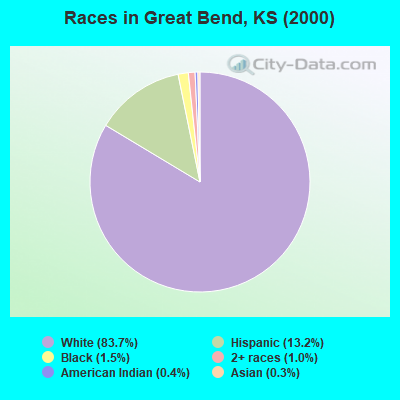
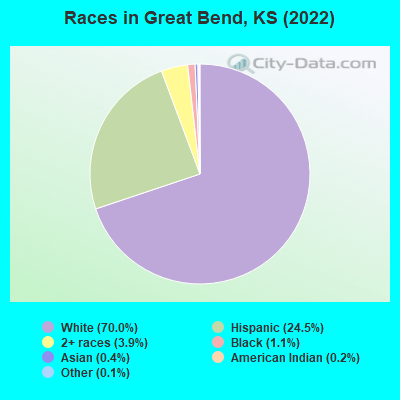
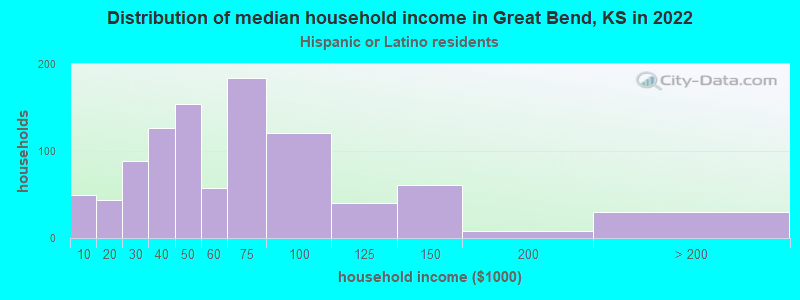
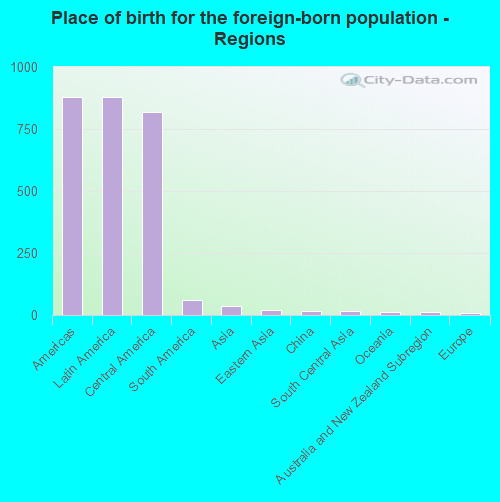
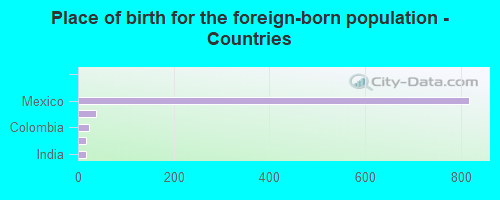
According to 2022 data, the most numerous races in Great Bend, KS are White alone (10,318 residents), Hispanic (3,611 residents), and Black alone (165 residents). 87.1% of Great Bend residents speak English at home. 6.4% of Great Bend, KS residents are foreign-born (5.9% born in Latin America), which is 9.8% less than the foreign-born rate of 7.0% across the entire state of Kansas.
Race distribution in Great Bend
2000 2022
2,233,997 83.1% White alone 188,252 7.0% Hispanic 151,407 5.6% Black alone 46,301 1.7% Asian alone 42,508 1.6% Two or more races 22,322 0.8% American Indian alone 2,477 0.09% Other race alone 1,154 0.04% Native Hawaiian and Other
2,147,943 73.1% White alone 381,746 13.0% Hispanic 147,666 5.0% Black alone 145,362 4.9% Two or more races 85,085 2.9% Asian alone 13,263 0.5% Other race alone 12,065 0.4% American Indian alone 4,020 0.1% Native Hawaiian and Other
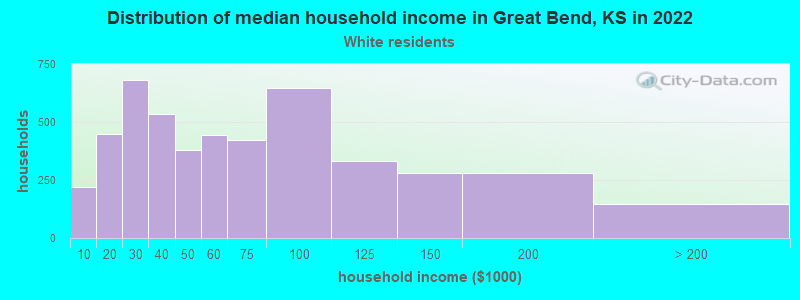
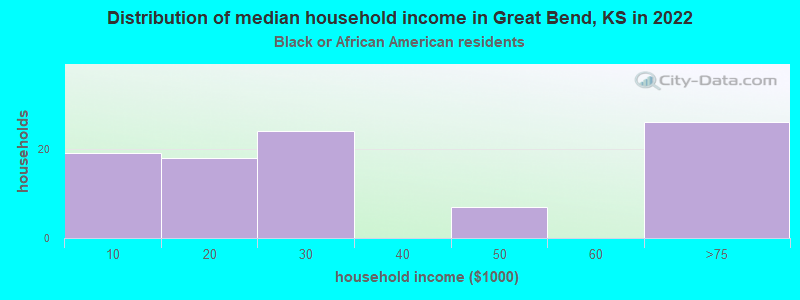
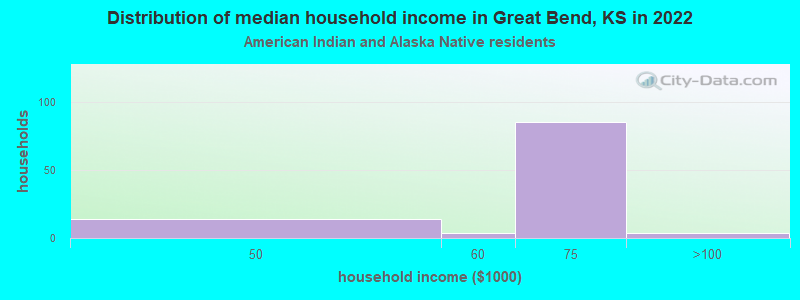
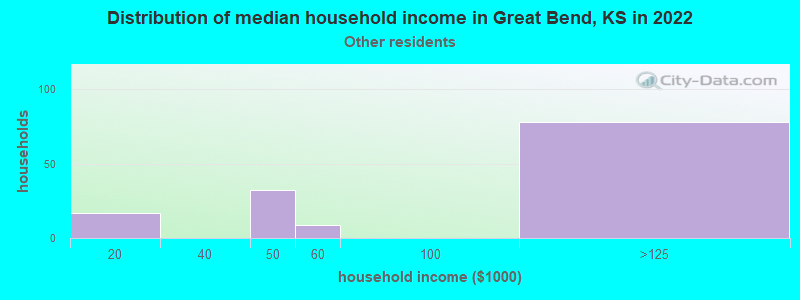
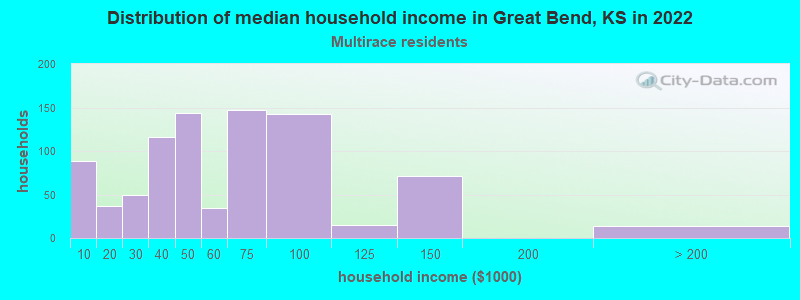
Income and house value in Great Bend Median household income in 2022 $53,525 White non-Hispanic householders$25,600 Black householders$78,131 American Indian and Alaska Native householders$50,225 Two or more races householders$51,875 Hispanic or Latino race householdersMedian 2022 house value $134,253 White Non-Hispanic householders$39,357 Black or African American householders$91,615 American Indian or Alaska Native householders $156,118 Asian householders$66,033 Some other race householders$80,683 Two or more races householders$62,972 Hispanic or Latino householders
Median age by race in Great Bend
41.5 Median age for White residents41.3 44.8 52.8 Median age for Black or African American residents52.4 86.0 44.9 Median age for American Indian / Alaska Native residents21.0 61.4 14.8 Median age for Asian residents-717,460,316.7 18.4 -627,039,626.4 Median age for Native Hawaiian / Pacific Islander residents-669,240,668.6 -641,269,840.6 24.4 Median age for Other race residents36.7 21.0 26.1 Median age for Two or more races residents27.5 18.1 45.0 Median age for White alone residents42.2 47.9 24.3 Median age for Hispanic or Latino residents26.1 21.7
Owner/renter occupied households by race in Great Bend
House owners and renters - White residents 3,034 63.5% Owner occupied1,745 36.5% Renter occupiedHouse owners and renters - Black or African American residents 48 48.7% Owner occupied50 51.3% Renter occupiedHouse owners and renters - American Indian / Alaska Native residents 4 3.9% Owner occupied94 96.1% Renter occupiedHouse owners and renters - Other race residents 93 80.3% Owner occupied23 19.7% Renter occupiedHouse owners and renters - Two or more races residents 388 45.7% Owner occupied461 54.3% Renter occupiedHouse owners and renters - White alone residents 2,878 63.4% Owner occupied1,663 36.6% Renter occupiedHouse owners and renters - Hispanic or Latino residents 504 51.8% Owner occupied470 48.2% Renter occupied
Language usage in Great Bend
English speakers - Total 87.1% of residents of Great Bend speak English at home.
13.0% of residents speak Spanish at home 790 44.6% Speak English very well980 55.4% Speak English less than very well0.2% of residents speak other language at home 25 100.0% Speak English very well
English speakers - Born in the United States 91.6% of residents of Great Bend speak English at home.
7.5% of residents speak Spanish at home 142 75.1% Speak English very well47 24.9% Speak English less than very well1.0% of residents speak other language at home 25 100.0% Speak English very well
All residents speak only English at home
English speakers - Foreign-born 20.3% of residents of Great Bend speak English at home.
80.5% of residents speak Spanish at home 157 21.2% Speak English very well585 78.8% Speak English less than very well
White (Caucasian) - Speak only English Native:
97.9% (10,216)Foreign-born:
67.7% (122)
White (Caucasian) - Speak another language Native:
2.2% (225)Foreign-born:
46.9% (85)
American Indian / Alaska Native - Speak another language Native:
100.0% (155)Foreign-born:
100.0% (68)
Asian - Speak only English Native:
100.0% (15)Foreign-born:
96.4% (34)
Other race - Speak another language Native:
68.4% (290)Foreign-born:
96.6% (144)
Two or more races - Speak another language Native:
34.4% (582)Foreign-born:
100.0% (747)
White alone - Speak only English Native:
99.8% (9,675)Foreign-born:
92.6% (19)
Hispanic or Latino - Speak only English Native:
56.6% (1,333)Foreign-born:
18.1% (161)
Hispanic or Latino - Speak another language Native:
43.4% (1,021)Foreign-born:
84.3% (750)
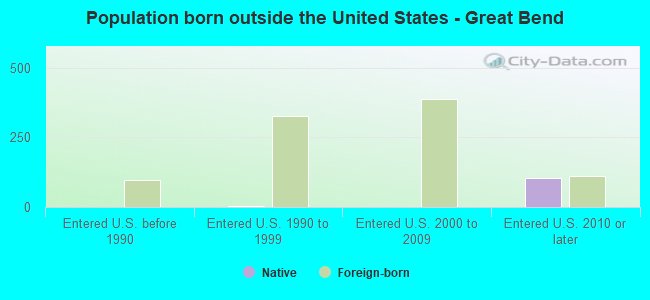
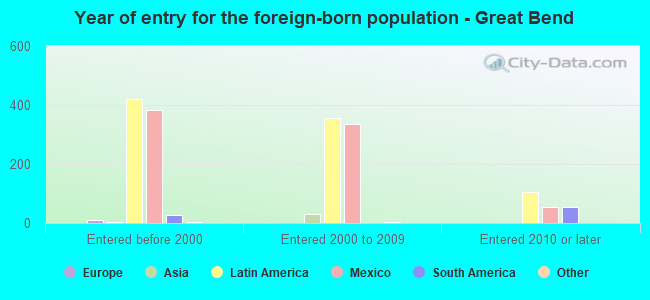
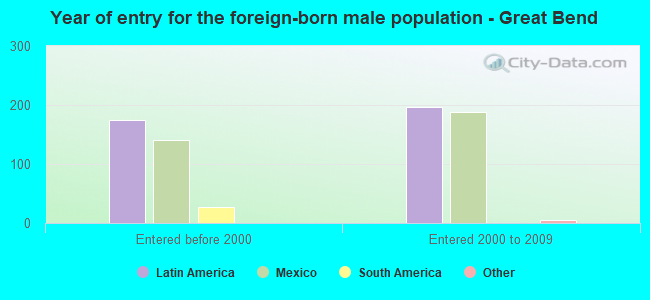
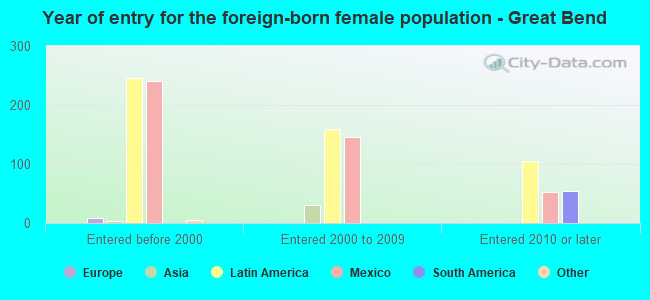
Foreign-born residents in Great Bend 939 residents are foreign born (5.9% Latin America ).
This city:
6.4%Kansas:
7.1%
Marital status for residents in Great Bend Marital status - White (Caucasian) population 15 years and over
Males 27.3% Never married52.3% Now married0.6% Separated4.3% Widowed15.5% DivorcedFemales 26.6% Never married45.4% Now married0.6% Separated11.6% Widowed15.8% DivorcedWomen who gave birth in the past 12 months Now married:
68.7% (131)Unmarried:
31.3% (60)
Women who did not give birth in the past 12 months Now married:
40.2% (888)Unmarried:
59.8% (1,323)
Marital status - Black or African American population 15 years and over
Males 63.3% Never married27.8% Now married0.0% Separated0.0% Widowed8.9% DivorcedFemales 0.0% Never married29.4% Now married0.0% Separated52.9% Widowed17.6% DivorcedWomen who did not give birth in the past 12 months Now married:
100.0% (25)Unmarried:
0.0% (0)
Marital status - American Indian / Alaska Native population 15 years and over
Males 81.3% Never married10.7% Now married0.0% Separated0.0% Widowed8.0% DivorcedFemales 14.7% Never married2.9% Now married0.0% Separated0.0% Widowed82.4% DivorcedWomen who did not give birth in the past 12 months Now married:
6.5% (3)Unmarried:
93.5% (49)
Marital status - Other race population 15 years and over
Males 26.3% Never married28.5% Now married25.8% Separated19.4% Widowed0.0% DivorcedFemales 51.2% Never married20.6% Now married6.5% Separated0.6% Widowed21.2% DivorcedWomen who did not give birth in the past 12 months Now married:
20.9% (29)Unmarried:
79.1% (110)
Marital status - Two or more races population 15 years and over
Males 47.6% Never married44.6% Now married0.2% Separated2.8% Widowed4.9% DivorcedFemales 39.5% Never married52.6% Now married0.0% Separated4.6% Widowed3.3% DivorcedWomen who gave birth in the past 12 months Now married:
100.0% (46)Unmarried:
0.0% (0)
Women who did not give birth in the past 12 months Now married:
47.1% (257)Unmarried:
52.9% (288)
Marital status - White alone, not Hispanic / Latino population 15 years and over
Males 26.2% Never married54.2% Now married0.7% Separated4.5% Widowed14.4% DivorcedFemales 22.0% Never married47.7% Now married0.6% Separated12.6% Widowed17.1% DivorcedWomen who gave birth in the past 12 months Now married:
77.5% (136)Unmarried:
22.5% (39)
Women who did not give birth in the past 12 months Now married:
43.7% (811)Unmarried:
56.3% (1,046)
Marital status - Hispanic or Latino population 15 years and over
Males 46.1% Never married34.2% Now married4.1% Separated4.2% Widowed11.3% DivorcedFemales 52.2% Never married31.3% Now married0.9% Separated3.5% Widowed12.0% DivorcedWomen who gave birth in the past 12 months Now married:
0.0% (0)Unmarried:
100.0% (24)
Women who did not give birth in the past 12 months Now married:
33.9% (330)Unmarried:
66.1% (644)
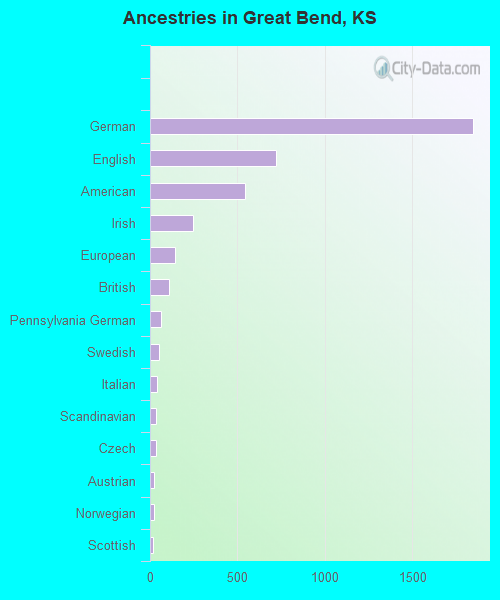
Ancestries in Great Bend
1,847 25.7% German722 10.0% English545 7.6% American248 3.4% Irish142 2.0% European106 1.5% British63 0.9% Pennsylvania German54 0.8% Swedish42 0.6% Italian33 0.5% Scandinavian32 0.4% Czech24 0.3% Austrian22 0.3% Norwegian17 0.2% Scottish15 0.2% French14 0.2% Russian11 0.2% Hungarian10 0.1% Slovak8 0.1% French Canadian8 0.1% Northern European6 0.08% Czechoslovakian5 0.07% Dutch
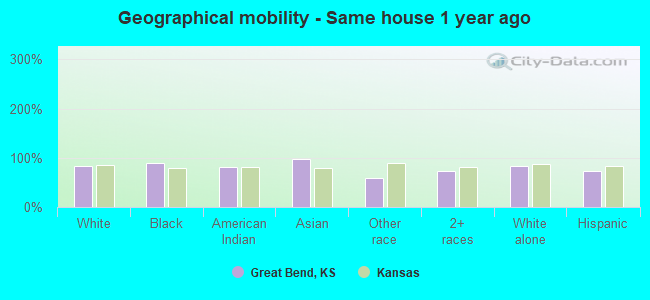
Geographical mobility in Great Bend Same house 1 year ago 9,203 83.1% White (Caucasian)149 89.2% Black or African American173 81.6% American Indian / Alaska Native64 97.8% Asian365 59.9% Other race2,028 73.2% Two or more races8,458 83.5% White alone, not Hispanic / Latino2,582 72.4% Hispanic or LatinoMoved within same county 1,143 10.3% White / Caucasian13 7.7% Black or African American18 8.6% American Indian / Alaska Native193 31.7% Other race779 28.1% Two or more races959 9.5% White alone, not Hispanic / Latino933 26.2% Hispanic or LatinoMoved within same state 521 4.7% White / Caucasian3 1.6% American Indian / Alaska Native545 5.4% White alone, not Hispanic / LatinoMoved from different state 143 1.3% White / Caucasian5 2.9% Black or African American14 6.6% American Indian / Alaska Native1 0.0% Two or more races129 1.3% White alone, not Hispanic / Latino14 0.4% Hispanic or LatinoMoved from abroad 8 0.1% White9 0.1% White alone, not Hispanic / Latino
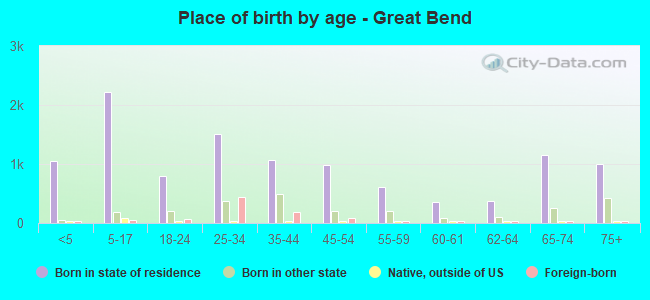
Children Nativity (place of birth) in Great Bend
Children under 6 years - Living with two parents Both parents native 662 100.0% NativeBoth parents foreign-born 37 100.0% NativeOne native, one foreign-born parent 86 100.0% NativeChildren under 6 years - Living with one parent Native parent 420 100.0% NativeForeign-born parent 43 100.0% NativeChildren 6 to 17 years - Living with two parents Both parents native 1,190 98.7% Native16 1.3% Foreign-bornBoth parents foreign-born 143 100.0% NativeOne native, one foreign-born parent 137 100.0% NativeChildren 6 to 17 years - Living with one parent Native parent 469 100.0% NativeForeign-born parent 209 52.3% Native191 47.7% Foreign-born
Grandparents responsible for own grandchildren in Great Bend
Grandparents (30 to 59 years) White / Caucasian 14 50.9% Responsible for grandchildren13 49.1% Not responsible for grandchildrenOther race 28 100.0% Responsible for grandchildrenWhite alone, not Hispanic / Latino 14 50.2% Responsible for grandchildren14 49.8% Not responsible for grandchildrenHispanic or Latino 17 100.0% Responsible for grandchildrenGrandparents (60 years and over) White / Caucasian 23 25.9% Responsible for grandchildren65 74.1% Not responsible for grandchildrenOther race 12 100.0% Responsible for grandchildrenWhite alone, not Hispanic / Latino 23 100.0% Responsible for grandchildrenHispanic or Latino 7 10.5% Responsible for grandchildren60 89.5% Not responsible for grandchildren