Races in Great Neck, New York (NY) Detailed Stats
Data:
Races - White alone (%)
Races - White alone (% change since 2000)
Races - Black alone (%)
Races - Black alone (% change since 2000)
Races - American Indian alone (%)
Races - American Indian alone (% change since 2000)
Races - Asian alone (%)
Races - Asian alone (% change since 2000)
Races - Hispanic (%)
Races - Hispanic (% change since 2000)
Races - Native Hawaiian and Other Pacific Islander alone (%)
Races - Native Hawaiian and Other Pacific Islander alone (% change since 2000)
Races - Two or more races(%)
Races - Two or more races(% change since 2000)
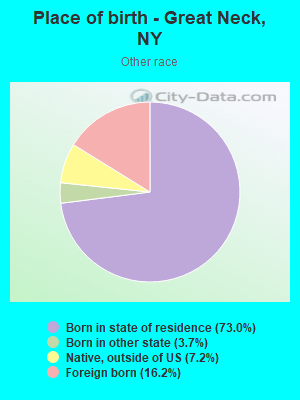
Races - Other race alone (%)
Races - Other race alone (% change since 2000)
Racial diversity
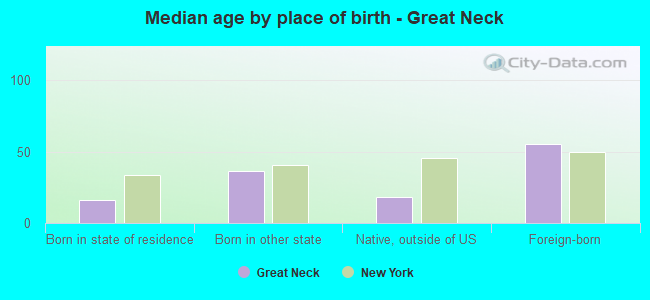
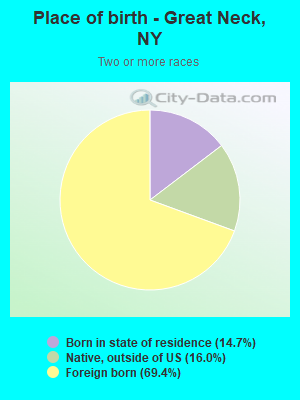
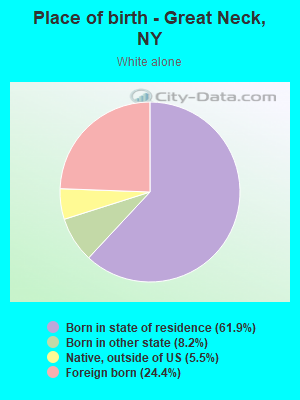
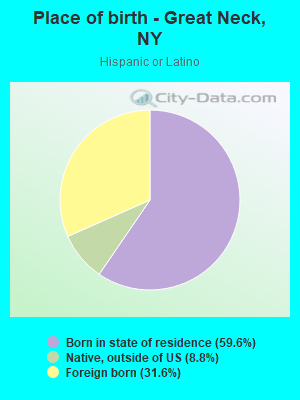
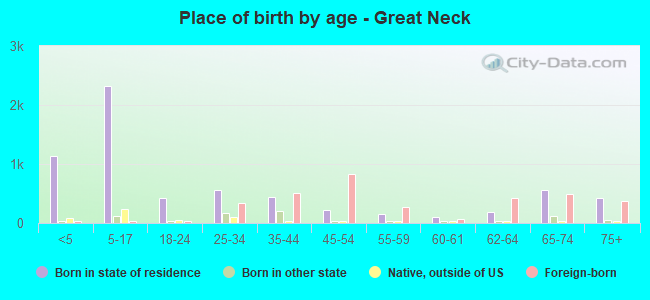
Place of birth - Born in state of residence (%)
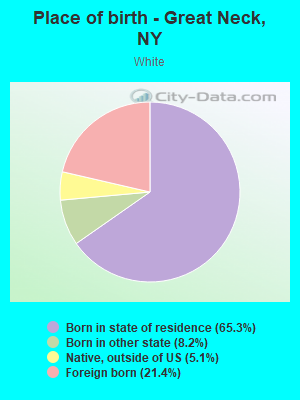
Place of birth - Born in state of residence (%) - White
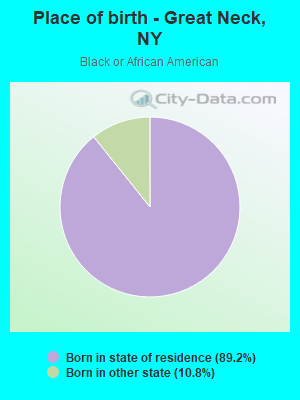
Place of birth - Born in state of residence (%) - Black or African American
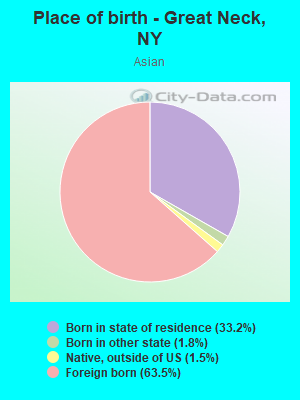
Place of birth - Born in state of residence (%) - Asian
Place of birth - Born in state of residence (%) - Hispanic or Latino
Place of birth - Born in state of residence (%) - American Indian and Alaska Native
Place of birth - Born in state of residence (%) - Multirace
Place of birth - Born in state of residence (%) - Other Race
Place of birth - Born in other state (%)
Place of birth - Born in other state (%) - White
Place of birth - Born in other state (%) - Black or African American
Place of birth - Born in other state (%) - Asian
Place of birth - Born in other state (%) - Hispanic or Latino
Place of birth - Born in other state (%) - American Indian and Alaska Native
Place of birth - Born in other state (%) - Multirace
Place of birth - Born in other state (%) - Other Race
Place of birth - Native, outside of US (%)
Place of birth - Native, outside of US (%) - White
Place of birth - Native, outside of US (%) - Black or African American
Place of birth - Native, outside of US (%) - Asian
Place of birth - Native, outside of US (%) - Hispanic or Latino
Place of birth - Native, outside of US (%) - American Indian and Alaska Native
Place of birth - Native, outside of US (%) - Multirace
Place of birth - Native, outside of US (%) - Other Race
Place of birth - Foreign born (%)
Place of birth - Foreign born (%) - White
Place of birth - Foreign born (%) - Black or African American
Place of birth - Foreign born (%) - Asian
Place of birth - Foreign born (%) - Hispanic or Latino
Place of birth - Foreign born (%) - American Indian and Alaska Native
Place of birth - Foreign born (%) - Multirace
Place of birth - Foreign born (%) - Other Race
Residents speaking English at home (%)
Residents speaking English at home - Born in the United States (%)
Residents speaking English at home - Native, born elsewhere (%)
Residents speaking English at home - Foreign born (%)
Residents speaking Spanish at home (%)
Residents speaking Spanish at home - Born in the United States (%)
Residents speaking Spanish at home - Native, born elsewhere (%)
Residents speaking Spanish at home - Foreign born (%)
Residents speaking other language at home (%)
Residents speaking other language at home - Born in the United States (%)
Residents speaking other language at home - Native, born elsewhere (%)
Residents speaking other language at home - Foreign born (%)
Marital status - Never married (%)
Marital status - Now married (%)
Marital status - Separated (%)
Marital status - Widowed (%)
Marital status - Divorced (%)
Ancestries Reported - Arab (%)
Ancestries Reported - Czech (%)
Ancestries Reported - Danish (%)
Ancestries Reported - Dutch (%)
Ancestries Reported - English (%)
Ancestries Reported - French (%)
Ancestries Reported - French Canadian (%)
Ancestries Reported - German (%)
Ancestries Reported - Greek (%)
Ancestries Reported - Hungarian (%)
Ancestries Reported - Irish (%)
Ancestries Reported - Italian (%)
Ancestries Reported - Lithuanian (%)
Ancestries Reported - Norwegian (%)
Ancestries Reported - Polish (%)
Ancestries Reported - Portuguese (%)
Ancestries Reported - Russian (%)
Ancestries Reported - Scotch-Irish (%)
Ancestries Reported - Scottish (%)
Ancestries Reported - Slovak (%)
Ancestries Reported - Subsaharan African (%)
Ancestries Reported - Swedish (%)
Ancestries Reported - Swiss (%)
Ancestries Reported - Ukrainian (%)
Ancestries Reported - United States (%)
Ancestries Reported - Welsh (%)
Ancestries Reported - West Indian (%)
Ancestries Reported - Other (%)
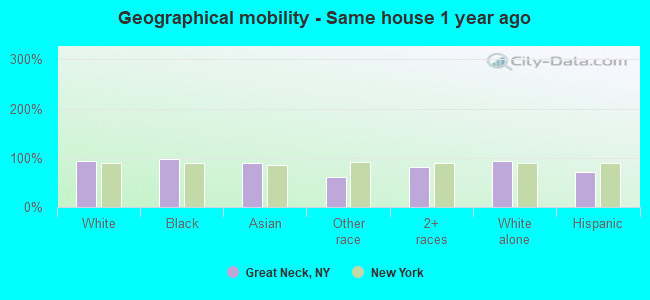
Geographical mobility - Same house 1 year ago (%)
Geographical mobility - Same house 1 year ago (%) - White
Geographical mobility - Same house 1 year ago (%) - Black or African American
Geographical mobility - Same house 1 year ago (%) - Asian
Geographical mobility - Same house 1 year ago (%) - Hispanic or Latino
Geographical mobility - Same house 1 year ago (%) - American Indian and Alaska Native
Geographical mobility - Same house 1 year ago (%) - Multirace
Geographical mobility - Same house 1 year ago (%) - Other Race
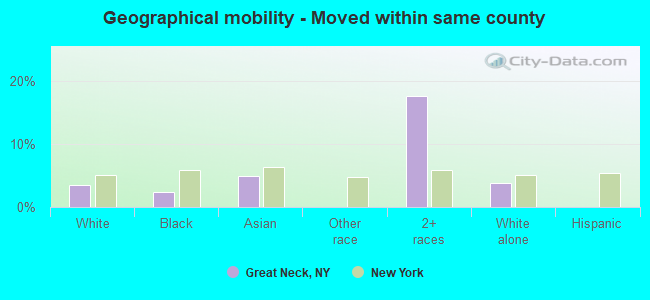
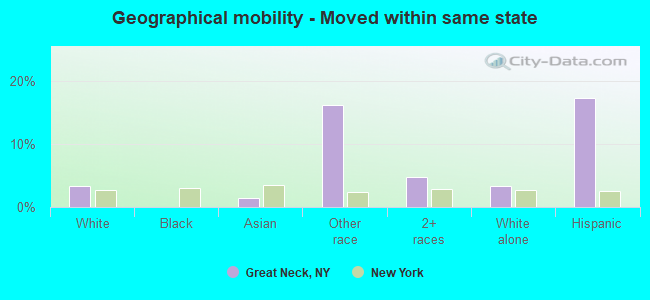
Geographical mobility - Moved within same county (%)
Geographical mobility - Moved within same county (%) - White
Geographical mobility - Moved within same county (%) - Black or African American
Geographical mobility - Moved within same county (%) - Asian
Geographical mobility - Moved within same county (%) - Hispanic or Latino
Geographical mobility - Moved within same county (%) - American Indian and Alaska Native
Geographical mobility - Moved within same county (%) - Multirace
Geographical mobility - Moved within same county (%) - Other Race
Geographical mobility - Moved from different county within same state (%)
Geographical mobility - Moved from different county within same state (%) - White
Geographical mobility - Moved from different county within same state (%) - Black or African American
Geographical mobility - Moved from different county within same state (%) - Asian
Geographical mobility - Moved from different county within same state (%) - Hispanic or Latino
Geographical mobility - Moved from different county within same state (%) - American Indian and Alaska Native
Geographical mobility - Moved from different county within same state (%) - Multirace
Geographical mobility - Moved from different county within same state (%) - Other Race
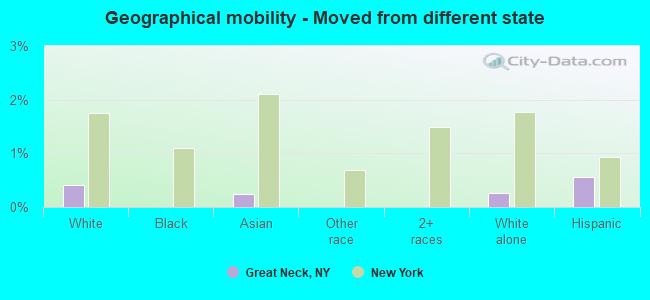
Geographical mobility - Moved from different state (%)
Geographical mobility - Moved from different state (%) - White
Geographical mobility - Moved from different state (%) - Black or African American
Geographical mobility - Moved from different state (%) - Asian
Geographical mobility - Moved from different state (%) - Hispanic or Latino
Geographical mobility - Moved from different state (%) - American Indian and Alaska Native
Geographical mobility - Moved from different state (%) - Multirace
Geographical mobility - Moved from different state (%) - Other Race
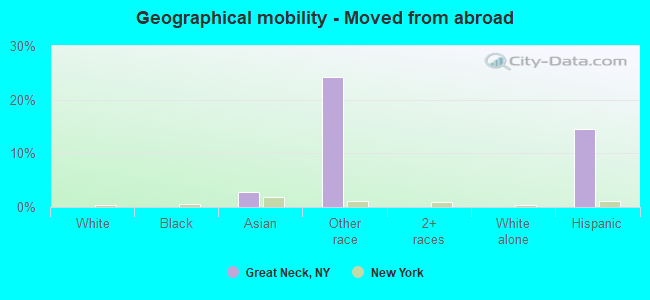
Geographical mobility - Moved from abroad (%)
Geographical mobility - Moved from abroad (%) - White
Geographical mobility - Moved from abroad (%) - Black or African American
Geographical mobility - Moved from abroad (%) - Asian
Geographical mobility - Moved from abroad (%) - Hispanic or Latino
Geographical mobility - Moved from abroad (%) - American Indian and Alaska Native
Geographical mobility - Moved from abroad (%) - Multirace
Geographical mobility - Moved from abroad (%) - Other Race
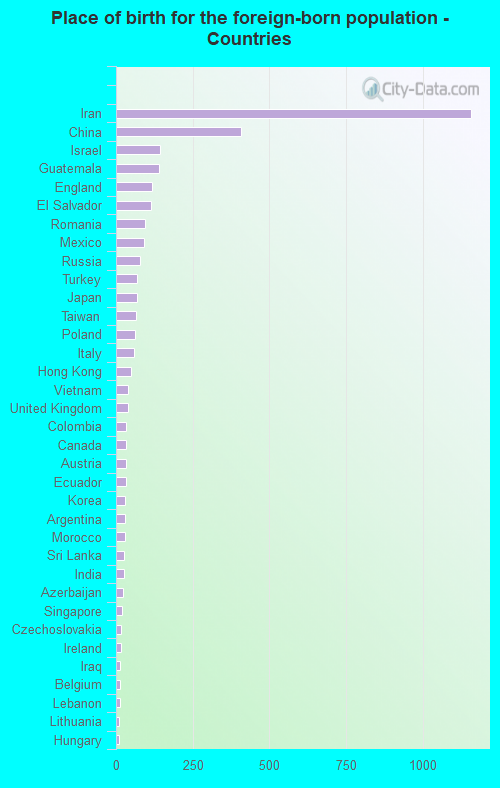
Place of birth for the foreign-born population - Ireland (%)
Place of birth for the foreign-born population - Denmark (%)
Place of birth for the foreign-born population - Norway (%)
Place of birth for the foreign-born population - Sweden (%)
Place of birth for the foreign-born population - United Kingdom (%)
Place of birth for the foreign-born population - England (%)
Place of birth for the foreign-born population - Scotland (%)
Place of birth for the foreign-born population - Other Northern Europe (%)
Place of birth for the foreign-born population - Austria (%)
Place of birth for the foreign-born population - Belgium (%)
Place of birth for the foreign-born population - France (%)
Place of birth for the foreign-born population - Germany (%)
Place of birth for the foreign-born population - Netherlands (%)
Place of birth for the foreign-born population - Switzerland (%)
Place of birth for the foreign-born population - Other Western Europe (%)
Place of birth for the foreign-born population - Greece (%)
Place of birth for the foreign-born population - Italy (%)
Place of birth for the foreign-born population - Portugal (%)
Place of birth for the foreign-born population - Spain (%)
Place of birth for the foreign-born population - Other Southern Europe (%)
Place of birth for the foreign-born population - Albania (%)
Place of birth for the foreign-born population - Belarus (%)
Place of birth for the foreign-born population - Bosnia and Herzegovina (%)
Place of birth for the foreign-born population - Bulgaria (%)
Place of birth for the foreign-born population - Croatia (%)
Place of birth for the foreign-born population - Czechoslovakia (%)
Place of birth for the foreign-born population - Hungary (%)
Place of birth for the foreign-born population - Latvia (%)
Place of birth for the foreign-born population - Lithuania (%)
Place of birth for the foreign-born population - North Macedonia (Macedonia) (%)
Place of birth for the foreign-born population - Moldova (%)
Place of birth for the foreign-born population - Poland (%)
Place of birth for the foreign-born population - Romania (%)
Place of birth for the foreign-born population - Russia (%)
Place of birth for the foreign-born population - Serbia (%)
Place of birth for the foreign-born population - Ukraine (%)
Place of birth for the foreign-born population - Other Eastern Europe (%)
Place of birth for the foreign-born population - China (%)
Place of birth for the foreign-born population - Hong Kong (%)
Place of birth for the foreign-born population - Taiwan (%)
Place of birth for the foreign-born population - Japan (%)
Place of birth for the foreign-born population - Korea (%)
Place of birth for the foreign-born population - Other Eastern Asia (%)
Place of birth for the foreign-born population - Afghanistan (%)
Place of birth for the foreign-born population - Bangladesh (%)
Place of birth for the foreign-born population - India (%)
Place of birth for the foreign-born population - Iran (%)
Place of birth for the foreign-born population - Kazakhstan (%)
Place of birth for the foreign-born population - Nepal (%)
Place of birth for the foreign-born population - Pakistan (%)
Place of birth for the foreign-born population - Sri Lanka (%)
Place of birth for the foreign-born population - Uzbekistan (%)
Place of birth for the foreign-born population - Other South Central Asia (%)
Place of birth for the foreign-born population - Burma (%)
Place of birth for the foreign-born population - Cambodia (%)
Place of birth for the foreign-born population - Indonesia (%)
Place of birth for the foreign-born population - Laos (%)
Place of birth for the foreign-born population - Malaysia (%)
Place of birth for the foreign-born population - Philippines (%)
Place of birth for the foreign-born population - Singapore (%)
Place of birth for the foreign-born population - Thailand (%)
Place of birth for the foreign-born population - Vietnam (%)
Place of birth for the foreign-born population - Other South Eastern Asia (%)
Place of birth for the foreign-born population - Armenia (%)
Place of birth for the foreign-born population - Iraq (%)
Place of birth for the foreign-born population - Israel (%)
Place of birth for the foreign-born population - Jordan (%)
Place of birth for the foreign-born population - Kuwait (%)
Place of birth for the foreign-born population - Lebanon (%)
Place of birth for the foreign-born population - Saudi Arabia (%)
Place of birth for the foreign-born population - Syria (%)
Place of birth for the foreign-born population - Turkey (%)
Place of birth for the foreign-born population - Yemen (%)
Place of birth for the foreign-born population - Other Western Asia (%)
Place of birth for the foreign-born population - Eritrea (%)
Place of birth for the foreign-born population - Ethiopia (%)
Place of birth for the foreign-born population - Kenya (%)
Place of birth for the foreign-born population - Somalia (%)
Place of birth for the foreign-born population - Uganda (%)
Place of birth for the foreign-born population - Zimbabwe (%)
Place of birth for the foreign-born population - Other Eastern Africa (%)
Place of birth for the foreign-born population - Cameroon (%)
Place of birth for the foreign-born population - Congo (%)
Place of birth for the foreign-born population - Democratic Republic of Congo (Zaire) (%)
Place of birth for the foreign-born population - Other Middle Africa (%)
Place of birth for the foreign-born population - Egypt (%)
Place of birth for the foreign-born population - Morocco (%)
Place of birth for the foreign-born population - Sudan (%)
Place of birth for the foreign-born population - Other Northern Africa (%)
Place of birth for the foreign-born population - South Africa (%)
Place of birth for the foreign-born population - Other Southern Africa (%)
Place of birth for the foreign-born population - Cabo Verde (%)
Place of birth for the foreign-born population - Ghana (%)
Place of birth for the foreign-born population - Liberia (%)
Place of birth for the foreign-born population - Nigeria (%)
Place of birth for the foreign-born population - Senegal (%)
Place of birth for the foreign-born population - Sierra Leone (%)
Place of birth for the foreign-born population - Other Western Africa (%)
Place of birth for the foreign-born population - Australia (%)
Place of birth for the foreign-born population - New Zealand (%)
Place of birth for the foreign-born population - Fiji (%)
Place of birth for the foreign-born population - Micronesia (%)
Place of birth for the foreign-born population - Bahamas (%)
Place of birth for the foreign-born population - Barbados (%)
Place of birth for the foreign-born population - Cuba (%)
Place of birth for the foreign-born population - Dominica (%)
Place of birth for the foreign-born population - Dominican Republic (%)
Place of birth for the foreign-born population - Grenada (%)
Place of birth for the foreign-born population - Haiti (%)
Place of birth for the foreign-born population - Jamaica (%)
Place of birth for the foreign-born population - St. Vincent and the Grenadines (%)
Place of birth for the foreign-born population - Trinidad and Tobago (%)
Place of birth for the foreign-born population - West Indies (%)
Place of birth for the foreign-born population - Other Caribbean (%)
Place of birth for the foreign-born population - Belize (%)
Place of birth for the foreign-born population - Costa Rica (%)
Place of birth for the foreign-born population - El Salvador (%)
Place of birth for the foreign-born population - Guatemala (%)
Place of birth for the foreign-born population - Honduras (%)
Place of birth for the foreign-born population - Mexico (%)
Place of birth for the foreign-born population - Nicaragua (%)
Place of birth for the foreign-born population - Panama (%)
Place of birth for the foreign-born population - Other Central America (%)
Place of birth for the foreign-born population - Argentina (%)
Place of birth for the foreign-born population - Bolivia (%)
Place of birth for the foreign-born population - Brazil (%)
Place of birth for the foreign-born population - Chile (%)
Place of birth for the foreign-born population - Colombia (%)
Place of birth for the foreign-born population - Ecuador (%)
Place of birth for the foreign-born population - Guyana (%)
Place of birth for the foreign-born population - Peru (%)
Place of birth for the foreign-born population - Uruguay (%)
Place of birth for the foreign-born population - Venezuela (%)
Place of birth for the foreign-born population - Other South America (%)
Place of birth for the foreign-born population - Canada (%)
Place of birth for the foreign-born population - Other Northern America (%)
Place of birth for the foreign-born population - Other (%)
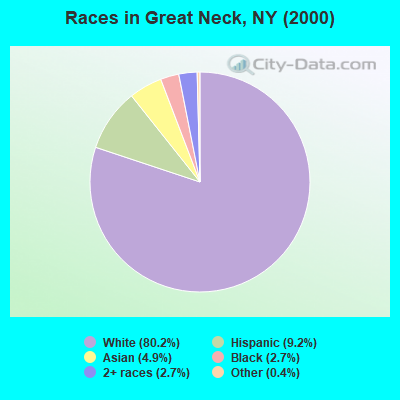
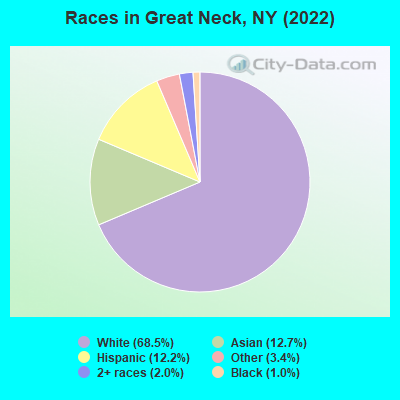
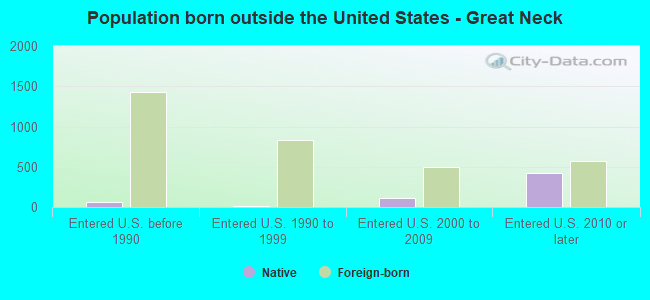
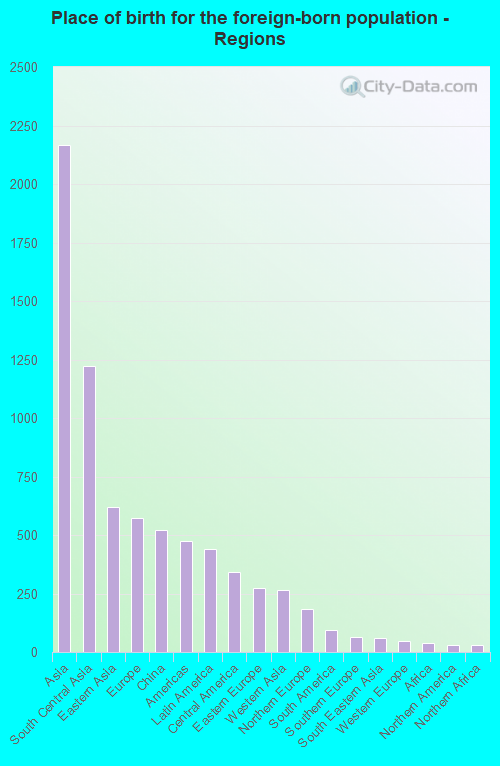
According to 2022 data, the most numerous races in Great Neck, NY are White alone (7,550 residents), Hispanic (1,341 residents), and Black alone (111 residents). 49.7% of Great Neck residents speak English at home. 29.5% of Great Neck, NY residents are foreign-born (19.8% born in Asia, 5.2% born in Europe, 4.0% born in Latin America), which is 25.5% greater than the foreign-born rate of 22.0% across the entire state of New York.
Race distribution in Great Neck
2000 2022
11,760,981 62.0% White alone 2,867,583 15.1% Hispanic 2,812,623 14.8% Black alone 1,035,926 5.5% Asian alone 366,116 1.9% Two or more races 75,499 0.4% Other race alone 52,499 0.3% American Indian alone 5,230 0.03% Native Hawaiian and Other
10,408,933 52.9% White alone 3,867,299 19.7% Hispanic 2,633,840 13.4% Black alone 1,776,286 9.0% Asian alone 732,670 3.7% Two or more races 216,110 1.1% Other race alone 35,082 0.2% American Indian alone 6,931 0.04% Native Hawaiian and Other
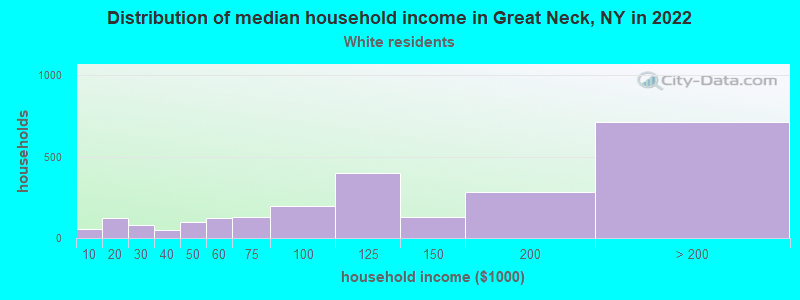
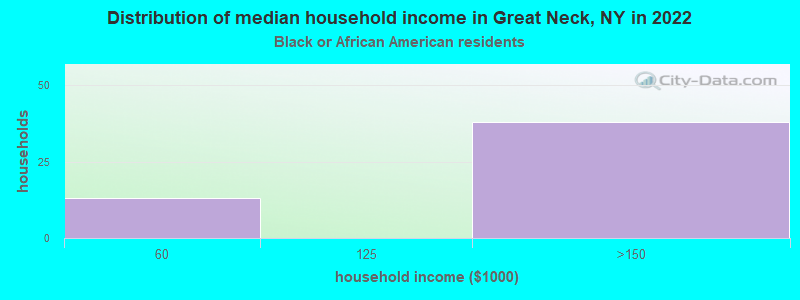
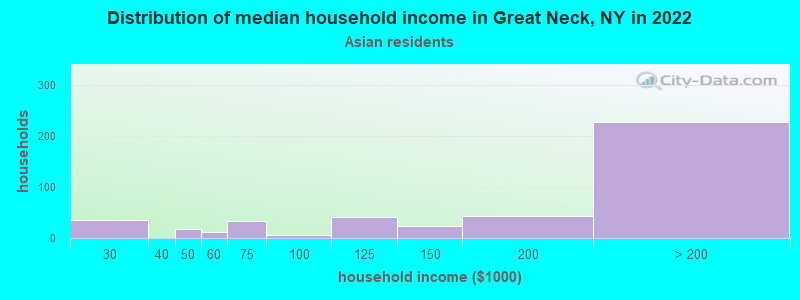
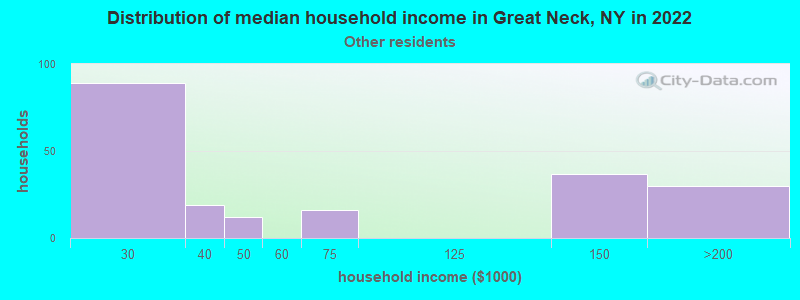
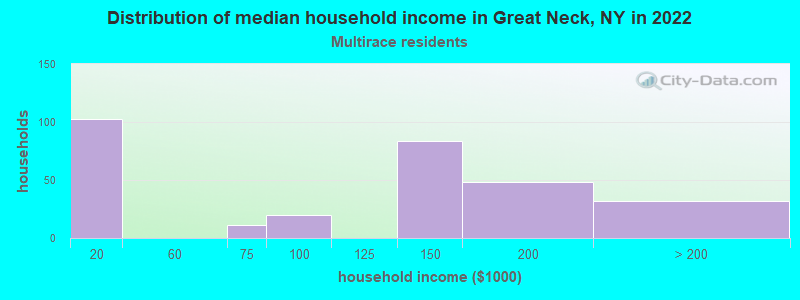
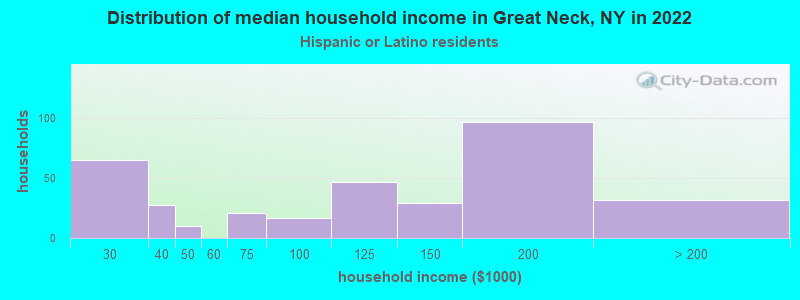
Income and house value in Great Neck Median household income in 2022 $119,963 White non-Hispanic householders$196,540 Asian householders$126,610 Two or more races householders$117,329 Hispanic or Latino race householdersMedian 2022 house value over $1,000,000 White Non-Hispanic householders$905,532 Black or African American householders $900,991 Asian householders$702,717 Some other race householdersover $1,000,000 Two or more races householders$400,008 Hispanic or Latino householders
Median age by race in Great Neck
34.2 Median age for White residents32.9 38.0 62.3 Median age for Black or African American residents-666,666,666.0 69.2 -855,158,729.3 Median age for American Indian / Alaska Native residents-607,543,322.5 -837,121,211.3 43.7 Median age for Asian residents42.6 45.3 -487,992,314.6 Median age for Native Hawaiian / Pacific Islander residents-477,502,295.2 -497,387,669.3 9.8 Median age for Other race residents9.7 9.8 51.8 Median age for Two or more races residents51.1 62.8 34.0 Median age for White alone residents32.4 37.3 26.4 Median age for Hispanic or Latino residents12.6 27.6
Owner/renter occupied households by race in Great Neck
House owners and renters - White residents 1,738 72.2% Owner occupied671 27.8% Renter occupiedHouse owners and renters - Black or African American residents 38 77.8% Owner occupied11 22.2% Renter occupiedHouse owners and renters - Asian residents 407 91.7% Owner occupied37 8.3% Renter occupiedHouse owners and renters - Other race residents 83 47.5% Owner occupied91 52.5% Renter occupiedHouse owners and renters - Two or more races residents 164 63.6% Owner occupied94 36.4% Renter occupiedHouse owners and renters - White alone residents 1,721 72.6% Owner occupied649 27.4% Renter occupiedHouse owners and renters - Hispanic or Latino residents 111 35.0% Owner occupied207 65.0% Renter occupied
Language usage in Great Neck
English speakers - Total 49.7% of residents of Great Neck speak English at home.
10.8% of residents speak Spanish at home 777 73.9% Speak English very well274 26.1% Speak English less than very well41.0% of residents speak other language at home 2,382 59.5% Speak English very well1,621 40.5% Speak English less than very well
English speakers - Born in the United States 83.6% of residents of Great Neck speak English at home.
13.6% of residents speak other language at home 39 40.6% Speak English very well57 59.4% Speak English less than very well
English speakers - Native, born elsewhere 91.0% of residents of Great Neck speak English at home.
6.5% of residents speak other language at home 15 46.9% Speak English very well17 53.1% Speak English less than very well
English speakers - Foreign-born 12.9% of residents of Great Neck speak English at home.
12.8% of residents speak Spanish at home 150 35.2% Speak English very well276 64.8% Speak English less than very well77.4% of residents speak other language at home 1,236 47.9% Speak English very well1,347 52.1% Speak English less than very well
White (Caucasian) - Speak only English Native:
75.3% (3,818)Foreign-born:
24.1% (391)
White (Caucasian) - Speak another language Native:
20.6% (1,042)Foreign-born:
74.7% (1,214)
Asian - Speak only English Native:
27.1% (125)Foreign-born:
2.9% (26)
Asian - Speak another language Native:
71.4% (329)Foreign-born:
99.5% (889)
Other race - Speak another language Native:
62.6% (346)Foreign-born:
100.0% (170)
White alone - Speak only English Native:
77.3% (3,778)Foreign-born:
22.1% (415)
White alone - Speak another language Native:
21.0% (1,027)Foreign-born:
78.1% (1,464)
Hispanic or Latino - Speak another language Native:
72.2% (467)Foreign-born:
100.0% (427)
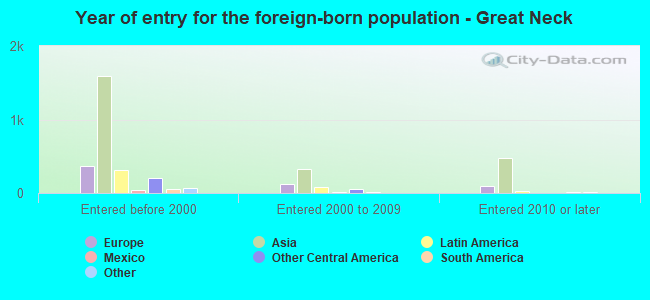
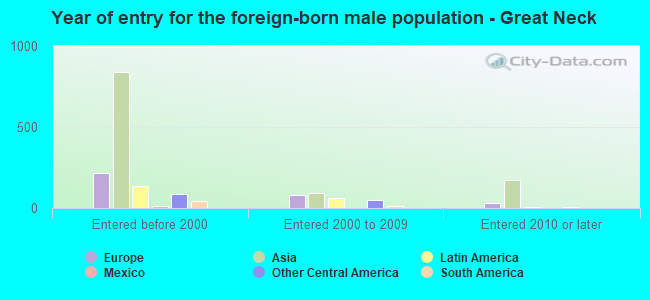
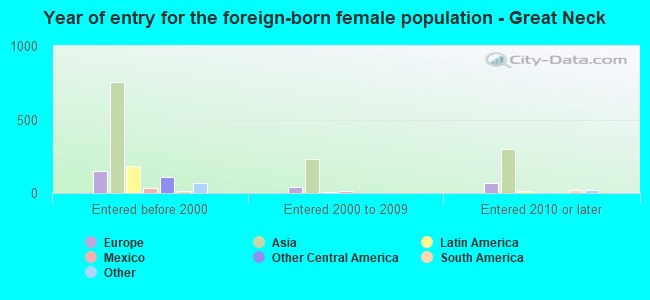
Foreign-born residents in Great Neck 3,253 residents are foreign born (19.8% Asia , 5.2% Europe , 4.0% Latin America ).
This city:
29.5%New York:
22.6%
Marital status for residents in Great Neck Marital status - White (Caucasian) population 15 years and over
Males 22.6% Never married69.4% Now married0.4% Separated2.4% Widowed5.3% DivorcedFemales 21.7% Never married59.7% Now married0.2% Separated11.0% Widowed7.4% DivorcedWomen who gave birth in the past 12 months Now married:
100.0% (119)Unmarried:
0.0% (0)
Women who did not give birth in the past 12 months Now married:
53.1% (651)Unmarried:
46.9% (574)
Marital status - Black or African American population 15 years and over
Males 4.7% Never married95.3% Now married0.0% Separated0.0% Widowed0.0% DivorcedFemales 26.5% Never married54.4% Now married0.0% Separated19.1% Widowed0.0% DivorcedWomen who did not give birth in the past 12 months Now married:
0.0% (0)Unmarried:
100.0% (17)
Marital status - Asian population 15 years and over
Males 6.8% Never married91.8% Now married0.0% Separated1.5% Widowed0.0% DivorcedFemales 30.3% Never married61.2% Now married0.0% Separated2.1% Widowed6.4% DivorcedWomen who gave birth in the past 12 months Now married:
100.0% (4)Unmarried:
0.0% (0)
Women who did not give birth in the past 12 months Now married:
53.0% (206)Unmarried:
47.0% (183)
Marital status - Other race population 15 years and over
Males 35.4% Never married64.6% Now married0.0% Separated0.0% Widowed0.0% DivorcedFemales 24.0% Never married69.4% Now married0.0% Separated0.0% Widowed6.6% DivorcedWomen who gave birth in the past 12 months Now married:
100.0% (18)Unmarried:
0.0% (0)
Women who did not give birth in the past 12 months Now married:
59.7% (94)Unmarried:
40.3% (64)
Marital status - Two or more races population 15 years and over
Males 14.5% Never married50.9% Now married0.0% Separated14.5% Widowed20.1% DivorcedFemales 20.5% Never married59.8% Now married0.0% Separated0.0% Widowed19.7% DivorcedWomen who did not give birth in the past 12 months Now married:
46.7% (32)Unmarried:
53.3% (36)
Marital status - White alone, not Hispanic / Latino population 15 years and over
Males 23.4% Never married68.2% Now married0.4% Separated2.5% Widowed5.6% DivorcedFemales 22.0% Never married60.1% Now married0.2% Separated10.7% Widowed6.9% DivorcedWomen who gave birth in the past 12 months Now married:
100.0% (127)Unmarried:
0.0% (0)
Women who did not give birth in the past 12 months Now married:
53.8% (652)Unmarried:
46.2% (559)
Marital status - Hispanic or Latino population 15 years and over
Males 22.3% Never married60.0% Now married0.0% Separated7.4% Widowed10.3% DivorcedFemales 26.2% Never married53.0% Now married0.0% Separated7.7% Widowed13.1% DivorcedWomen who did not give birth in the past 12 months Now married:
44.6% (99)Unmarried:
55.4% (123)
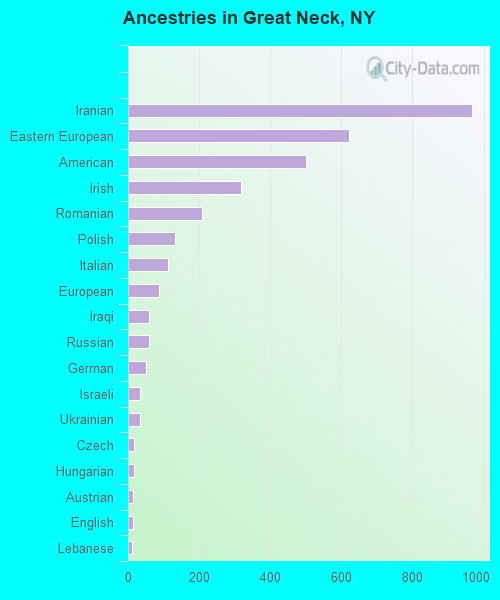
Ancestries in Great Neck
967 15.7% Iranian621 10.1% Eastern European502 8.1% American318 5.2% Irish207 3.4% Romanian132 2.1% Polish112 1.8% Italian87 1.4% European58 0.9% Iraqi58 0.9% Russian52 0.8% German35 0.6% Israeli33 0.5% Ukrainian18 0.3% Czech17 0.3% Hungarian13 0.2% Austrian13 0.2% English12 0.2% Lebanese8 0.1% Canadian
Children Nativity (place of birth) in Great Neck
Children under 6 years - Living with two parents Both parents native 666 100.0% NativeBoth parents foreign-born 257 92.7% Native20 7.3% Foreign-bornOne native, one foreign-born parent 496 100.0% NativeChildren under 6 years - Living with one parent Native parent 114 100.0% NativeForeign-born parent 58 100.0% NativeChildren 6 to 17 years - Living with two parents Both parents native 444 100.0% NativeBoth parents foreign-born 670 95.1% Native34 4.9% Foreign-bornOne native, one foreign-born parent 735 100.0% NativeChildren 6 to 17 years - Living with one parent Native parent 104 100.0% NativeForeign-born parent 90 47.2% Native100 52.8% Foreign-born
Grandparents responsible for own grandchildren in Great Neck
Grandparents (30 to 59 years) White / Caucasian 33 54.6% Responsible for grandchildren27 45.4% Not responsible for grandchildrenOther race 28 100.0% Responsible for grandchildrenHispanic or Latino 64 66.2% Responsible for grandchildren33 33.8% Not responsible for grandchildrenGrandparents (60 years and over) White / Caucasian 21 35.3% Responsible for grandchildren38 64.7% Not responsible for grandchildrenOther race 41 100.0% Responsible for grandchildrenHispanic or Latino 69 100.0% Responsible for grandchildren