Races in Greater Upper Marlboro, Maryland (MD) Detailed Stats
Ancestries, Foreign-born residents, place of birth

Recent posts about races in Greater Upper Marlboro, Maryland on our local forum with over 2,400,000 registered users:

3.8% of Greater Upper Marlboro, MD residents are foreign-born (1.4% born in Latin America, 1.0% born in Asia, 0.8% born in Africa, 0.5% born in Europe), which is 323.6% less than the foreign-born rate of 16.0% across the entire state of Maryland.
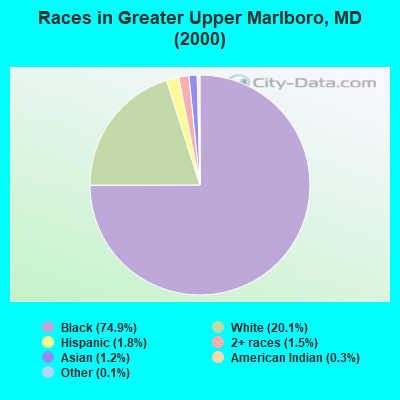
Race distribution in Greater Upper Marlboro

- 14,02074.9%Black alone
- 3,76620.1%White alone
- 3381.8%Hispanic
- 2841.5%Two or more races
- 2261.2%Asian alone
- 560.3%American Indian alone
- 230.1%Other race alone
- 70.04%Native Hawaiian and Other
Pacific Islander alone
2000
2022
-
- 3,286,54762.1%White alone
- 1,464,73527.7%Black alone
- 227,9164.3%Hispanic
- 209,7384.0%Asian alone
- 82,9461.6%Two or more races
- 13,3120.3%American Indian alone
- 9,3790.2%Other race alone
- 1,9130.04%Native Hawaiian and Other
Pacific Islander alone

-
- 2,906,49247.1%White alone
- 1,800,91429.2%Black alone
- 705,84211.4%Hispanic
- 401,8186.5%Asian alone
- 291,3174.7%Two or more races
- 46,9300.8%Other race alone
- 8,9300.1%American Indian alone
- 2,4170.04%Native Hawaiian and Other
Pacific Islander alone

Income and house value in Greater Upper Marlboro
- Median household income in 2022
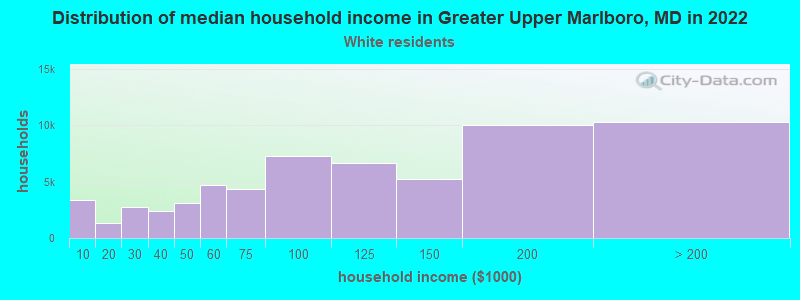
- $129,105White non-Hispanic householders
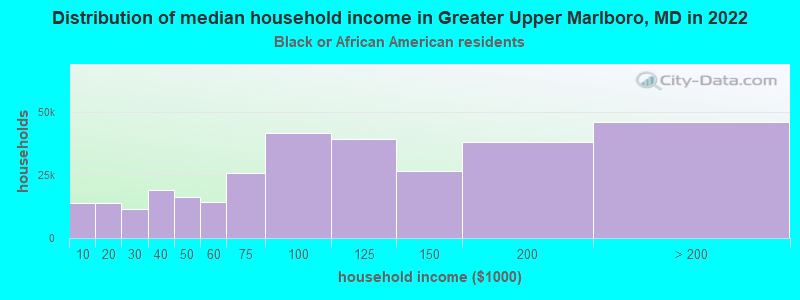
- $131,299Black householders
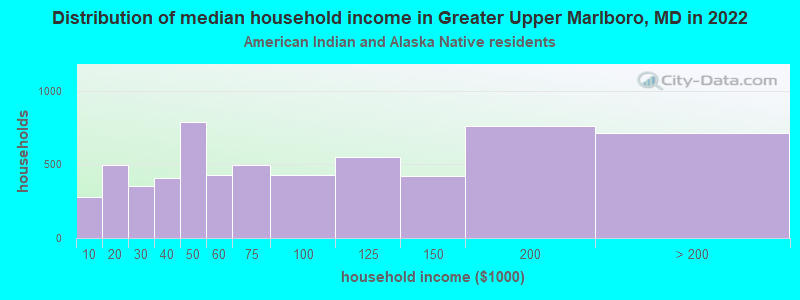
- $102,126American Indian and Alaska Native householders
- $176,021Asian householders
- $165,527Some other race householders
- $110,376Two or more races householders
- $96,221Hispanic or Latino race householders
- Median 2022 house value
- $442,246White Non-Hispanic householders
- $440,244Black or African American householders
- $338,188American Indian or Alaska Native householders
- $508,282Asian householders
- $393,075Some other race householders
- $505,995Two or more races householders
- $445,962Hispanic or Latino householders
Household income for White non-Hispanic householders
Household income for Black householders
Household income for American Indian and Alaska Native householders
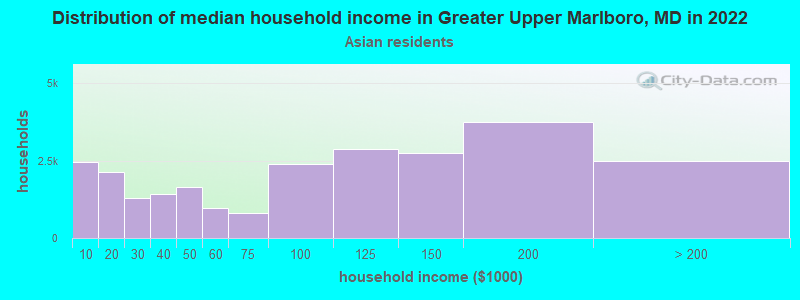
Household income for Asian householders
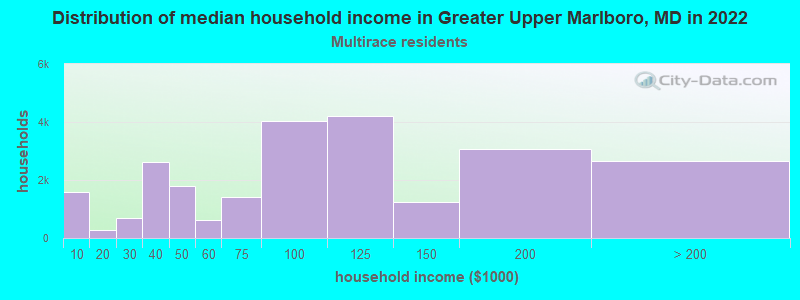
Household income for Two or more races householders
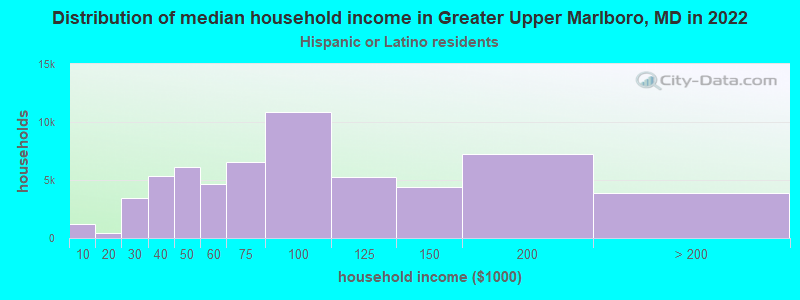
Household income for Hispanic or Latino race householders
Foreign-born residents in Greater Upper Marlboro
707 residents are foreign born (1.4% Latin America, 1.0% Asia, 0.8% Africa, 0.5% Europe).
| This city: | 3.8% |
| Maryland: | 9.8% |
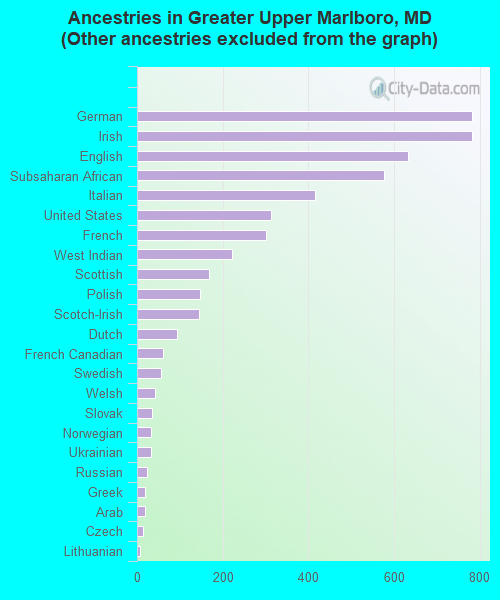
Ancestries in Greater Upper Marlboro

- 12,03671.0%Other
- 7834.6%German
- 7834.6%Irish
- 6333.7%English
- 5763.4%Subsaharan African
- 4152.4%Italian
- 3121.8%United States
- 3021.8%French
- 2231.3%West Indian
- 1691.0%Scottish
- 1460.9%Polish
- 1440.8%Scotch-Irish
- 930.5%Dutch
- 600.4%French Canadian
- 560.3%Swedish
- 430.3%Welsh
- 340.2%Slovak
- 330.2%Norwegian
- 320.2%Ukrainian
- 240.1%Russian
- 190.1%Greek
- 180.1%Arab
- 150.09%Czech
- 80.05%Lithuanian
- 60.04%Swiss
Zip codes: 20772.