Races in Greece, New York (NY) Detailed Stats
Data:
Races - White alone (%)
Races - White alone (% change since 2000)
Races - Black alone (%)
Races - Black alone (% change since 2000)
Races - American Indian alone (%)
Races - American Indian alone (% change since 2000)
Races - Asian alone (%)
Races - Asian alone (% change since 2000)
Races - Hispanic (%)
Races - Hispanic (% change since 2000)
Races - Native Hawaiian and Other Pacific Islander alone (%)
Races - Native Hawaiian and Other Pacific Islander alone (% change since 2000)
Races - Two or more races(%)
Races - Two or more races(% change since 2000)
Races - Other race alone (%)
Races - Other race alone (% change since 2000)
Racial diversity
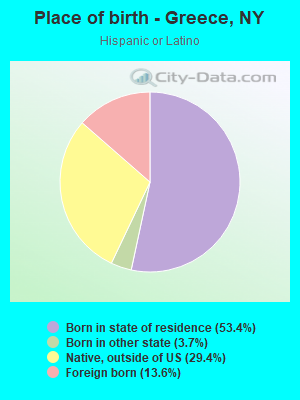
Place of birth - Born in state of residence (%)
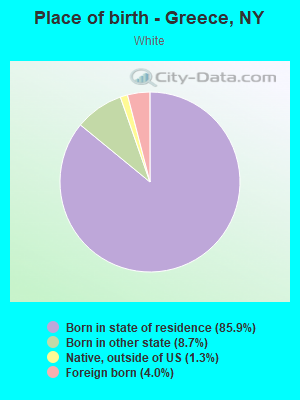
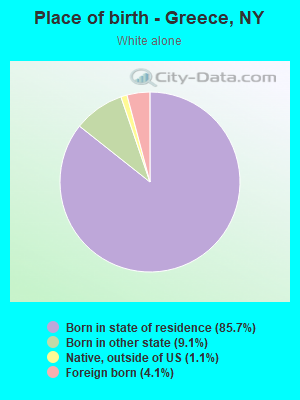
Place of birth - Born in state of residence (%) - White
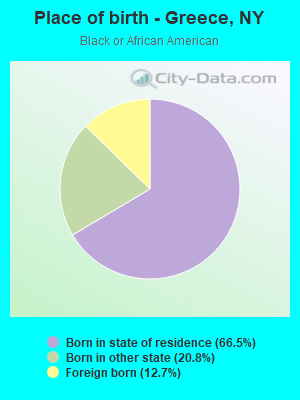
Place of birth - Born in state of residence (%) - Black or African American
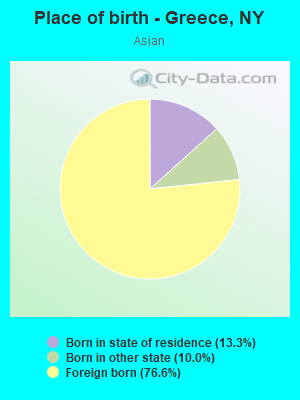
Place of birth - Born in state of residence (%) - Asian
Place of birth - Born in state of residence (%) - Hispanic or Latino
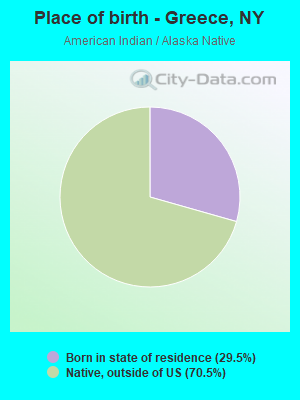
Place of birth - Born in state of residence (%) - American Indian and Alaska Native
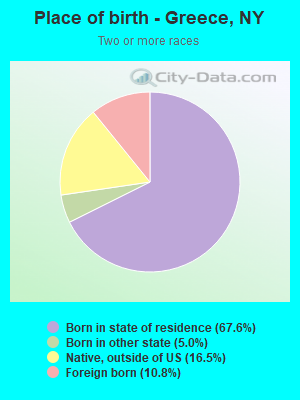
Place of birth - Born in state of residence (%) - Multirace
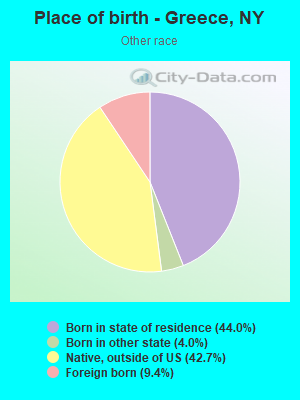
Place of birth - Born in state of residence (%) - Other Race
Place of birth - Born in other state (%)
Place of birth - Born in other state (%) - White
Place of birth - Born in other state (%) - Black or African American
Place of birth - Born in other state (%) - Asian
Place of birth - Born in other state (%) - Hispanic or Latino
Place of birth - Born in other state (%) - American Indian and Alaska Native
Place of birth - Born in other state (%) - Multirace
Place of birth - Born in other state (%) - Other Race
Place of birth - Native, outside of US (%)
Place of birth - Native, outside of US (%) - White
Place of birth - Native, outside of US (%) - Black or African American
Place of birth - Native, outside of US (%) - Asian
Place of birth - Native, outside of US (%) - Hispanic or Latino
Place of birth - Native, outside of US (%) - American Indian and Alaska Native
Place of birth - Native, outside of US (%) - Multirace
Place of birth - Native, outside of US (%) - Other Race
Place of birth - Foreign born (%)
Place of birth - Foreign born (%) - White
Place of birth - Foreign born (%) - Black or African American
Place of birth - Foreign born (%) - Asian
Place of birth - Foreign born (%) - Hispanic or Latino
Place of birth - Foreign born (%) - American Indian and Alaska Native
Place of birth - Foreign born (%) - Multirace
Place of birth - Foreign born (%) - Other Race
Residents speaking English at home (%)
Residents speaking English at home - Born in the United States (%)
Residents speaking English at home - Native, born elsewhere (%)
Residents speaking English at home - Foreign born (%)
Residents speaking Spanish at home (%)
Residents speaking Spanish at home - Born in the United States (%)
Residents speaking Spanish at home - Native, born elsewhere (%)
Residents speaking Spanish at home - Foreign born (%)
Residents speaking other language at home (%)
Residents speaking other language at home - Born in the United States (%)
Residents speaking other language at home - Native, born elsewhere (%)
Residents speaking other language at home - Foreign born (%)
Marital status - Never married (%)
Marital status - Now married (%)
Marital status - Separated (%)
Marital status - Widowed (%)
Marital status - Divorced (%)
Ancestries Reported - Arab (%)
Ancestries Reported - Czech (%)
Ancestries Reported - Danish (%)
Ancestries Reported - Dutch (%)
Ancestries Reported - English (%)
Ancestries Reported - French (%)
Ancestries Reported - French Canadian (%)
Ancestries Reported - German (%)
Ancestries Reported - Greek (%)
Ancestries Reported - Hungarian (%)
Ancestries Reported - Irish (%)
Ancestries Reported - Italian (%)
Ancestries Reported - Lithuanian (%)
Ancestries Reported - Norwegian (%)
Ancestries Reported - Polish (%)
Ancestries Reported - Portuguese (%)
Ancestries Reported - Russian (%)
Ancestries Reported - Scotch-Irish (%)
Ancestries Reported - Scottish (%)
Ancestries Reported - Slovak (%)
Ancestries Reported - Subsaharan African (%)
Ancestries Reported - Swedish (%)
Ancestries Reported - Swiss (%)
Ancestries Reported - Ukrainian (%)
Ancestries Reported - United States (%)
Ancestries Reported - Welsh (%)
Ancestries Reported - West Indian (%)
Ancestries Reported - Other (%)
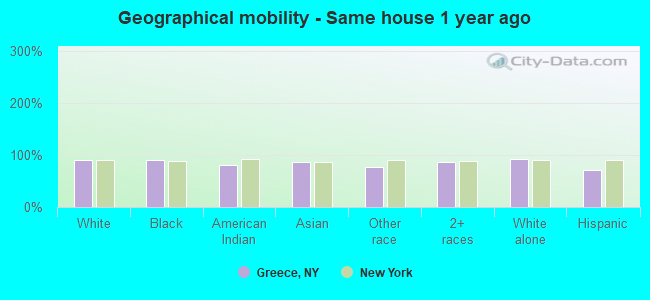
Geographical mobility - Same house 1 year ago (%)
Geographical mobility - Same house 1 year ago (%) - White
Geographical mobility - Same house 1 year ago (%) - Black or African American
Geographical mobility - Same house 1 year ago (%) - Asian
Geographical mobility - Same house 1 year ago (%) - Hispanic or Latino
Geographical mobility - Same house 1 year ago (%) - American Indian and Alaska Native
Geographical mobility - Same house 1 year ago (%) - Multirace
Geographical mobility - Same house 1 year ago (%) - Other Race
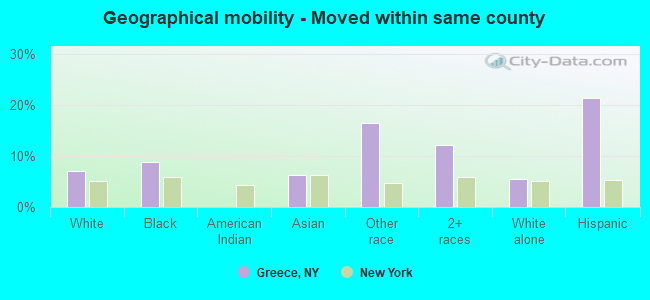
Geographical mobility - Moved within same county (%)
Geographical mobility - Moved within same county (%) - White
Geographical mobility - Moved within same county (%) - Black or African American
Geographical mobility - Moved within same county (%) - Asian
Geographical mobility - Moved within same county (%) - Hispanic or Latino
Geographical mobility - Moved within same county (%) - American Indian and Alaska Native
Geographical mobility - Moved within same county (%) - Multirace
Geographical mobility - Moved within same county (%) - Other Race
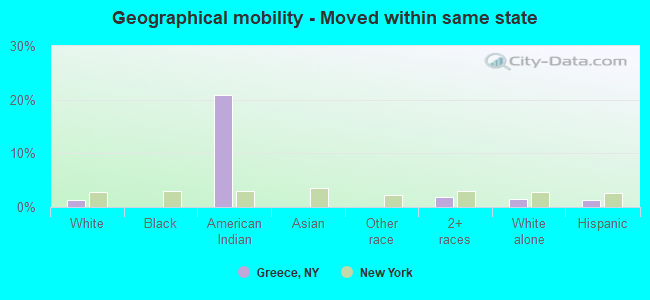
Geographical mobility - Moved from different county within same state (%)
Geographical mobility - Moved from different county within same state (%) - White
Geographical mobility - Moved from different county within same state (%) - Black or African American
Geographical mobility - Moved from different county within same state (%) - Asian
Geographical mobility - Moved from different county within same state (%) - Hispanic or Latino
Geographical mobility - Moved from different county within same state (%) - American Indian and Alaska Native
Geographical mobility - Moved from different county within same state (%) - Multirace
Geographical mobility - Moved from different county within same state (%) - Other Race
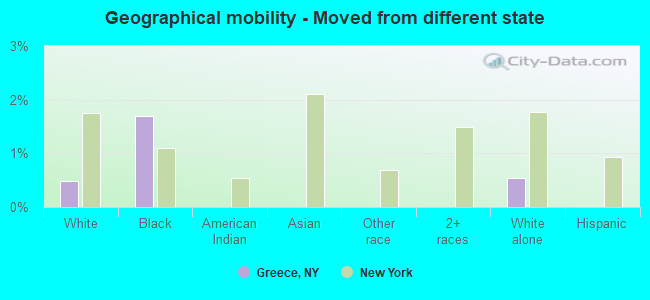
Geographical mobility - Moved from different state (%)
Geographical mobility - Moved from different state (%) - White
Geographical mobility - Moved from different state (%) - Black or African American
Geographical mobility - Moved from different state (%) - Asian
Geographical mobility - Moved from different state (%) - Hispanic or Latino
Geographical mobility - Moved from different state (%) - American Indian and Alaska Native
Geographical mobility - Moved from different state (%) - Multirace
Geographical mobility - Moved from different state (%) - Other Race
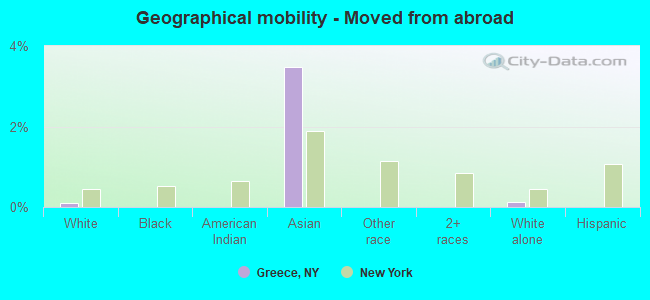
Geographical mobility - Moved from abroad (%)
Geographical mobility - Moved from abroad (%) - White
Geographical mobility - Moved from abroad (%) - Black or African American
Geographical mobility - Moved from abroad (%) - Asian
Geographical mobility - Moved from abroad (%) - Hispanic or Latino
Geographical mobility - Moved from abroad (%) - American Indian and Alaska Native
Geographical mobility - Moved from abroad (%) - Multirace
Geographical mobility - Moved from abroad (%) - Other Race
Place of birth for the foreign-born population - Ireland (%)
Place of birth for the foreign-born population - Denmark (%)
Place of birth for the foreign-born population - Norway (%)
Place of birth for the foreign-born population - Sweden (%)
Place of birth for the foreign-born population - United Kingdom (%)
Place of birth for the foreign-born population - England (%)
Place of birth for the foreign-born population - Scotland (%)
Place of birth for the foreign-born population - Other Northern Europe (%)
Place of birth for the foreign-born population - Austria (%)
Place of birth for the foreign-born population - Belgium (%)
Place of birth for the foreign-born population - France (%)
Place of birth for the foreign-born population - Germany (%)
Place of birth for the foreign-born population - Netherlands (%)
Place of birth for the foreign-born population - Switzerland (%)
Place of birth for the foreign-born population - Other Western Europe (%)
Place of birth for the foreign-born population - Greece (%)
Place of birth for the foreign-born population - Italy (%)
Place of birth for the foreign-born population - Portugal (%)
Place of birth for the foreign-born population - Spain (%)
Place of birth for the foreign-born population - Other Southern Europe (%)
Place of birth for the foreign-born population - Albania (%)
Place of birth for the foreign-born population - Belarus (%)
Place of birth for the foreign-born population - Bosnia and Herzegovina (%)
Place of birth for the foreign-born population - Bulgaria (%)
Place of birth for the foreign-born population - Croatia (%)
Place of birth for the foreign-born population - Czechoslovakia (%)
Place of birth for the foreign-born population - Hungary (%)
Place of birth for the foreign-born population - Latvia (%)
Place of birth for the foreign-born population - Lithuania (%)
Place of birth for the foreign-born population - North Macedonia (Macedonia) (%)
Place of birth for the foreign-born population - Moldova (%)
Place of birth for the foreign-born population - Poland (%)
Place of birth for the foreign-born population - Romania (%)
Place of birth for the foreign-born population - Russia (%)
Place of birth for the foreign-born population - Serbia (%)
Place of birth for the foreign-born population - Ukraine (%)
Place of birth for the foreign-born population - Other Eastern Europe (%)
Place of birth for the foreign-born population - China (%)
Place of birth for the foreign-born population - Hong Kong (%)
Place of birth for the foreign-born population - Taiwan (%)
Place of birth for the foreign-born population - Japan (%)
Place of birth for the foreign-born population - Korea (%)
Place of birth for the foreign-born population - Other Eastern Asia (%)
Place of birth for the foreign-born population - Afghanistan (%)
Place of birth for the foreign-born population - Bangladesh (%)
Place of birth for the foreign-born population - India (%)
Place of birth for the foreign-born population - Iran (%)
Place of birth for the foreign-born population - Kazakhstan (%)
Place of birth for the foreign-born population - Nepal (%)
Place of birth for the foreign-born population - Pakistan (%)
Place of birth for the foreign-born population - Sri Lanka (%)
Place of birth for the foreign-born population - Uzbekistan (%)
Place of birth for the foreign-born population - Other South Central Asia (%)
Place of birth for the foreign-born population - Burma (%)
Place of birth for the foreign-born population - Cambodia (%)
Place of birth for the foreign-born population - Indonesia (%)
Place of birth for the foreign-born population - Laos (%)
Place of birth for the foreign-born population - Malaysia (%)
Place of birth for the foreign-born population - Philippines (%)
Place of birth for the foreign-born population - Singapore (%)
Place of birth for the foreign-born population - Thailand (%)
Place of birth for the foreign-born population - Vietnam (%)
Place of birth for the foreign-born population - Other South Eastern Asia (%)
Place of birth for the foreign-born population - Armenia (%)
Place of birth for the foreign-born population - Iraq (%)
Place of birth for the foreign-born population - Israel (%)
Place of birth for the foreign-born population - Jordan (%)
Place of birth for the foreign-born population - Kuwait (%)
Place of birth for the foreign-born population - Lebanon (%)
Place of birth for the foreign-born population - Saudi Arabia (%)
Place of birth for the foreign-born population - Syria (%)
Place of birth for the foreign-born population - Turkey (%)
Place of birth for the foreign-born population - Yemen (%)
Place of birth for the foreign-born population - Other Western Asia (%)
Place of birth for the foreign-born population - Eritrea (%)
Place of birth for the foreign-born population - Ethiopia (%)
Place of birth for the foreign-born population - Kenya (%)
Place of birth for the foreign-born population - Somalia (%)
Place of birth for the foreign-born population - Uganda (%)
Place of birth for the foreign-born population - Zimbabwe (%)
Place of birth for the foreign-born population - Other Eastern Africa (%)
Place of birth for the foreign-born population - Cameroon (%)
Place of birth for the foreign-born population - Congo (%)
Place of birth for the foreign-born population - Democratic Republic of Congo (Zaire) (%)
Place of birth for the foreign-born population - Other Middle Africa (%)
Place of birth for the foreign-born population - Egypt (%)
Place of birth for the foreign-born population - Morocco (%)
Place of birth for the foreign-born population - Sudan (%)
Place of birth for the foreign-born population - Other Northern Africa (%)
Place of birth for the foreign-born population - South Africa (%)
Place of birth for the foreign-born population - Other Southern Africa (%)
Place of birth for the foreign-born population - Cabo Verde (%)
Place of birth for the foreign-born population - Ghana (%)
Place of birth for the foreign-born population - Liberia (%)
Place of birth for the foreign-born population - Nigeria (%)
Place of birth for the foreign-born population - Senegal (%)
Place of birth for the foreign-born population - Sierra Leone (%)
Place of birth for the foreign-born population - Other Western Africa (%)
Place of birth for the foreign-born population - Australia (%)
Place of birth for the foreign-born population - New Zealand (%)
Place of birth for the foreign-born population - Fiji (%)
Place of birth for the foreign-born population - Micronesia (%)
Place of birth for the foreign-born population - Bahamas (%)
Place of birth for the foreign-born population - Barbados (%)
Place of birth for the foreign-born population - Cuba (%)
Place of birth for the foreign-born population - Dominica (%)
Place of birth for the foreign-born population - Dominican Republic (%)
Place of birth for the foreign-born population - Grenada (%)
Place of birth for the foreign-born population - Haiti (%)
Place of birth for the foreign-born population - Jamaica (%)
Place of birth for the foreign-born population - St. Vincent and the Grenadines (%)
Place of birth for the foreign-born population - Trinidad and Tobago (%)
Place of birth for the foreign-born population - West Indies (%)
Place of birth for the foreign-born population - Other Caribbean (%)
Place of birth for the foreign-born population - Belize (%)
Place of birth for the foreign-born population - Costa Rica (%)
Place of birth for the foreign-born population - El Salvador (%)
Place of birth for the foreign-born population - Guatemala (%)
Place of birth for the foreign-born population - Honduras (%)
Place of birth for the foreign-born population - Mexico (%)
Place of birth for the foreign-born population - Nicaragua (%)
Place of birth for the foreign-born population - Panama (%)
Place of birth for the foreign-born population - Other Central America (%)
Place of birth for the foreign-born population - Argentina (%)
Place of birth for the foreign-born population - Bolivia (%)
Place of birth for the foreign-born population - Brazil (%)
Place of birth for the foreign-born population - Chile (%)
Place of birth for the foreign-born population - Colombia (%)
Place of birth for the foreign-born population - Ecuador (%)
Place of birth for the foreign-born population - Guyana (%)
Place of birth for the foreign-born population - Peru (%)
Place of birth for the foreign-born population - Uruguay (%)
Place of birth for the foreign-born population - Venezuela (%)
Place of birth for the foreign-born population - Other South America (%)
Place of birth for the foreign-born population - Canada (%)
Place of birth for the foreign-born population - Other Northern America (%)
Place of birth for the foreign-born population - Other (%)
Latest news about races in Greece, NY collected exclusively by city-data.com from local newspapers, TV, and radio stations
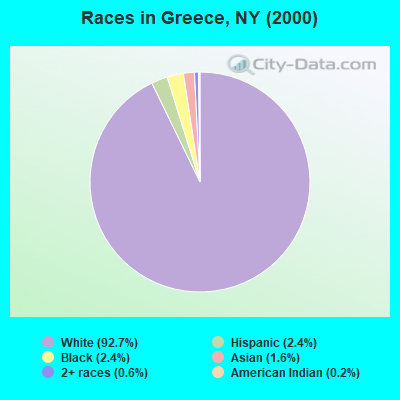
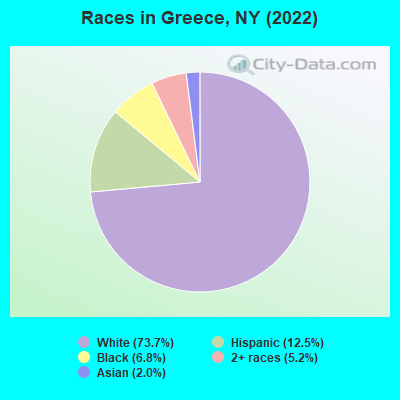
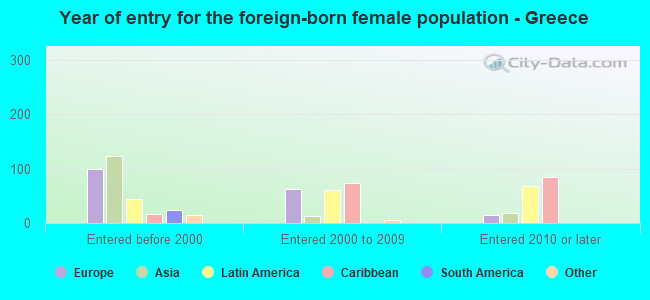
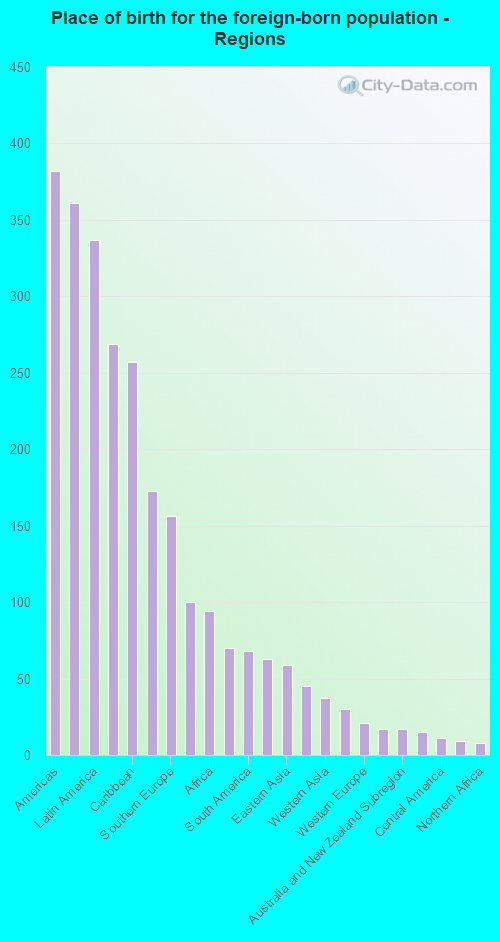
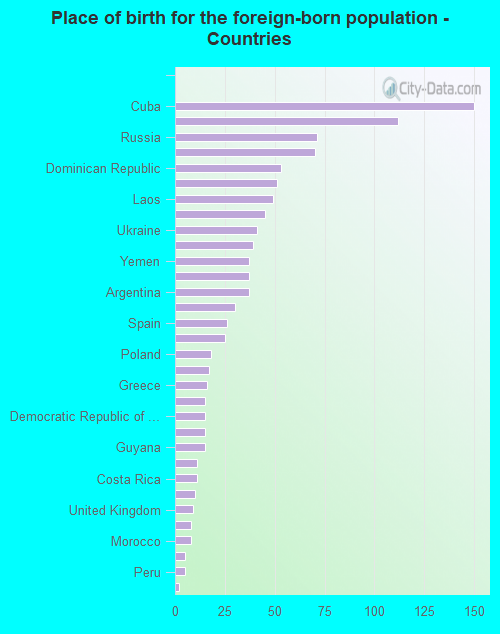
According to 2022 data, the most numerous races in Greece, NY are White alone (10,559 residents), Hispanic (1,793 residents), and Black alone (981 residents). 89.3% of Greece residents speak English at home. 7.9% of Greece, NY residents are foreign-born (2.5% born in Europe, 2.4% born in Latin America, 1.9% born in Asia), which is 180.1% less than the foreign-born rate of 22.0% across the entire state of New York.
Race distribution in Greece
2000 2022
11,760,981 62.0% White alone 2,867,583 15.1% Hispanic 2,812,623 14.8% Black alone 1,035,926 5.5% Asian alone 366,116 1.9% Two or more races 75,499 0.4% Other race alone 52,499 0.3% American Indian alone 5,230 0.03% Native Hawaiian and Other
10,408,933 52.9% White alone 3,867,299 19.7% Hispanic 2,633,840 13.4% Black alone 1,776,286 9.0% Asian alone 732,670 3.7% Two or more races 216,110 1.1% Other race alone 35,082 0.2% American Indian alone 6,931 0.04% Native Hawaiian and Other
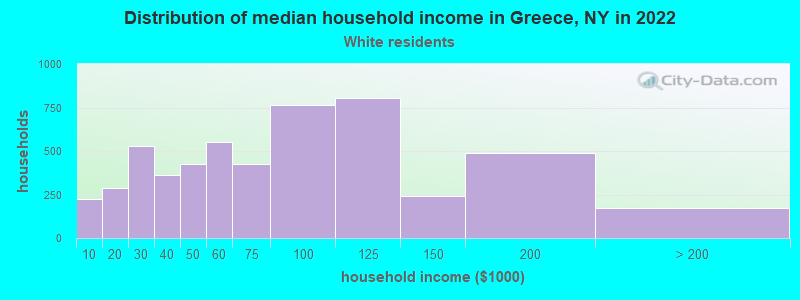
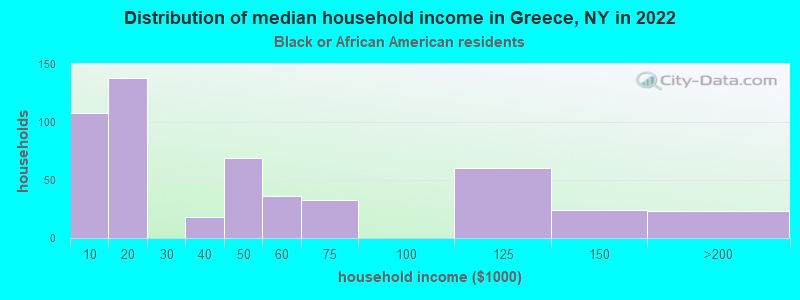
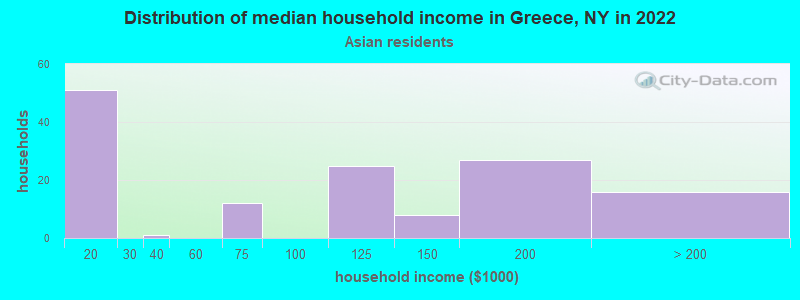
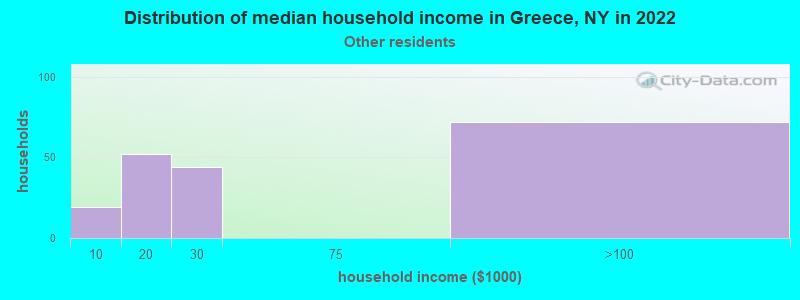
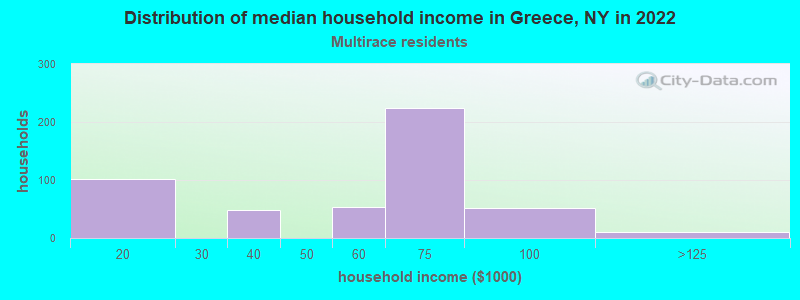
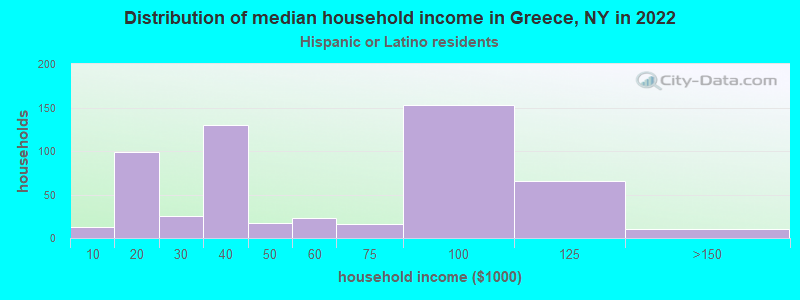
Income and house value in Greece Median household income in 2022 $67,912 White non-Hispanic householders$35,602 Black householders$65,154 Two or more races householders$54,676 Hispanic or Latino race householdersMedian 2022 house value $162,341 White Non-Hispanic householders$145,405 Black or African American householders $207,673 Asian householders$178,250 Some other race householders$156,696 Hispanic or Latino householders
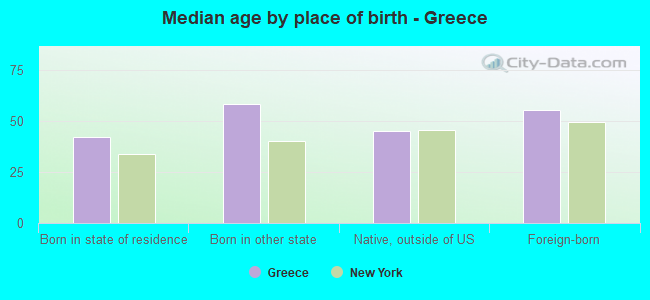
Median age by race in Greece
47.7 Median age for White residents44.0 50.2 48.6 Median age for Black or African American residents41.3 51.6 -813,263,524.5 Median age for American Indian / Alaska Native residents-801,381,691.8 -1,201,671,890.1 61.3 Median age for Asian residents39.7 69.3 -487,992,314.6 Median age for Native Hawaiian / Pacific Islander residents-477,502,295.2 -497,387,669.3 28.2 Median age for Other race residents27.4 32.2 24.2 Median age for Two or more races residents33.5 17.2 48.1 Median age for White alone residents46.0 50.0 35.3 Median age for Hispanic or Latino residents35.0 35.4
Owner/renter occupied households by race in Greece
House owners and renters - White residents 3,886 73.4% Owner occupied1,406 26.6% Renter occupiedHouse owners and renters - Black or African American residents 239 45.3% Owner occupied289 54.7% Renter occupiedHouse owners and renters - Asian residents 73 50.6% Owner occupied72 49.4% Renter occupiedHouse owners and renters - Other race residents 198 100.0% Renter occupiedHouse owners and renters - Two or more races residents 235 50.0% Owner occupied235 50.0% Renter occupiedHouse owners and renters - White alone residents 3,856 74.5% Owner occupied1,318 25.5% Renter occupiedHouse owners and renters - Hispanic or Latino residents 171 32.5% Owner occupied356 67.5% Renter occupied
Language usage in Greece
English speakers - Total 89.3% of residents of Greece speak English at home.
5.4% of residents speak Spanish at home 368 49.8% Speak English very well371 50.2% Speak English less than very well5.5% of residents speak other language at home 374 49.6% Speak English very well380 50.4% Speak English less than very well
English speakers - Born in the United States 97.1% of residents of Greece speak English at home.
4.4% of residents speak Spanish at home 6 10.5% Speak English very well51 89.5% Speak English less than very well
English speakers - Native, born elsewhere 38.8% of residents of Greece speak English at home.
58.7% of residents speak Spanish at home 154 45.4% Speak English very well185 54.6% Speak English less than very well2.6% of residents speak other language at home 10 66.7% Speak English very well5 33.3% Speak English less than very well
English speakers - Foreign-born 19.8% of residents of Greece speak English at home.
22.6% of residents speak Spanish at home 80 34.6% Speak English very well151 65.4% Speak English less than very well57.2% of residents speak other language at home 240 41.0% Speak English very well345 59.0% Speak English less than very well
White (Caucasian) - Speak only English Native:
99.1% (10,119)Foreign-born:
42.6% (188)
White (Caucasian) - Speak another language Native:
1.7% (169)Foreign-born:
52.6% (232)
Black or African American - Speak only English Native:
99.0% (816)Foreign-born:
7.7% (10)
Black or African American - Speak another language Native:
1.1% (9)Foreign-born:
95.6% (122)
Asian - Speak only English Native:
80.3% (54)Foreign-born:
6.1% (13)
Asian - Speak another language Native:
24.5% (17)Foreign-born:
95.6% (210)
Other race - Speak another language Native:
55.3% (216)Foreign-born:
100.0% (57)
Two or more races - Speak only English Native:
69.9% (795)Foreign-born:
13.8% (23)
Two or more races - Speak another language Native:
29.4% (335)Foreign-born:
86.7% (144)
White alone - Speak only English Native:
98.7% (9,685)Foreign-born:
45.5% (198)
White alone - Speak another language Native:
1.4% (136)Foreign-born:
51.6% (225)
Hispanic or Latino - Speak only English Native:
68.7% (953)Foreign-born:
7.5% (18)
Hispanic or Latino - Speak another language Native:
35.9% (498)Foreign-born:
92.3% (226)
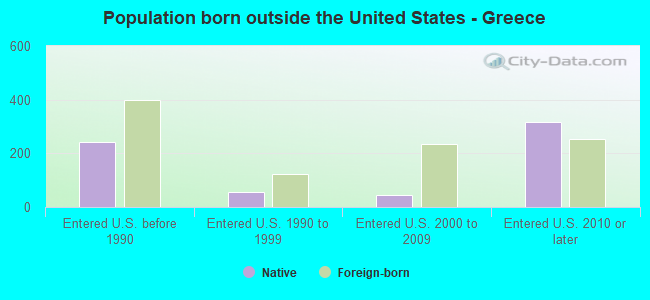
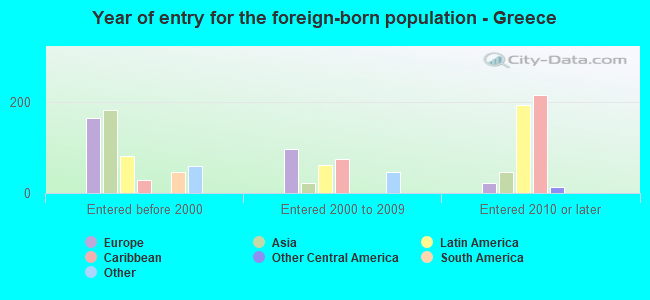
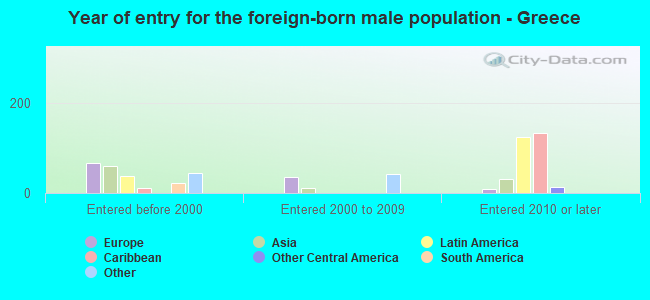
Foreign-born residents in Greece 1,125 residents are foreign born (2.5% Europe , 2.4% Latin America , 1.9% Asia ).
This city:
7.9%New York:
22.6%
Marital status for residents in Greece Marital status - White (Caucasian) population 15 years and over
Males 35.8% Never married46.2% Now married0.8% Separated2.0% Widowed15.2% DivorcedFemales 32.5% Never married40.7% Now married2.1% Separated8.4% Widowed16.2% DivorcedWomen who gave birth in the past 12 months Now married:
91.6% (101)Unmarried:
8.4% (9)
Women who did not give birth in the past 12 months Now married:
37.6% (858)Unmarried:
62.4% (1,422)
Marital status - Black or African American population 15 years and over
Males 20.7% Never married68.1% Now married0.0% Separated1.1% Widowed10.1% DivorcedFemales 53.4% Never married38.1% Now married0.0% Separated4.7% Widowed3.8% DivorcedWomen who gave birth in the past 12 months Now married:
100.0% (40)Unmarried:
0.0% (0)
Women who did not give birth in the past 12 months Now married:
27.4% (74)Unmarried:
72.6% (197)
Marital status - Asian population 15 years and over
Males 34.7% Never married39.8% Now married0.0% Separated0.0% Widowed25.5% DivorcedFemales 48.1% Never married26.8% Now married0.0% Separated14.2% Widowed10.9% DivorcedWomen who did not give birth in the past 12 months Now married:
34.5% (19)Unmarried:
65.5% (37)
Marital status - Other race population 15 years and over
Males 27.4% Never married57.9% Now married14.7% Separated0.0% Widowed0.0% DivorcedFemales 31.1% Never married30.5% Now married0.0% Separated1.2% Widowed37.1% DivorcedWomen who did not give birth in the past 12 months Now married:
40.8% (79)Unmarried:
59.2% (114)
Marital status - Two or more races population 15 years and over
Males 67.9% Never married25.8% Now married0.0% Separated4.2% Widowed2.1% DivorcedFemales 58.1% Never married8.1% Now married5.7% Separated13.2% Widowed14.9% DivorcedWomen who did not give birth in the past 12 months Now married:
13.1% (36)Unmarried:
86.9% (241)
Marital status - White alone, not Hispanic / Latino population 15 years and over
Males 34.1% Never married46.4% Now married0.6% Separated2.2% Widowed16.6% DivorcedFemales 31.5% Never married41.3% Now married2.2% Separated8.4% Widowed16.6% DivorcedWomen who gave birth in the past 12 months Now married:
91.6% (105)Unmarried:
8.4% (10)
Women who did not give birth in the past 12 months Now married:
39.5% (893)Unmarried:
60.5% (1,368)
Marital status - Hispanic or Latino population 15 years and over
Males 56.3% Never married36.5% Now married3.0% Separated2.3% Widowed1.9% DivorcedFemales 44.3% Never married26.3% Now married0.0% Separated10.3% Widowed19.1% DivorcedWomen who did not give birth in the past 12 months Now married:
17.2% (52)Unmarried:
82.8% (251)
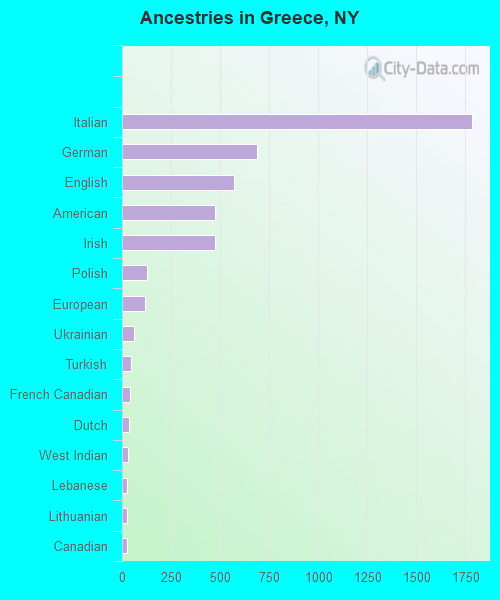
Ancestries in Greece
1,783 26.7% Italian687 10.3% German570 8.6% English474 7.1% American472 7.1% Irish127 1.9% Polish117 1.8% European60 0.9% Ukrainian48 0.7% Turkish41 0.6% French Canadian34 0.5% Dutch32 0.5% West Indian27 0.4% Lebanese26 0.4% Lithuanian24 0.4% Canadian15 0.2% Greek15 0.2% Haitian14 0.2% African13 0.2% Scottish11 0.2% Bulgarian11 0.2% Croatian10 0.2% Eastern European9 0.1% Jamaican8 0.1% Norwegian8 0.1% Slovene6 0.09% Scotch-Irish
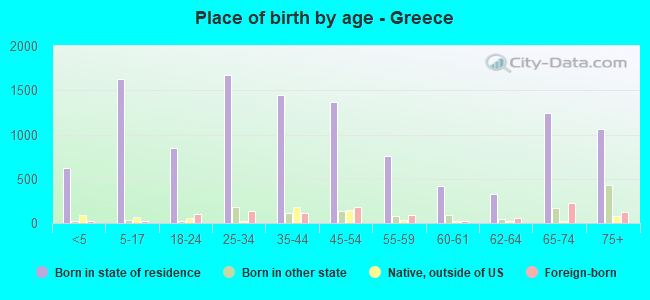
Children Nativity (place of birth) in Greece
Children under 6 years - Living with two parents Both parents native 278 97.2% Native8 2.8% Foreign-bornBoth parents foreign-born 50 91.5% Native5 8.5% Foreign-bornOne native, one foreign-born parent 371 100.0% NativeChildren under 6 years - Living with one parent Native parent 146 100.0% NativeChildren 6 to 17 years - Living with two parents Both parents native 913 100.0% NativeBoth parents foreign-born 26 80.6% Native6 19.4% Foreign-bornChildren 6 to 17 years - Living with one parent Native parent 564 100.0% NativeForeign-born parent 7 44.0% Native9 56.0% Foreign-born
Grandparents responsible for own grandchildren in Greece
Grandparents (30 to 59 years) White / Caucasian 5 7.9% Responsible for grandchildren63 92.1% Not responsible for grandchildrenTwo or more races 12 100.0% Responsible for grandchildrenWhite alone, not Hispanic / Latino 6 7.8% Responsible for grandchildren67 92.2% Not responsible for grandchildrenHispanic or Latino 5 100.0% Responsible for grandchildrenGrandparents (60 years and over) White / Caucasian 53 77.7% Responsible for grandchildren15 22.3% Not responsible for grandchildrenWhite alone, not Hispanic / Latino 56 78.2% Responsible for grandchildren16 21.8% Not responsible for grandchildren