Races in Green Acres, Washington (WA) Detailed Stats
Ancestries, Foreign-born residents, place of birth

Recent posts about races in Green Acres, Washington on our local forum with over 2,400,000 registered users:
 | Best area in Spokane to raise a family (258 replies) |
| What's it Like for Gays in Spokane? (13 replies) |
| Spokane -- how bad is "rush hour" traffic? (3 replies) |
3.2% of Green Acres, WA residents are foreign-born (1.4% born in Europe, 1.1% born in North America), which is 374.7% less than the foreign-born rate of 15.0% across the entire state of Washington.
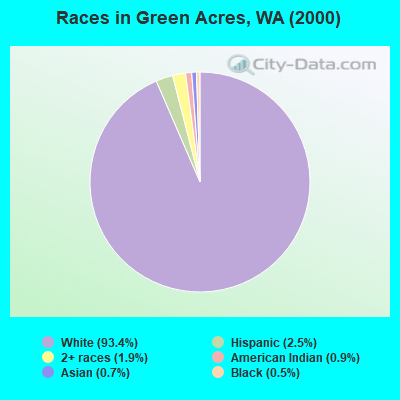
Race distribution in Green Acres

- 4,81793.4%White alone
- 1272.5%Hispanic
- 1001.9%Two or more races
- 480.9%American Indian alone
- 370.7%Asian alone
- 240.5%Black alone
- 40.08%Other race alone
- 10.02%Native Hawaiian and Other
Pacific Islander alone
2000
2022
-
- 4,652,49078.9%White alone
- 441,5097.5%Hispanic
- 319,4015.4%Asian alone
- 184,6313.1%Black alone
- 175,9263.0%Two or more races
- 85,3961.4%American Indian alone
- 22,7790.4%Native Hawaiian and Other
Pacific Islander alone - 11,9890.2%Other race alone

-
- 4,941,45663.5%White alone
- 1,093,31314.0%Hispanic
- 755,8329.7%Asian alone
- 523,4486.7%Two or more races
- 299,5373.8%Black alone
- 69,0240.9%American Indian alone
- 52,2310.7%Native Hawaiian and Other
Pacific Islander alone - 50,9450.7%Other race alone

Income and house value in Green Acres
- Median household income in 2022
- $67,919White non-Hispanic householders
- $95,460Black householders
- $91,358American Indian and Alaska Native householders
- $62,713Two or more races householders
- $43,822Hispanic or Latino race householders
- Median 2022 house value
- $371,035White Non-Hispanic householders
- $420,357Black or African American householders
- $205,508American Indian or Alaska Native householders
- $401,674Hispanic or Latino householders
Household income for White non-Hispanic householders

Household income for Black householders

Household income for American Indian and Alaska Native householders

Household income for Two or more races householders

Household income for Hispanic or Latino race householders

Foreign-born residents in Green Acres
163 residents are foreign born (1.4% Europe, 1.1% North America).
| This city: | 3.2% |
| Washington: | 10.4% |
Ancestries in Green Acres

- 1,28323.1%German
- 89416.1%Other
- 75713.6%Irish
- 58510.5%English
- 3095.6%Norwegian
- 2344.2%United States
- 2173.9%Swedish
- 1983.6%French
- 1552.8%Scottish
- 1492.7%Russian
- 1492.7%Scotch-Irish
- 1322.4%Dutch
- 1132.0%Italian
- 841.5%French Canadian
- 711.3%Polish
- 591.1%Welsh
- 531.0%Danish
- 230.4%Czech
- 200.4%Lithuanian
- 190.3%Hungarian
- 160.3%Greek
- 140.3%Swiss
- 90.2%Portuguese
- 90.2%Slovak
- 70.1%Ukrainian

Zip codes: 99016.