Races in Greenbelt, Maryland (MD) Detailed Stats
Data:
Races - White alone (%)
Races - White alone (% change since 2000)
Races - Black alone (%)
Races - Black alone (% change since 2000)
Races - American Indian alone (%)
Races - American Indian alone (% change since 2000)
Races - Asian alone (%)
Races - Asian alone (% change since 2000)
Races - Hispanic (%)
Races - Hispanic (% change since 2000)
Races - Native Hawaiian and Other Pacific Islander alone (%)
Races - Native Hawaiian and Other Pacific Islander alone (% change since 2000)
Races - Two or more races(%)
Races - Two or more races(% change since 2000)
Races - Other race alone (%)
Races - Other race alone (% change since 2000)
Racial diversity
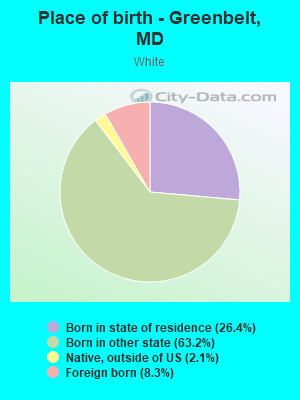
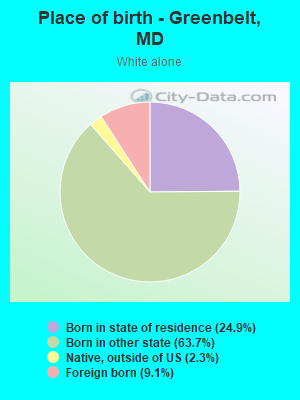
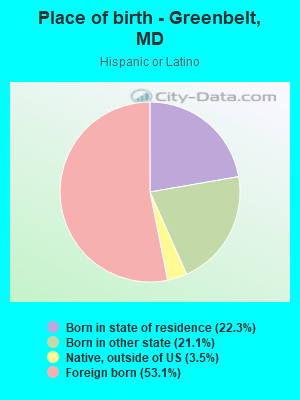
Place of birth - Born in state of residence (%)
Place of birth - Born in state of residence (%) - White
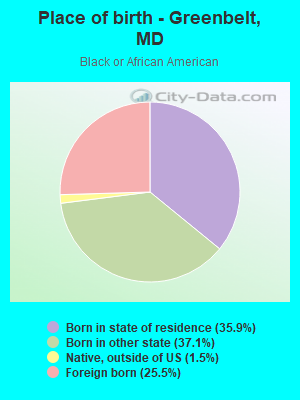
Place of birth - Born in state of residence (%) - Black or African American
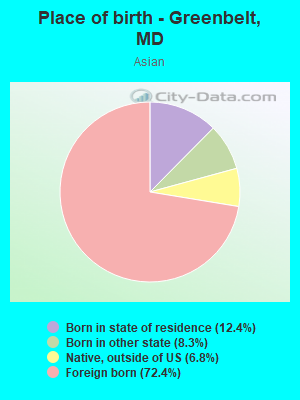
Place of birth - Born in state of residence (%) - Asian
Place of birth - Born in state of residence (%) - Hispanic or Latino
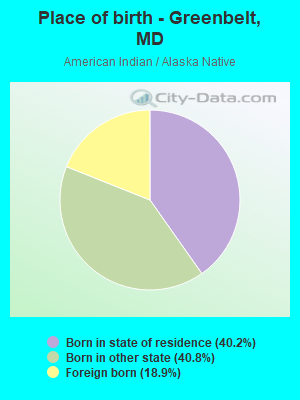
Place of birth - Born in state of residence (%) - American Indian and Alaska Native
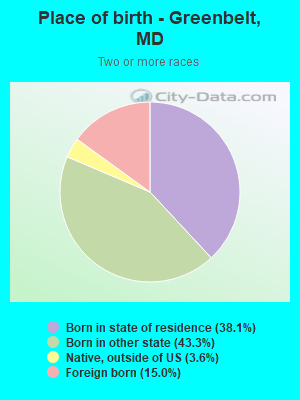
Place of birth - Born in state of residence (%) - Multirace
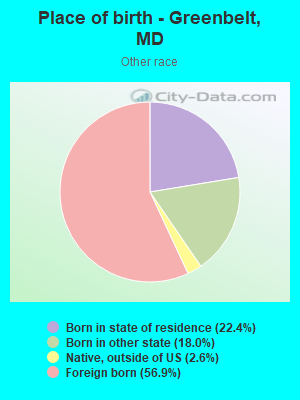
Place of birth - Born in state of residence (%) - Other Race
Place of birth - Born in other state (%)
Place of birth - Born in other state (%) - White
Place of birth - Born in other state (%) - Black or African American
Place of birth - Born in other state (%) - Asian
Place of birth - Born in other state (%) - Hispanic or Latino
Place of birth - Born in other state (%) - American Indian and Alaska Native
Place of birth - Born in other state (%) - Multirace
Place of birth - Born in other state (%) - Other Race
Place of birth - Native, outside of US (%)
Place of birth - Native, outside of US (%) - White
Place of birth - Native, outside of US (%) - Black or African American
Place of birth - Native, outside of US (%) - Asian
Place of birth - Native, outside of US (%) - Hispanic or Latino
Place of birth - Native, outside of US (%) - American Indian and Alaska Native
Place of birth - Native, outside of US (%) - Multirace
Place of birth - Native, outside of US (%) - Other Race
Place of birth - Foreign born (%)
Place of birth - Foreign born (%) - White
Place of birth - Foreign born (%) - Black or African American
Place of birth - Foreign born (%) - Asian
Place of birth - Foreign born (%) - Hispanic or Latino
Place of birth - Foreign born (%) - American Indian and Alaska Native
Place of birth - Foreign born (%) - Multirace
Place of birth - Foreign born (%) - Other Race
Residents speaking English at home (%)
Residents speaking English at home - Born in the United States (%)
Residents speaking English at home - Native, born elsewhere (%)
Residents speaking English at home - Foreign born (%)
Residents speaking Spanish at home (%)
Residents speaking Spanish at home - Born in the United States (%)
Residents speaking Spanish at home - Native, born elsewhere (%)
Residents speaking Spanish at home - Foreign born (%)
Residents speaking other language at home (%)
Residents speaking other language at home - Born in the United States (%)
Residents speaking other language at home - Native, born elsewhere (%)
Residents speaking other language at home - Foreign born (%)
Marital status - Never married (%)
Marital status - Now married (%)
Marital status - Separated (%)
Marital status - Widowed (%)
Marital status - Divorced (%)
Ancestries Reported - Arab (%)
Ancestries Reported - Czech (%)
Ancestries Reported - Danish (%)
Ancestries Reported - Dutch (%)
Ancestries Reported - English (%)
Ancestries Reported - French (%)
Ancestries Reported - French Canadian (%)
Ancestries Reported - German (%)
Ancestries Reported - Greek (%)
Ancestries Reported - Hungarian (%)
Ancestries Reported - Irish (%)
Ancestries Reported - Italian (%)
Ancestries Reported - Lithuanian (%)
Ancestries Reported - Norwegian (%)
Ancestries Reported - Polish (%)
Ancestries Reported - Portuguese (%)
Ancestries Reported - Russian (%)
Ancestries Reported - Scotch-Irish (%)
Ancestries Reported - Scottish (%)
Ancestries Reported - Slovak (%)
Ancestries Reported - Subsaharan African (%)
Ancestries Reported - Swedish (%)
Ancestries Reported - Swiss (%)
Ancestries Reported - Ukrainian (%)
Ancestries Reported - United States (%)
Ancestries Reported - Welsh (%)
Ancestries Reported - West Indian (%)
Ancestries Reported - Other (%)
Geographical mobility - Same house 1 year ago (%)
Geographical mobility - Same house 1 year ago (%) - White
Geographical mobility - Same house 1 year ago (%) - Black or African American
Geographical mobility - Same house 1 year ago (%) - Asian
Geographical mobility - Same house 1 year ago (%) - Hispanic or Latino
Geographical mobility - Same house 1 year ago (%) - American Indian and Alaska Native
Geographical mobility - Same house 1 year ago (%) - Multirace
Geographical mobility - Same house 1 year ago (%) - Other Race
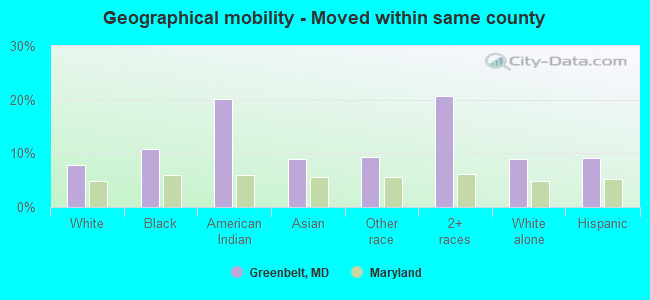
Geographical mobility - Moved within same county (%)
Geographical mobility - Moved within same county (%) - White
Geographical mobility - Moved within same county (%) - Black or African American
Geographical mobility - Moved within same county (%) - Asian
Geographical mobility - Moved within same county (%) - Hispanic or Latino
Geographical mobility - Moved within same county (%) - American Indian and Alaska Native
Geographical mobility - Moved within same county (%) - Multirace
Geographical mobility - Moved within same county (%) - Other Race
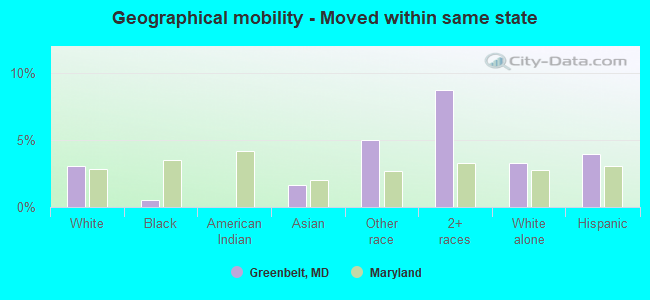
Geographical mobility - Moved from different county within same state (%)
Geographical mobility - Moved from different county within same state (%) - White
Geographical mobility - Moved from different county within same state (%) - Black or African American
Geographical mobility - Moved from different county within same state (%) - Asian
Geographical mobility - Moved from different county within same state (%) - Hispanic or Latino
Geographical mobility - Moved from different county within same state (%) - American Indian and Alaska Native
Geographical mobility - Moved from different county within same state (%) - Multirace
Geographical mobility - Moved from different county within same state (%) - Other Race
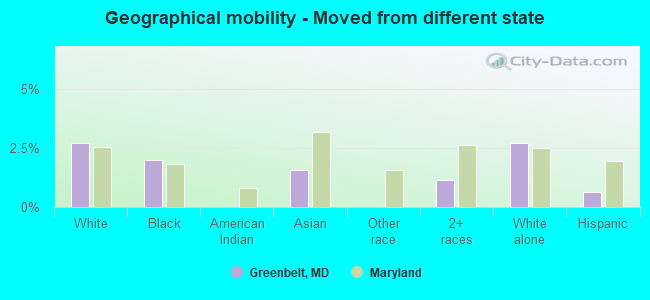
Geographical mobility - Moved from different state (%)
Geographical mobility - Moved from different state (%) - White
Geographical mobility - Moved from different state (%) - Black or African American
Geographical mobility - Moved from different state (%) - Asian
Geographical mobility - Moved from different state (%) - Hispanic or Latino
Geographical mobility - Moved from different state (%) - American Indian and Alaska Native
Geographical mobility - Moved from different state (%) - Multirace
Geographical mobility - Moved from different state (%) - Other Race
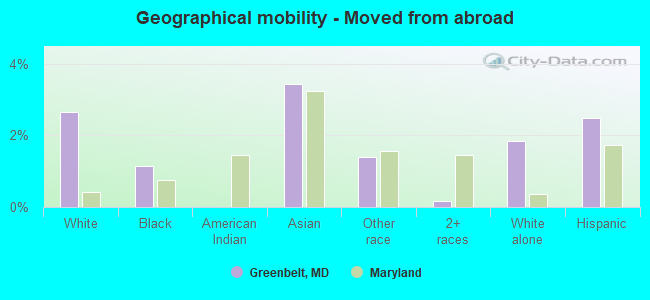
Geographical mobility - Moved from abroad (%)
Geographical mobility - Moved from abroad (%) - White
Geographical mobility - Moved from abroad (%) - Black or African American
Geographical mobility - Moved from abroad (%) - Asian
Geographical mobility - Moved from abroad (%) - Hispanic or Latino
Geographical mobility - Moved from abroad (%) - American Indian and Alaska Native
Geographical mobility - Moved from abroad (%) - Multirace
Geographical mobility - Moved from abroad (%) - Other Race
Place of birth for the foreign-born population - Ireland (%)
Place of birth for the foreign-born population - Denmark (%)
Place of birth for the foreign-born population - Norway (%)
Place of birth for the foreign-born population - Sweden (%)
Place of birth for the foreign-born population - United Kingdom (%)
Place of birth for the foreign-born population - England (%)
Place of birth for the foreign-born population - Scotland (%)
Place of birth for the foreign-born population - Other Northern Europe (%)
Place of birth for the foreign-born population - Austria (%)
Place of birth for the foreign-born population - Belgium (%)
Place of birth for the foreign-born population - France (%)
Place of birth for the foreign-born population - Germany (%)
Place of birth for the foreign-born population - Netherlands (%)
Place of birth for the foreign-born population - Switzerland (%)
Place of birth for the foreign-born population - Other Western Europe (%)
Place of birth for the foreign-born population - Greece (%)
Place of birth for the foreign-born population - Italy (%)
Place of birth for the foreign-born population - Portugal (%)
Place of birth for the foreign-born population - Spain (%)
Place of birth for the foreign-born population - Other Southern Europe (%)
Place of birth for the foreign-born population - Albania (%)
Place of birth for the foreign-born population - Belarus (%)
Place of birth for the foreign-born population - Bosnia and Herzegovina (%)
Place of birth for the foreign-born population - Bulgaria (%)
Place of birth for the foreign-born population - Croatia (%)
Place of birth for the foreign-born population - Czechoslovakia (%)
Place of birth for the foreign-born population - Hungary (%)
Place of birth for the foreign-born population - Latvia (%)
Place of birth for the foreign-born population - Lithuania (%)
Place of birth for the foreign-born population - North Macedonia (Macedonia) (%)
Place of birth for the foreign-born population - Moldova (%)
Place of birth for the foreign-born population - Poland (%)
Place of birth for the foreign-born population - Romania (%)
Place of birth for the foreign-born population - Russia (%)
Place of birth for the foreign-born population - Serbia (%)
Place of birth for the foreign-born population - Ukraine (%)
Place of birth for the foreign-born population - Other Eastern Europe (%)
Place of birth for the foreign-born population - China (%)
Place of birth for the foreign-born population - Hong Kong (%)
Place of birth for the foreign-born population - Taiwan (%)
Place of birth for the foreign-born population - Japan (%)
Place of birth for the foreign-born population - Korea (%)
Place of birth for the foreign-born population - Other Eastern Asia (%)
Place of birth for the foreign-born population - Afghanistan (%)
Place of birth for the foreign-born population - Bangladesh (%)
Place of birth for the foreign-born population - India (%)
Place of birth for the foreign-born population - Iran (%)
Place of birth for the foreign-born population - Kazakhstan (%)
Place of birth for the foreign-born population - Nepal (%)
Place of birth for the foreign-born population - Pakistan (%)
Place of birth for the foreign-born population - Sri Lanka (%)
Place of birth for the foreign-born population - Uzbekistan (%)
Place of birth for the foreign-born population - Other South Central Asia (%)
Place of birth for the foreign-born population - Burma (%)
Place of birth for the foreign-born population - Cambodia (%)
Place of birth for the foreign-born population - Indonesia (%)
Place of birth for the foreign-born population - Laos (%)
Place of birth for the foreign-born population - Malaysia (%)
Place of birth for the foreign-born population - Philippines (%)
Place of birth for the foreign-born population - Singapore (%)
Place of birth for the foreign-born population - Thailand (%)
Place of birth for the foreign-born population - Vietnam (%)
Place of birth for the foreign-born population - Other South Eastern Asia (%)
Place of birth for the foreign-born population - Armenia (%)
Place of birth for the foreign-born population - Iraq (%)
Place of birth for the foreign-born population - Israel (%)
Place of birth for the foreign-born population - Jordan (%)
Place of birth for the foreign-born population - Kuwait (%)
Place of birth for the foreign-born population - Lebanon (%)
Place of birth for the foreign-born population - Saudi Arabia (%)
Place of birth for the foreign-born population - Syria (%)
Place of birth for the foreign-born population - Turkey (%)
Place of birth for the foreign-born population - Yemen (%)
Place of birth for the foreign-born population - Other Western Asia (%)
Place of birth for the foreign-born population - Eritrea (%)
Place of birth for the foreign-born population - Ethiopia (%)
Place of birth for the foreign-born population - Kenya (%)
Place of birth for the foreign-born population - Somalia (%)
Place of birth for the foreign-born population - Uganda (%)
Place of birth for the foreign-born population - Zimbabwe (%)
Place of birth for the foreign-born population - Other Eastern Africa (%)
Place of birth for the foreign-born population - Cameroon (%)
Place of birth for the foreign-born population - Congo (%)
Place of birth for the foreign-born population - Democratic Republic of Congo (Zaire) (%)
Place of birth for the foreign-born population - Other Middle Africa (%)
Place of birth for the foreign-born population - Egypt (%)
Place of birth for the foreign-born population - Morocco (%)
Place of birth for the foreign-born population - Sudan (%)
Place of birth for the foreign-born population - Other Northern Africa (%)
Place of birth for the foreign-born population - South Africa (%)
Place of birth for the foreign-born population - Other Southern Africa (%)
Place of birth for the foreign-born population - Cabo Verde (%)
Place of birth for the foreign-born population - Ghana (%)
Place of birth for the foreign-born population - Liberia (%)
Place of birth for the foreign-born population - Nigeria (%)
Place of birth for the foreign-born population - Senegal (%)
Place of birth for the foreign-born population - Sierra Leone (%)
Place of birth for the foreign-born population - Other Western Africa (%)
Place of birth for the foreign-born population - Australia (%)
Place of birth for the foreign-born population - New Zealand (%)
Place of birth for the foreign-born population - Fiji (%)
Place of birth for the foreign-born population - Micronesia (%)
Place of birth for the foreign-born population - Bahamas (%)
Place of birth for the foreign-born population - Barbados (%)
Place of birth for the foreign-born population - Cuba (%)
Place of birth for the foreign-born population - Dominica (%)
Place of birth for the foreign-born population - Dominican Republic (%)
Place of birth for the foreign-born population - Grenada (%)
Place of birth for the foreign-born population - Haiti (%)
Place of birth for the foreign-born population - Jamaica (%)
Place of birth for the foreign-born population - St. Vincent and the Grenadines (%)
Place of birth for the foreign-born population - Trinidad and Tobago (%)
Place of birth for the foreign-born population - West Indies (%)
Place of birth for the foreign-born population - Other Caribbean (%)
Place of birth for the foreign-born population - Belize (%)
Place of birth for the foreign-born population - Costa Rica (%)
Place of birth for the foreign-born population - El Salvador (%)
Place of birth for the foreign-born population - Guatemala (%)
Place of birth for the foreign-born population - Honduras (%)
Place of birth for the foreign-born population - Mexico (%)
Place of birth for the foreign-born population - Nicaragua (%)
Place of birth for the foreign-born population - Panama (%)
Place of birth for the foreign-born population - Other Central America (%)
Place of birth for the foreign-born population - Argentina (%)
Place of birth for the foreign-born population - Bolivia (%)
Place of birth for the foreign-born population - Brazil (%)
Place of birth for the foreign-born population - Chile (%)
Place of birth for the foreign-born population - Colombia (%)
Place of birth for the foreign-born population - Ecuador (%)
Place of birth for the foreign-born population - Guyana (%)
Place of birth for the foreign-born population - Peru (%)
Place of birth for the foreign-born population - Uruguay (%)
Place of birth for the foreign-born population - Venezuela (%)
Place of birth for the foreign-born population - Other South America (%)
Place of birth for the foreign-born population - Canada (%)
Place of birth for the foreign-born population - Other Northern America (%)
Place of birth for the foreign-born population - Other (%)
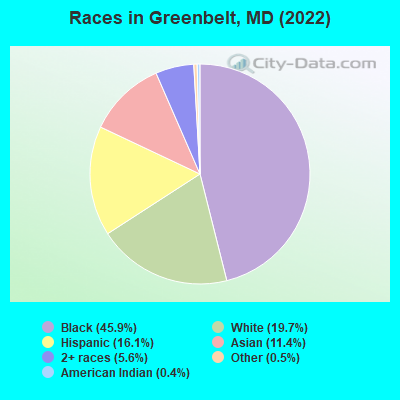
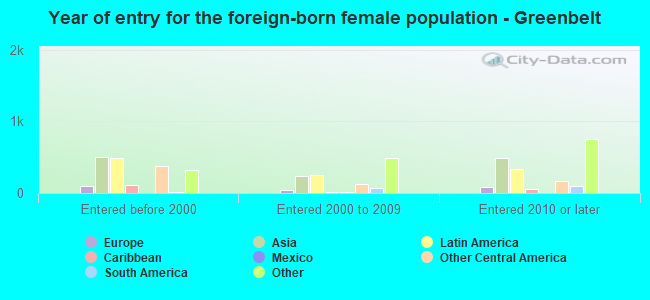
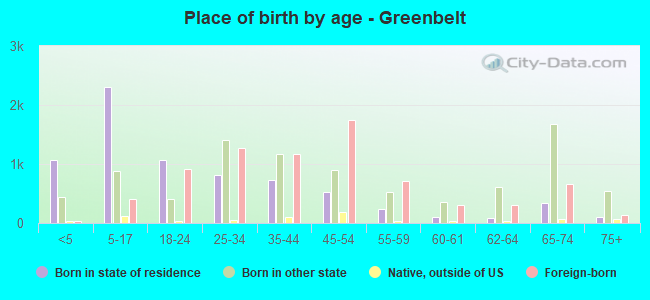
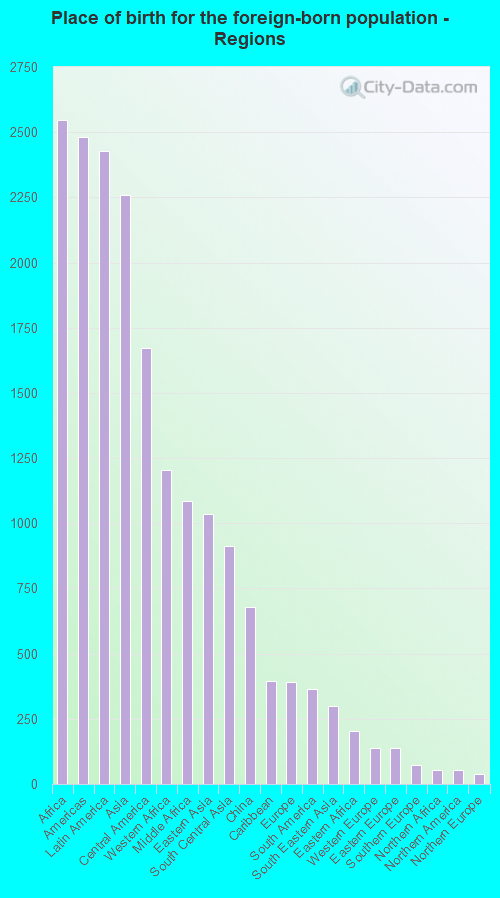
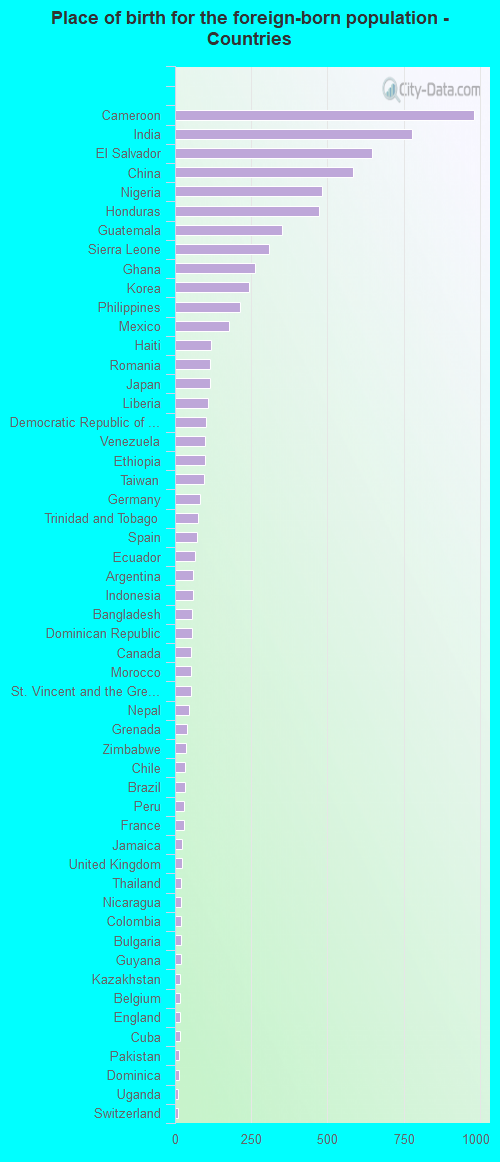
According to 2022 data, the most numerous races in Greenbelt, MD are White alone (4,808 residents), Black alone (11,185 residents), and Hispanic (3,935 residents). 64.9% of Greenbelt residents speak English at home. 31.5% of Greenbelt, MD residents are foreign-born (9.7% born in Africa, 9.2% born in Latin America, 8.6% born in Asia), which is 49.2% greater than the foreign-born rate of 16.0% across the entire state of Maryland.
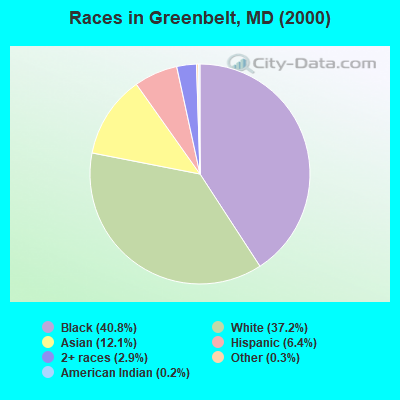
Race distribution in Greenbelt
2000 2022
3,286,547 62.1% White alone 1,464,735 27.7% Black alone 227,916 4.3% Hispanic 209,738 4.0% Asian alone 82,946 1.6% Two or more races 13,312 0.3% American Indian alone 9,379 0.2% Other race alone 1,913 0.04% Native Hawaiian and Other
2,906,492 47.1% White alone 1,800,914 29.2% Black alone 705,842 11.4% Hispanic 401,818 6.5% Asian alone 291,317 4.7% Two or more races 46,930 0.8% Other race alone 8,930 0.1% American Indian alone 2,417 0.04% Native Hawaiian and Other
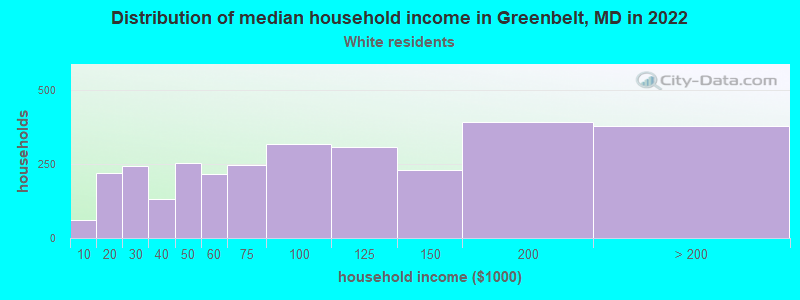
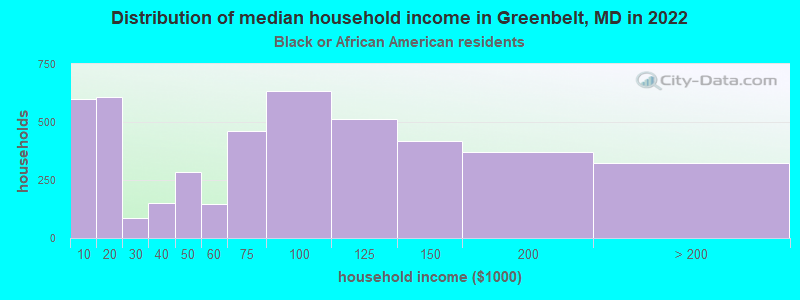
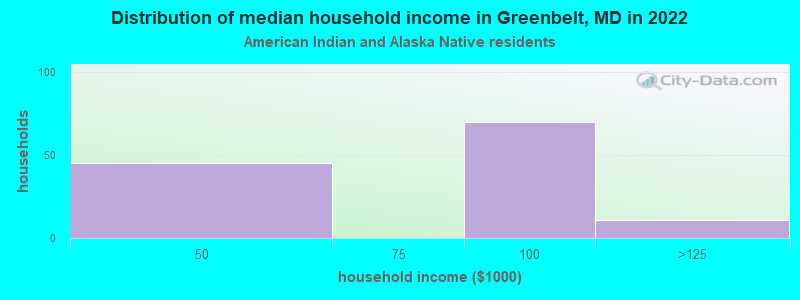
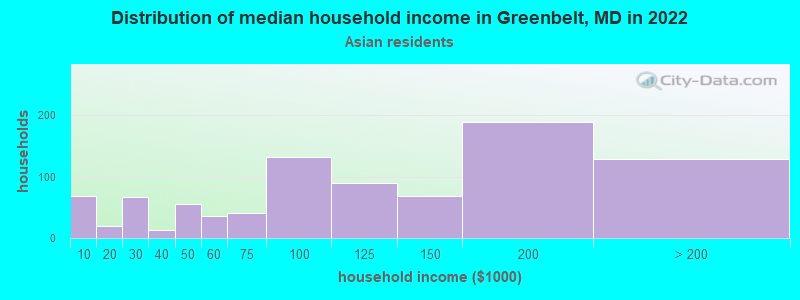
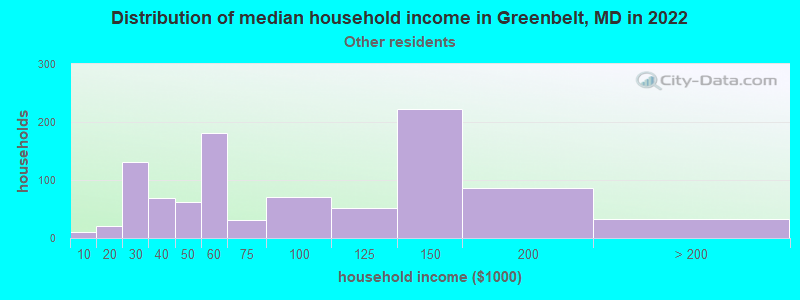
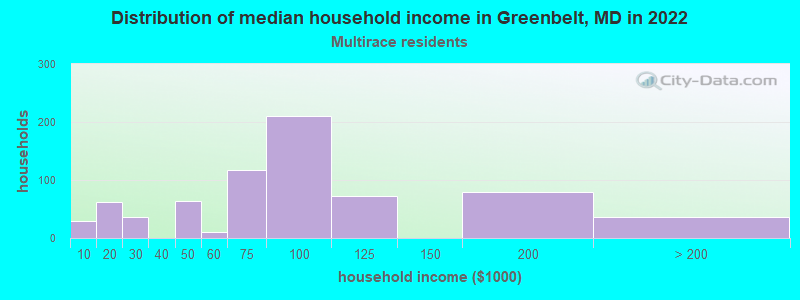
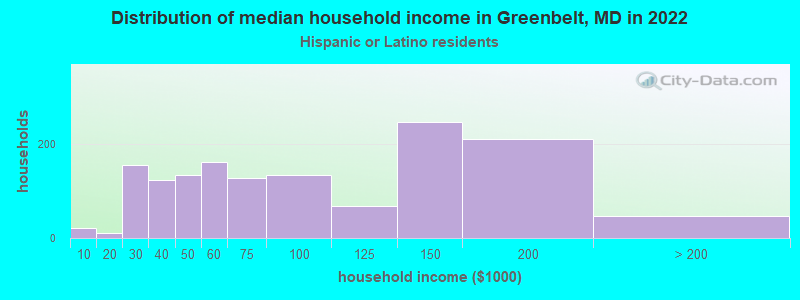
Income and house value in Greenbelt Median household income in 2022 $85,779 White non-Hispanic householders$74,809 Black householders$127,033 American Indian and Alaska Native householders$111,092 Asian householders$100,036 Some other race householders$66,452 Two or more races householders$75,707 Hispanic or Latino race householdersMedian 2022 house value $232,591 White Non-Hispanic householders$424,614 Black or African American householders$368,720 American Indian or Alaska Native householders $500,942 Asian householders$488,321 Some other race householders$505,750 Two or more races householders$467,586 Hispanic or Latino householders
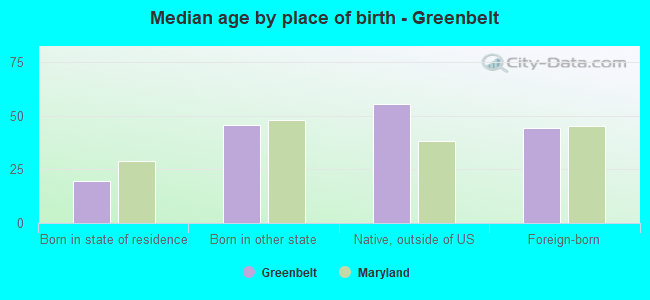
Median age by race in Greenbelt
51.8 Median age for White residents48.4 54.8 37.0 Median age for Black or African American residents32.7 41.3 87.9 Median age for American Indian / Alaska Native residents100.3 23.3 36.8 Median age for Asian residents31.2 49.1 -571,600,480.8 Median age for Native Hawaiian / Pacific Islander residents-720,061,021.4 -760,942,760.2 29.7 Median age for Other race residents23.3 35.6 29.8 Median age for Two or more races residents20.3 30.3 51.5 Median age for White alone residents47.7 54.4 32.5 Median age for Hispanic or Latino residents30.1 35.2
Owner/renter occupied households by race in Greenbelt
House owners and renters - White residents 2,053 68.5% Owner occupied944 31.5% Renter occupiedHouse owners and renters - Black or African American residents 1,692 37.7% Owner occupied2,799 62.3% Renter occupiedHouse owners and renters - American Indian / Alaska Native residents 129 77.9% Owner occupied36 22.1% Renter occupiedHouse owners and renters - Asian residents 698 75.9% Owner occupied222 24.1% Renter occupiedHouse owners and renters - Other race residents 320 32.4% Owner occupied668 67.6% Renter occupiedHouse owners and renters - Two or more races residents 336 41.4% Owner occupied476 58.6% Renter occupiedHouse owners and renters - White alone residents 2,030 70.7% Owner occupied839 29.3% Renter occupiedHouse owners and renters - Hispanic or Latino residents 531 36.5% Owner occupied922 63.5% Renter occupied
Language usage in Greenbelt
English speakers - Total 64.9% of residents of Greenbelt speak English at home.
13.0% of residents speak Spanish at home 1,490 50.1% Speak English very well1,483 49.9% Speak English less than very well22.8% of residents speak other language at home 3,385 65.1% Speak English very well1,816 34.9% Speak English less than very well
English speakers - Born in the United States 90.4% of residents of Greenbelt speak English at home.
5.5% of residents speak Spanish at home 367 79.4% Speak English very well95 20.6% Speak English less than very well4.5% of residents speak other language at home 362 95.3% Speak English very well18 4.7% Speak English less than very well
English speakers - Native, born elsewhere 83.0% of residents of Greenbelt speak English at home.
4.0% of residents speak Spanish at home 24 100.0% Speak English very well21.7% of residents speak other language at home 3 2.3% Speak English very well127 97.7% Speak English less than very well
English speakers - Foreign-born 19.7% of residents of Greenbelt speak English at home.
25.5% of residents speak Spanish at home 709 35.9% Speak English very well1,267 64.1% Speak English less than very well54.2% of residents speak other language at home 2,504 59.7% Speak English very well1,692 40.3% Speak English less than very well
White (Caucasian) - Speak only English Native:
94.3% (4,208)Foreign-born:
37.1% (146)
White (Caucasian) - Speak another language Native:
6.0% (268)Foreign-born:
67.7% (266)
Black or African American - Speak only English Native:
95.2% (7,363)Foreign-born:
31.7% (941)
Black or African American - Speak another language Native:
4.9% (378)Foreign-born:
69.1% (2,050)
American Indian / Alaska Native - Speak another language Native:
16.5% (30)Foreign-born:
99.9% (42)
Asian - Speak only English Native:
24.0% (131)Foreign-born:
14.1% (287)
Asian - Speak another language Native:
85.0% (464)Foreign-born:
85.9% (1,752)
Other race - Speak only English Native:
40.0% (376)Foreign-born:
2.6% (45)
Other race - Speak another language Native:
63.5% (597)Foreign-born:
97.4% (1,647)
Two or more races - Speak only English Native:
84.6% (1,288)Foreign-born:
37.3% (109)
Two or more races - Speak another language Native:
14.7% (224)Foreign-born:
58.7% (171)
White alone - Speak only English Native:
95.9% (4,108)Foreign-born:
37.9% (163)
White alone - Speak another language Native:
3.7% (160)Foreign-born:
62.4% (268)
Hispanic or Latino - Speak only English Native:
43.5% (634)Foreign-born:
3.6% (74)
Hispanic or Latino - Speak another language Native:
58.2% (848)Foreign-born:
96.4% (1,972)
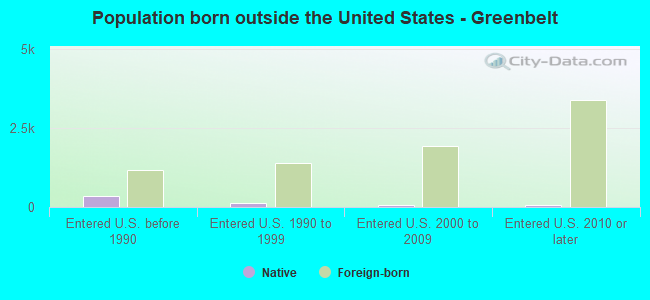
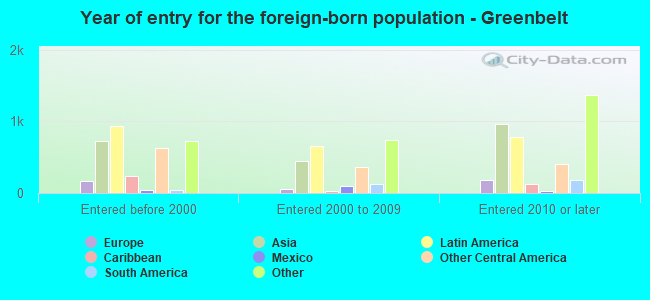
Foreign-born residents in Greenbelt 7,679 residents are foreign born (9.7% Africa , 9.2% Latin America , 8.6% Asia ).
This city:
31.5%Maryland:
15.7%
Marital status for residents in Greenbelt Marital status - White (Caucasian) population 15 years and over
Males 37.2% Never married48.5% Now married1.8% Separated2.5% Widowed10.0% DivorcedFemales 32.3% Never married39.0% Now married0.6% Separated3.9% Widowed24.2% DivorcedWomen who gave birth in the past 12 months Now married:
100.0% (32)Unmarried:
0.0% (0)
Women who did not give birth in the past 12 months Now married:
45.5% (363)Unmarried:
54.5% (435)
Marital status - Black or African American population 15 years and over
Males 59.2% Never married34.0% Now married1.5% Separated0.0% Widowed5.3% DivorcedFemales 53.1% Never married23.3% Now married1.9% Separated6.7% Widowed15.1% DivorcedWomen who gave birth in the past 12 months Now married:
35.1% (56)Unmarried:
64.9% (104)
Women who did not give birth in the past 12 months Now married:
24.8% (709)Unmarried:
75.2% (2,153)
Marital status - American Indian / Alaska Native population 15 years and over
Males 0.0% Never married32.0% Now married0.0% Separated0.0% Widowed68.0% DivorcedFemales 43.8% Never married56.2% Now married0.0% Separated0.0% Widowed0.0% DivorcedWomen who did not give birth in the past 12 months Now married:
0.0% (0)Unmarried:
100.0% (10)
Marital status - Asian population 15 years and over
Males 42.0% Never married55.1% Now married0.0% Separated1.8% Widowed1.1% DivorcedFemales 24.8% Never married58.5% Now married1.4% Separated2.2% Widowed13.1% DivorcedWomen who gave birth in the past 12 months Now married:
100.0% (39)Unmarried:
0.0% (0)
Women who did not give birth in the past 12 months Now married:
49.6% (353)Unmarried:
50.4% (359)
Marital status - Other race population 15 years and over
Males 58.8% Never married34.0% Now married4.2% Separated0.0% Widowed3.0% DivorcedFemales 44.9% Never married23.1% Now married2.0% Separated24.6% Widowed5.4% DivorcedWomen who gave birth in the past 12 months Now married:
100.0% (22)Unmarried:
0.0% (0)
Women who did not give birth in the past 12 months Now married:
35.6% (225)Unmarried:
64.4% (408)
Marital status - Two or more races population 15 years and over
Males 60.4% Never married33.7% Now married5.7% Separated0.0% Widowed0.2% DivorcedFemales 52.4% Never married39.4% Now married1.7% Separated0.0% Widowed6.5% DivorcedWomen who gave birth in the past 12 months Now married:
100.0% (23)Unmarried:
0.0% (0)
Women who did not give birth in the past 12 months Now married:
25.8% (130)Unmarried:
74.2% (375)
Marital status - White alone, not Hispanic / Latino population 15 years and over
Males 36.1% Never married49.6% Now married1.9% Separated2.7% Widowed9.7% DivorcedFemales 33.0% Never married37.3% Now married0.7% Separated4.1% Widowed25.0% DivorcedWomen who gave birth in the past 12 months Now married:
100.0% (35)Unmarried:
0.0% (0)
Women who did not give birth in the past 12 months Now married:
45.6% (380)Unmarried:
54.4% (453)
Marital status - Hispanic or Latino population 15 years and over
Males 54.3% Never married36.9% Now married4.7% Separated0.0% Widowed4.1% DivorcedFemales 42.8% Never married32.5% Now married1.5% Separated18.2% Widowed5.0% DivorcedWomen who gave birth in the past 12 months Now married:
100.0% (21)Unmarried:
0.0% (0)
Women who did not give birth in the past 12 months Now married:
33.8% (278)Unmarried:
66.2% (546)
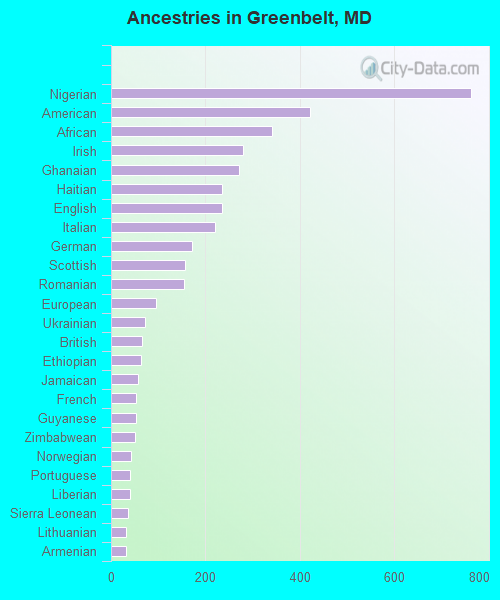
Ancestries in Greenbelt
762 4.8% Nigerian422 2.6% American340 2.1% African279 1.7% Irish271 1.7% Ghanaian236 1.5% Haitian235 1.5% English221 1.4% Italian172 1.1% German157 1.0% Scottish155 1.0% Romanian96 0.6% European71 0.4% Ukrainian66 0.4% British64 0.4% Ethiopian58 0.4% Jamaican52 0.3% French52 0.3% Guyanese50 0.3% Zimbabwean42 0.3% Norwegian41 0.3% Portuguese40 0.3% Liberian36 0.2% Sierra Leonean32 0.2% Lithuanian31 0.2% Armenian29 0.2% West Indian25 0.2% Eastern European25 0.2% Turkish24 0.2% Polish20 0.1% Bulgarian18 0.1% Canadian17 0.1% Trinidadian and Tobagonian14 0.09% Northern European14 0.09% Dutch12 0.08% Ugandan11 0.07% Belgian10 0.06% Swiss9 0.06% Scotch-Irish9 0.06% Austrian1 0.01% Russian
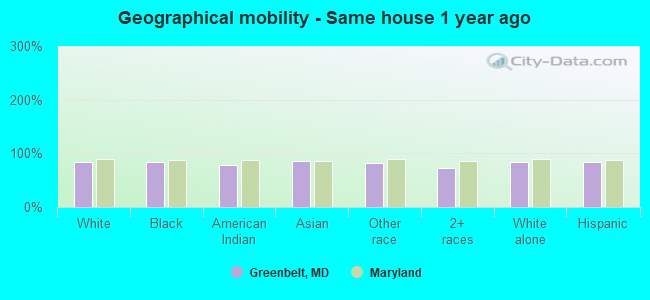
Geographical mobility in Greenbelt Same house 1 year ago 4,139 84.8% White (Caucasian)9,333 83.8% Black or African American175 78.9% American Indian / Alaska Native2,385 85.1% Asian2,510 82.9% Other race1,403 73.5% Two or more races4,053 84.3% White alone, not Hispanic / Latino3,210 83.1% Hispanic or LatinoMoved within same county 380 7.8% White / Caucasian1,201 10.8% Black or African American45 20.1% American Indian / Alaska Native249 8.9% Asian281 9.3% Other race394 20.7% Two or more races427 8.9% White alone, not Hispanic / Latino355 9.2% Hispanic or LatinoMoved within same state 150 3.1% White / Caucasian60 0.5% Black or African American46 1.7% Asian150 5.0% Other race166 8.7% Two or more races159 3.3% White alone, not Hispanic / Latino153 4.0% Hispanic or LatinoMoved from different state 131 2.7% White / Caucasian223 2.0% Black or African American44 1.6% Asian22 1.1% Two or more races130 2.7% White alone, not Hispanic / Latino24 0.6% Hispanic or LatinoMoved from abroad 129 2.6% White128 1.1% Black or African American96 3.4% Asian43 1.4% Other race3 0.2% Two or more races88 1.8% White alone, not Hispanic / Latino96 2.5% Hispanic or Latino
Children Nativity (place of birth) in Greenbelt
Children under 6 years - Living with two parents Both parents native 468 100.0% NativeBoth parents foreign-born 439 95.0% Native23 5.0% Foreign-bornOne native, one foreign-born parent 103 100.0% NativeChildren under 6 years - Living with one parent Native parent 313 100.0% NativeForeign-born parent 307 100.0% NativeChildren 6 to 17 years - Living with two parents Both parents native 307 99.7% Native1 0.3% Foreign-bornBoth parents foreign-born 655 75.5% Native212 24.5% Foreign-bornOne native, one foreign-born parent 263 100.0% NativeChildren 6 to 17 years - Living with one parent Native parent 1,142 100.0% NativeForeign-born parent 626 57.0% Native472 43.0% Foreign-born
Grandparents responsible for own grandchildren in Greenbelt
Grandparents (30 to 59 years) Black or African American 157 89.4% Responsible for grandchildren19 10.6% Not responsible for grandchildrenOther race 6 100.0% Responsible for grandchildrenHispanic or Latino 6 100.0% Responsible for grandchildrenGrandparents (60 years and over) Black or African American 18 26.6% Responsible for grandchildren49 73.4% Not responsible for grandchildren