Races in Greenfield, Indiana (IN) Detailed Stats
Ancestries, Foreign-born residents, place of birth
Settings
X


Recent posts about races in Greenfield, Indiana on our local forum with over 2,400,000 registered users:
 | Packing up House Soon in Greenfield, IN (5 replies) |
| Sell me on Indianapolis (58 replies) |
| Restaurants still open to carry out, curbside, and drive thru (14 replies) |
| Best areas in Fishers from 96th st going North (4 replies) |
| Ranking Indy's mid sized satellite cities: Terre Haute, Lafayette, Kokomo, Marion, Muncie, Anderson, Richmond (49 replies) |
| Weather issues in Indiana? (31 replies) |
Latest news about races in Greenfield, IN collected exclusively by city-data.com from local newspapers, TV, and radio stations
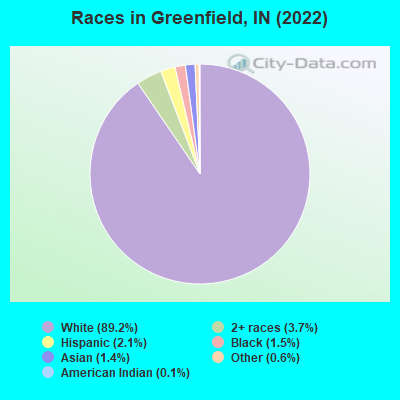
According to 2022 data, the most numerous races in Greenfield, IN are White alone (21,874 residents), Black alone (378 residents), and Hispanic (511 residents). 94.6% of Greenfield residents speak English at home. 3.3% of Greenfield, IN residents are foreign-born (1.6% born in Asia, 0.9% born in Africa, 0.5% born in Latin America), which is 79.9% less than the foreign-born rate of 6.0% across the entire state of Indiana.
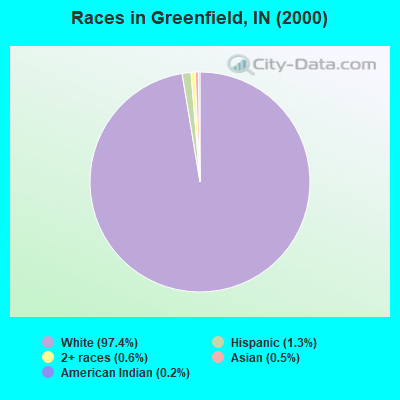
Race distribution in Greenfield
2000
2022

- 14,21597.4%White alone
- 1861.3%Hispanic
- 830.6%Two or more races
- 780.5%Asian alone
- 220.2%American Indian alone
- 80.05%Black alone
- 60.04%Other race alone
- 20.01%Native Hawaiian and Other
Pacific Islander alone
-
- 21,87489.2%White alone
- 9053.7%Two or more races
- 5112.1%Hispanic
- 3781.5%Black alone
- 3471.4%Asian alone
- 1420.6%Other race alone
- 320.1%American Indian alone
2000
2022
-
- 5,219,37385.8%White alone
- 505,4628.3%Black alone
- 214,5363.5%Hispanic
- 61,1151.0%Two or more races
- 58,4241.0%Asian alone
- 13,6540.2%American Indian alone
- 6,3480.1%Other race alone
- 1,5730.03%Native Hawaiian and Other
Pacific Islander alone

-
- 5,192,45576.0%White alone
- 628,0549.2%Black alone
- 534,5287.8%Hispanic
- 263,2423.9%Two or more races
- 172,8802.5%Asian alone
- 33,4670.5%Other race alone
- 5,8660.09%American Indian alone
- 2,5450.04%Native Hawaiian and Other
Pacific Islander alone

Income and house value in Greenfield
- Median household income in 2022
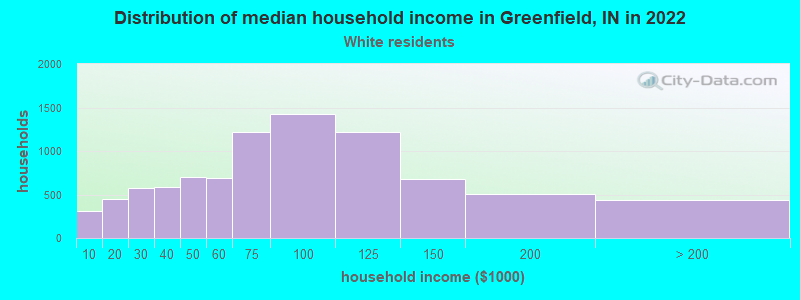
- $73,129White non-Hispanic householders
- $35,687Two or more races householders
- $52,187Hispanic or Latino race householders
- Median 2022 house value
- $212,895White Non-Hispanic householders
- $225,101American Indian or Alaska Native householders
- $170,076Some other race householders
- $170,076Two or more races householders
- $207,693Hispanic or Latino householders
Household income for White non-Hispanic householders
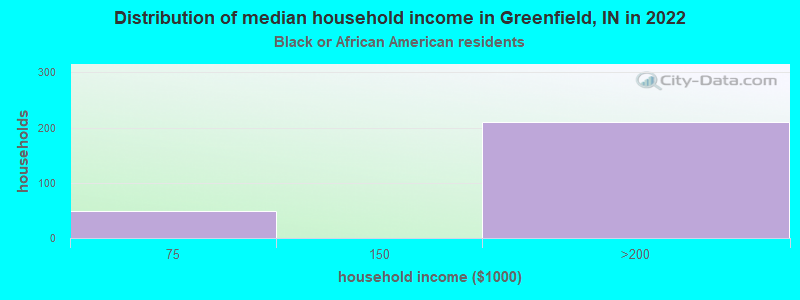
Household income for Black householders
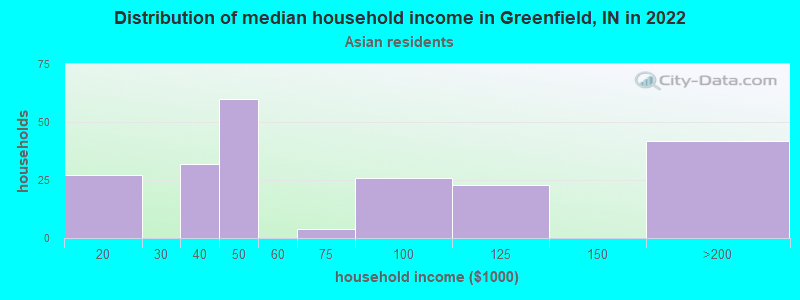
Household income for Asian householders
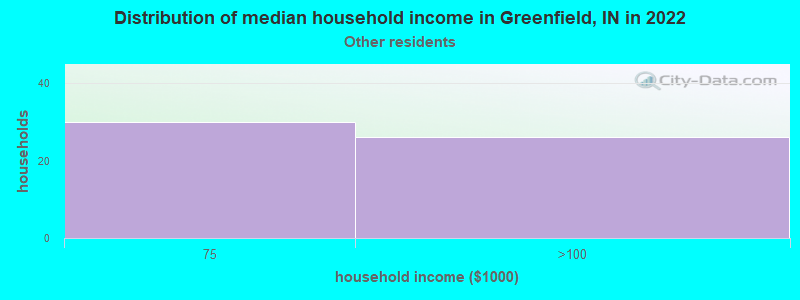
Household income for Some other race householders
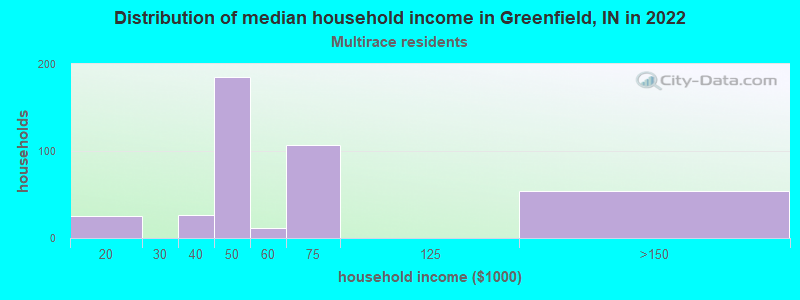
Household income for Two or more races householders
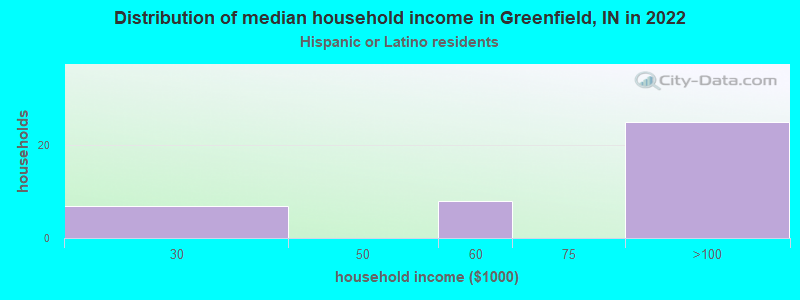
Household income for Hispanic or Latino race householders
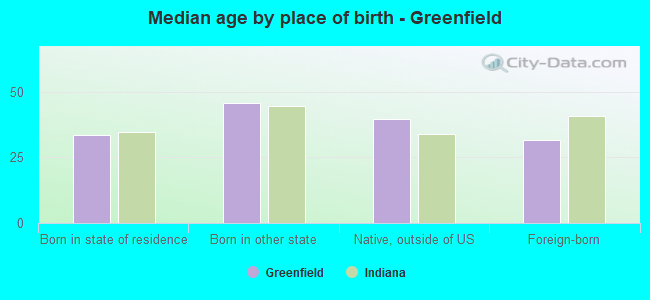
Median age by race in Greenfield
- 38.6Median age for White residents
- 36.3Males
- 39.6Females
- 40.0Median age for Black or African American residents
- 34.7Males
- 50.3Females
- -900,531,510.1Median age for American Indian / Alaska Native residents
- -665,611,813.7Males
- -491,600,353.2Females
- 30.4Median age for Asian residents
- 41.6Males
- 26.7Females
- -666,666,666.0Median age for Native Hawaiian / Pacific Islander residents
- -666,666,666.0Males
- -666,666,666.0Females
- 73.5Median age for Other race residents
- 94.4Males
- 63.0Females
- 24.5Median age for Two or more races residents
- 8.3Males
- 42.5Females
- 38.6Median age for White alone residents
- 36.5Males
- 39.6Females
- 25.8Median age for Hispanic or Latino residents
- 23.8Males
- 34.8Females
Owner/renter occupied households by race in Greenfield
- House owners and renters - White residents
- 6,14171.3%Owner occupied
- 2,47128.7%Renter occupied
- House owners and renters - Black or African American residents
- 112100.0%Owner occupied
- House owners and renters - American Indian / Alaska Native residents
- 15100.0%Owner occupied
- House owners and renters - Asian residents
- 6129.2%Owner occupied
- 14870.8%Renter occupied
- House owners and renters - Other race residents
- 2946.6%Owner occupied
- 3353.4%Renter occupied
- House owners and renters - Two or more races residents
- 37667.1%Owner occupied
- 18532.9%Renter occupied
- House owners and renters - White alone residents
- 6,17871.6%Owner occupied
- 2,45528.4%Renter occupied
- House owners and renters - Hispanic or Latino residents
- 42100.0%Owner occupied
Language usage in Greenfield
- English speakers - Total
- 94.6% of residents of Greenfield speak English at home.
- 1.0% of residents speak Spanish at home
- 8336.4%Speak English very well
- 14563.6%Speak English less than very well
- 4.0% of residents speak other language at home
- 74983.3%Speak English very well
- 15016.7%Speak English less than very well
- English speakers - Born in the United States
- 95.9% of residents of Greenfield speak English at home.
- 2.2% of residents speak Spanish at home
- 4232.3%Speak English very well
- 8867.7%Speak English less than very well
- 1.5% of residents speak other language at home
- 5462.1%Speak English very well
- 3337.9%Speak English less than very well
- English speakers - Native, born elsewhere
- 29.5% of residents of Greenfield speak English at home.
- 67.9% of residents speak Spanish at home
- 2938.2%Speak English very well
- 4761.8%Speak English less than very well
- English speakers - Foreign-born
- 12.7% of residents of Greenfield speak English at home.
- 88.8% of residents speak other language at home
- 61484.3%Speak English very well
- 11415.7%Speak English less than very well
White (Caucasian) - Speak only English
| Native: | 99.2% (20,100) |
| Foreign-born: | 100.0% (21) |
Asian - Speak only English
| Native: | 40.0% (20) |
| Foreign-born: | 19.6% (73) |
Asian - Speak another language
| Native: | 60.7% (30) |
| Foreign-born: | 80.4% (298) |
Other race - Speak another language
| Native: | 42.0% (56) |
| Foreign-born: | 97.7% (44) |
Two or more races - Speak another language
| Native: | 10.9% (106) |
| Foreign-born: | 99.0% (135) |
White alone - Speak only English
| Native: | 98.9% (20,131) |
| Foreign-born: | 93.1% (27) |
Hispanic or Latino - Speak another language
| Native: | 39.0% (109) |
| Foreign-born: | 100.0% (133) |
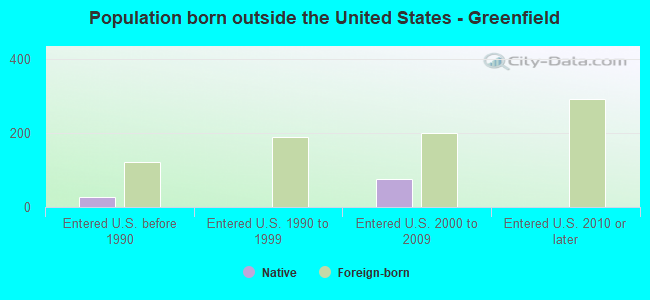
Foreign-born residents in Greenfield
818 residents are foreign born (1.6% Asia, 0.9% Africa, 0.5% Latin America).
| This city: | 3.3% |
| Indiana: | 5.6% |
Marital status for residents in Greenfield
Marital status - White (Caucasian) population 15 years and over
- Males
- 30.6%Never married
- 53.7%Now married
- 1.5%Separated
- 4.3%Widowed
- 9.9%Divorced
- Females
- 24.7%Never married
- 45.9%Now married
- 1.6%Separated
- 10.4%Widowed
- 17.4%Divorced
Women who gave birth in the past 12 months
| Now married: | 69.1% (351) |
| Unmarried: | 30.9% (157) |
Women who did not give birth in the past 12 months
| Now married: | 44.5% (2,064) |
| Unmarried: | 55.5% (2,577) |
Marital status - Black or African American population 15 years and over
- Males
- 4.9%Never married
- 88.6%Now married
- 0.0%Separated
- 1.2%Widowed
- 5.3%Divorced
- Females
- 0.0%Never married
- 83.6%Now married
- 0.0%Separated
- 0.0%Widowed
- 16.4%Divorced
Women who did not give birth in the past 12 months
| Now married: | 100.0% (61) |
| Unmarried: | 0.0% (0) |
Marital status - American Indian / Alaska Native population 15 years and over
- Males
- 0.0%Never married
- 100.0%Now married
- 0.0%Separated
- 0.0%Widowed
- 0.0%Divorced
- Females
- 0.0%Never married
- 100.0%Now married
- 0.0%Separated
- 0.0%Widowed
- 0.0%Divorced
Women who did not give birth in the past 12 months
| Now married: | 100.0% (57) |
| Unmarried: | 0.0% (0) |
Marital status - Asian population 15 years and over
- Males
- 38.8%Never married
- 61.2%Now married
- 0.0%Separated
- 0.0%Widowed
- 0.0%Divorced
- Females
- 65.5%Never married
- 23.4%Now married
- 1.6%Separated
- 9.5%Widowed
- 0.0%Divorced
Women who did not give birth in the past 12 months
| Now married: | 12.2% (24) |
| Unmarried: | 87.8% (172) |
Marital status - Other race population 15 years and over
- Males
- 0.0%Never married
- 100.0%Now married
- 0.0%Separated
- 0.0%Widowed
- 0.0%Divorced
- Females
- 0.0%Never married
- 71.8%Now married
- 0.0%Separated
- 28.2%Widowed
- 0.0%Divorced
Women who gave birth in the past 12 months
| Now married: | 100.0% (22) |
| Unmarried: | 0.0% (0) |
Marital status - Two or more races population 15 years and over
- Males
- 48.8%Never married
- 51.2%Now married
- 0.0%Separated
- 0.0%Widowed
- 0.0%Divorced
- Females
- 33.5%Never married
- 59.7%Now married
- 0.0%Separated
- 6.9%Widowed
- 0.0%Divorced
Women who did not give birth in the past 12 months
| Now married: | 61.0% (282) |
| Unmarried: | 39.0% (180) |
Marital status - White alone, not Hispanic / Latino population 15 years and over
- Males
- 30.8%Never married
- 53.4%Now married
- 1.5%Separated
- 4.3%Widowed
- 9.9%Divorced
- Females
- 24.7%Never married
- 46.0%Now married
- 1.6%Separated
- 10.4%Widowed
- 17.3%Divorced
Women who gave birth in the past 12 months
| Now married: | 69.1% (352) |
| Unmarried: | 30.9% (157) |
Women who did not give birth in the past 12 months
| Now married: | 44.5% (2,069) |
| Unmarried: | 55.5% (2,576) |
Marital status - Hispanic or Latino population 15 years and over
- Males
- 0.9%Never married
- 96.5%Now married
- 0.0%Separated
- 0.0%Widowed
- 2.7%Divorced
- Females
- 22.6%Never married
- 72.3%Now married
- 0.0%Separated
- 0.0%Widowed
- 5.2%Divorced
Women who did not give birth in the past 12 months
| Now married: | 70.9% (113) |
| Unmarried: | 29.1% (46) |
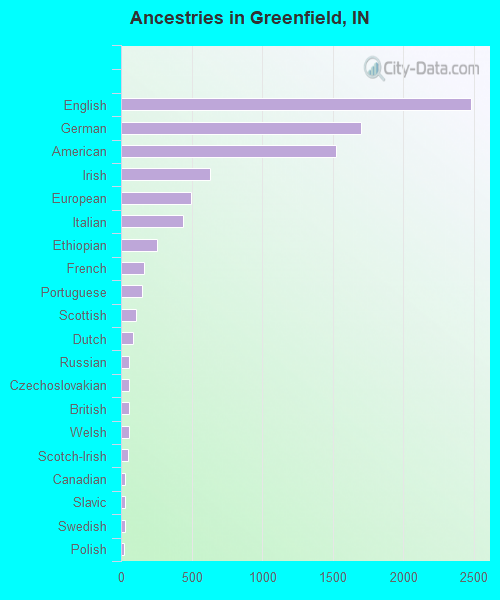
Ancestries in Greenfield

- 2,48323.3%English
- 1,70316.0%German
- 1,52114.3%American
- 6335.9%Irish
- 4954.6%European
- 4414.1%Italian
- 2522.4%Ethiopian
- 1621.5%French
- 1481.4%Portuguese
- 1041.0%Scottish
- 820.8%Dutch
- 590.6%Russian
- 570.5%Czechoslovakian
- 550.5%British
- 550.5%Welsh
- 530.5%Scotch-Irish
- 300.3%Canadian
- 280.3%Slavic
- 280.3%Swedish
- 240.2%Polish
- 190.2%Serbian
- 120.1%Scandinavian
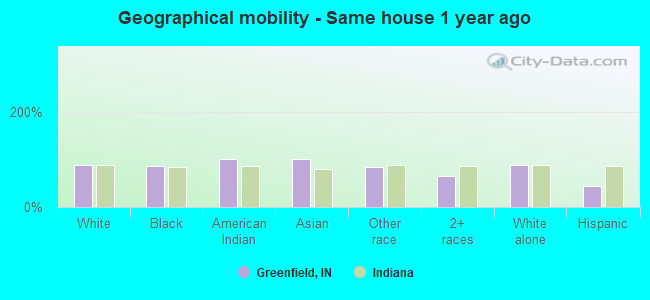
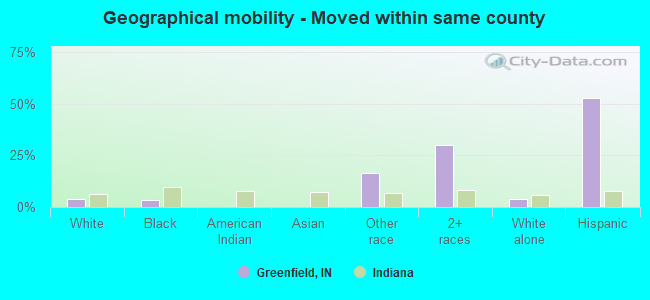
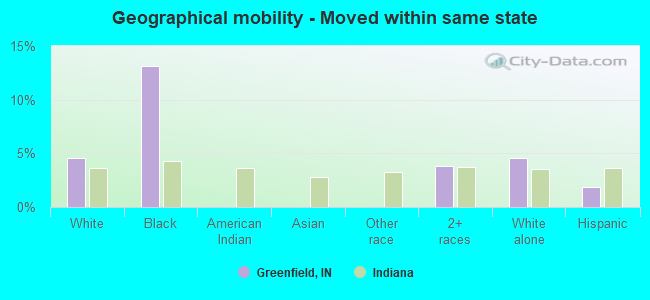
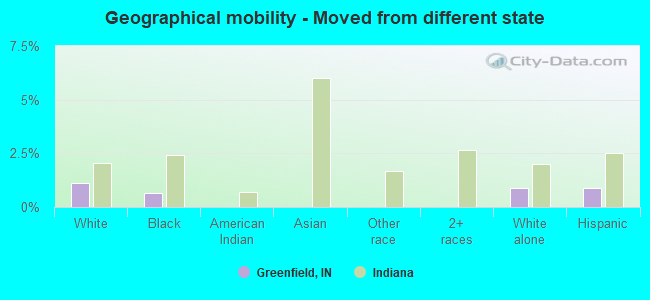
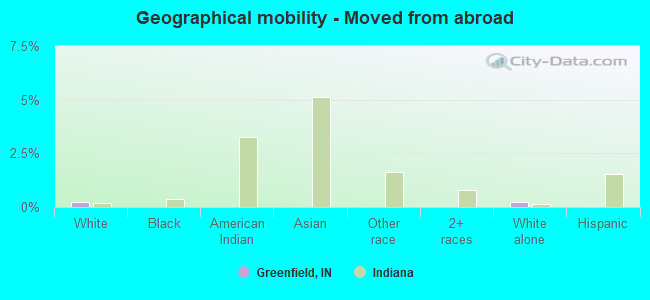
Geographical mobility in Greenfield

- Same house 1 year ago
- 18,73887.1%White (Caucasian)
- 30186.2%Black or African American
- 64100.0%American Indian / Alaska Native
- 42699.5%Asian
- 15083.6%Other race
- 80165.2%Two or more races
- 18,72587.3%White alone, not Hispanic / Latino
- 19042.9%Hispanic or Latino
-
- Moved within same county
- 8504.0%White / Caucasian
- 123.5%Black or African American
- 2916.4%Other race
- 36930.0%Two or more races
- 8453.9%White alone, not Hispanic / Latino
- 23452.9%Hispanic or Latino
-
- Moved within same state
- 9884.6%White / Caucasian
- 4613.2%Black or African American
- 473.8%Two or more races
- 9884.6%White alone, not Hispanic / Latino
- 81.9%Hispanic or Latino
-
- Moved from different state
- 2401.1%White / Caucasian
- 20.7%Black or African American
- 1930.9%White alone, not Hispanic / Latino
- 40.9%Hispanic or Latino
-
- Moved from abroad
- 500.2%White
- 500.2%White alone, not Hispanic / Latino
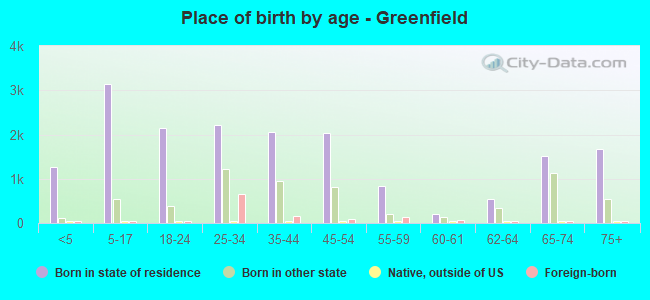
Children Nativity (place of birth) in Greenfield
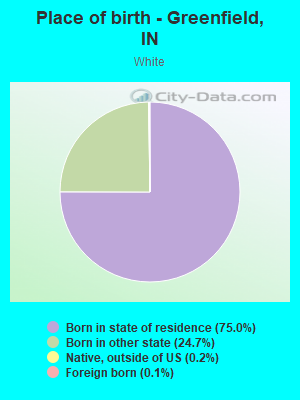
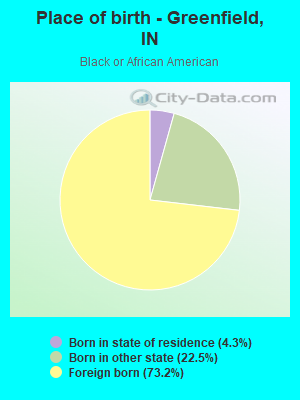
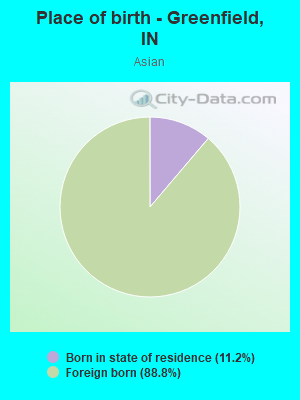
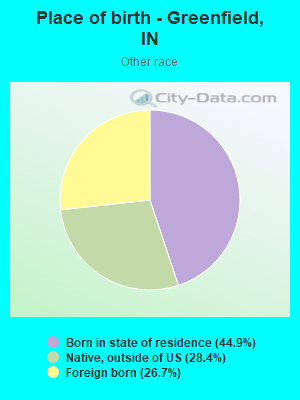
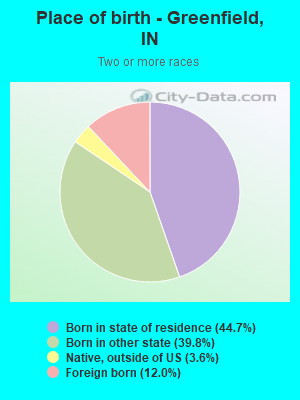
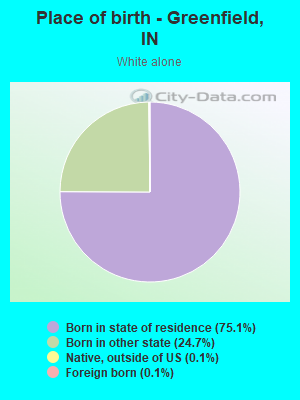
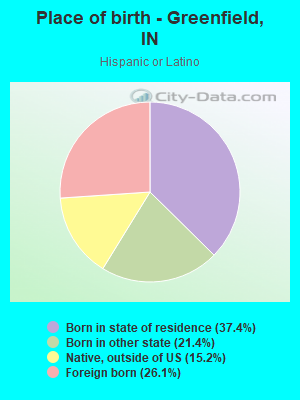
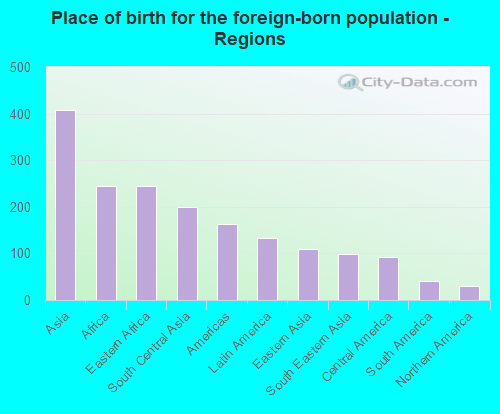
Place of birth for residents in Greenfield
![Place of birth for the foreign-born population - Regions]()
- 408Asia
- 245Africa
- 245Eastern Africa
- 199South Central Asia
- 164Americas
- 133Latin America
- 109Eastern Asia
- 98South Eastern Asia
- 92Central America
- 41South America
- 30Northern America
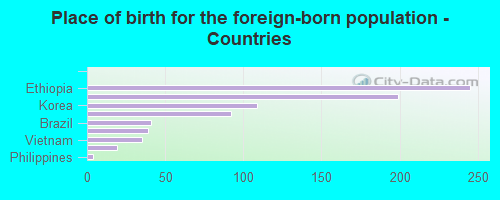
![Place of birth for the foreign-born population - Countries]()
- 245Ethiopia
- 199India
- 109Korea
- 92Mexico
- 41Brazil
- 39Burma (Myanmar)
- 35Vietnam
- 19Thailand
- 4Philippines
Grandparents responsible for own grandchildren in Greenfield
Zip codes: 46140.