Races in Greensburg, Pennsylvania (PA) Detailed Stats
Ancestries, Foreign-born residents, place of birth
Settings
X


Recent posts about races in Greensburg, Pennsylvania on our local forum with over 2,400,000 registered users:
 | Squirrel Hill or Greensburg? (60 replies) |
| Exurb(s) of the week: Greensburg, South/Southwest Greensburg (3 replies) |
| Familiar with Greensburg and surrounding area? (12 replies) |
| Pittsburgh MSA municipal population data (2020) (125 replies) |
| Federal troops in Pittsburgh? (475 replies) |
| Prediction: City of Pittsburgh to lose much more population in the next 5 years. (363 replies) |
Latest news about races in Greensburg, PA collected exclusively by city-data.com from local newspapers, TV, and radio stations
According to 2022 data, the most numerous races in Greensburg, PA are White alone (13,340 residents), Black alone (370 residents), and Hispanic (170 residents). 98.0% of Greensburg residents speak English at home. 2.0% of Greensburg, PA residents are foreign-born , which is 251.8% less than the foreign-born rate of 7.0% across the entire state of Pennsylvania.
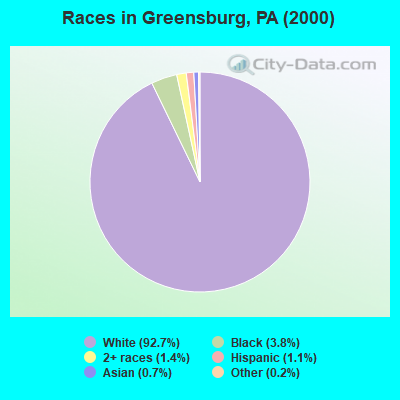
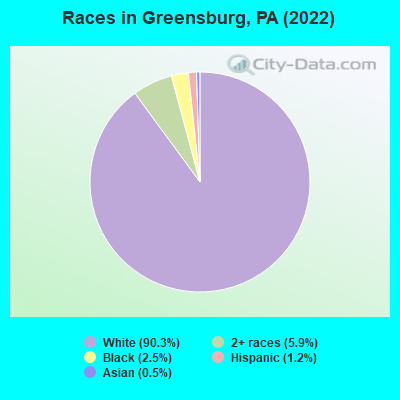
Race distribution in Greensburg
2000
2022

- 14,73292.7%White alone
- 6083.8%Black alone
- 2191.4%Two or more races
- 1721.1%Hispanic
- 1090.7%Asian alone
- 350.2%Other race alone
- 120.08%American Indian alone
- 20.01%Native Hawaiian and Other
Pacific Islander alone
-
- 13,34090.3%White alone
- 8695.9%Two or more races
- 3702.5%Black alone
- 1701.2%Hispanic
- 770.5%Asian alone
- 110.07%Other race alone
2000
2022
-
- 10,322,45584.1%White alone
- 1,202,4379.8%Black alone
- 394,0883.2%Hispanic
- 218,2961.8%Asian alone
- 113,0970.9%Two or more races
- 13,0860.1%Other race alone
- 14,9040.1%American Indian alone
- 2,6910.02%Native Hawaiian and Other
Pacific Islander alone

-
- 9,487,22873.1%White alone
- 1,311,58110.1%Black alone
- 1,115,9978.6%Hispanic
- 493,9423.8%Two or more races
- 487,1243.8%Asian alone
- 63,5820.5%Other race alone
- 10,1300.08%American Indian alone
- 2,4240.02%Native Hawaiian and Other
Pacific Islander alone

Income and house value in Greensburg
- Median household income in 2022
- $59,607White non-Hispanic householders
- $49,399Black householders
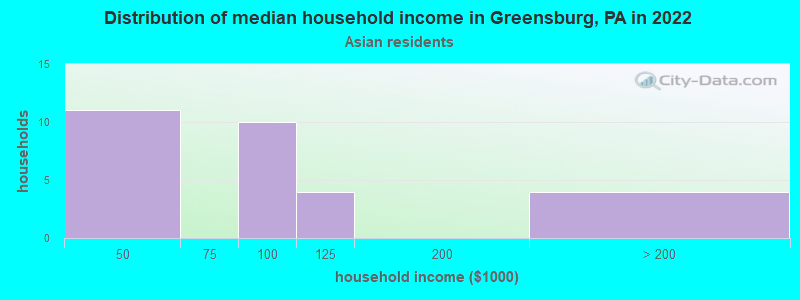
- $59,287Asian householders
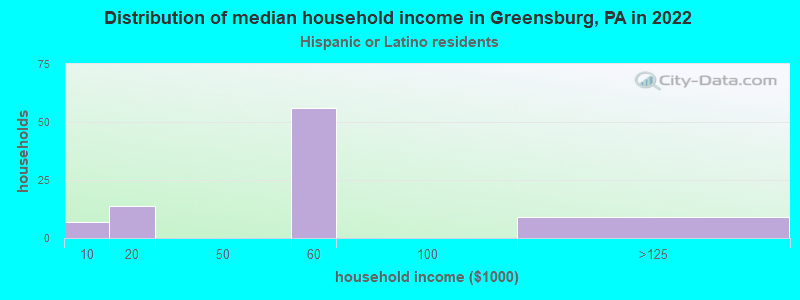
- $51,574Hispanic or Latino race householders
- Median 2022 house value
- $170,681White Non-Hispanic householders
- $144,548Black or African American householders
- $331,767Asian householders
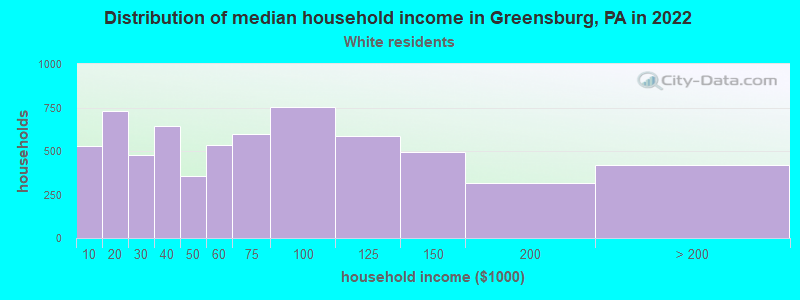
Household income for White non-Hispanic householders
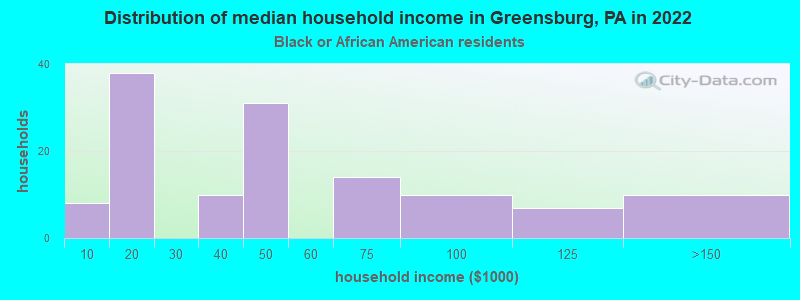
Household income for Black householders
Household income for Asian householders
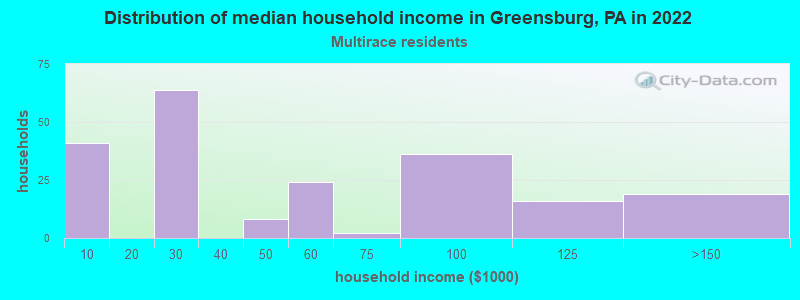
Household income for Two or more races householders
Household income for Hispanic or Latino race householders
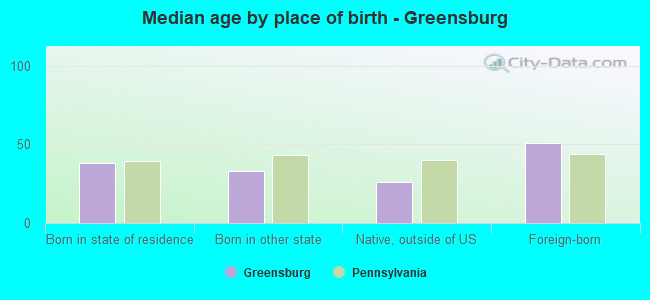
Median age by race in Greensburg
- 38.5Median age for White residents
- 36.7Males
- 42.2Females
- 28.0Median age for Black or African American residents
- 25.0Males
- 36.0Females
- -693,069,306.2Median age for American Indian / Alaska Native residents
- -714,583,332.6Males
- -663,507,108.3Females
- 60.1Median age for Asian residents
- 78.7Males
- 56.3Females
- -680,432,644.4Median age for Native Hawaiian / Pacific Islander residents
- -666,666,666.0Males
- -747,474,746.7Females
- -776,655,442.5Median age for Other race residents
- -717,019,133.2Males
- -888,020,832.4Females
- 22.6Median age for Two or more races residents
- 22.1Males
- 25.9Females
- 38.7Median age for White alone residents
- 36.8Males
- 42.4Females
- 25.9Median age for Hispanic or Latino residents
- 23.3Males
- 25.8Females
Owner/renter occupied households by race in Greensburg
- House owners and renters - White residents
- 3,66757.5%Owner occupied
- 2,71242.5%Renter occupied
- House owners and renters - Black or African American residents
- 2926.9%Owner occupied
- 7973.1%Renter occupied
- House owners and renters - Asian residents
- 1551.8%Owner occupied
- 1448.2%Renter occupied
- House owners and renters - Other race residents
- 13100.0%Renter occupied
- House owners and renters - Two or more races residents
- 4434.4%Owner occupied
- 8565.6%Renter occupied
- House owners and renters - White alone residents
- 3,67057.9%Owner occupied
- 2,66642.1%Renter occupied
- House owners and renters - Hispanic or Latino residents
- 81100.0%Renter occupied
Language usage in Greensburg
- English speakers - Total
- 98.0% of residents of Greensburg speak English at home.
- 0.3% of residents speak Spanish at home
- 2048.8%Speak English very well
- 2151.2%Speak English less than very well
- 1.5% of residents speak other language at home
- 16978.2%Speak English very well
- 4721.8%Speak English less than very well
- English speakers - Born in the United States
- 98.7% of residents of Greensburg speak English at home.
- 0.3% of residents speak Spanish at home
- 8100.0%Speak English very well
- 0.9% of residents speak other language at home
- 25100.0%Speak English very well
- English speakers - Native, born elsewhere
- 71.0% of residents of Greensburg speak English at home.
- 37.7% of residents speak other language at home
- 26100.0%Speak English very well
- English speakers - Foreign-born
- 51.6% of residents of Greensburg speak English at home.
- 4.5% of residents speak Spanish at home
- 14100.0%Speak English less than very well
- 37.6% of residents speak other language at home
- 8471.2%Speak English very well
- 3428.8%Speak English less than very well
White (Caucasian) - Speak only English
| Native: | 99.1% (12,444) |
| Foreign-born: | 61.5% (145) |
White (Caucasian) - Speak another language
| Native: | 0.9% (115) |
| Foreign-born: | 37.6% (89) |
Black or African American - Speak another language
| Native: | 1.3% (6) |
| Foreign-born: | 91.9% (8) |
Asian - Speak only English
| Native: | 48.1% (7) |
| Foreign-born: | 26.8% (15) |
Asian - Speak another language
| Native: | 49.5% (8) |
| Foreign-born: | 72.8% (42) |
White alone - Speak only English
| Native: | 99.1% (12,390) |
| Foreign-born: | 64.7% (149) |
White alone - Speak another language
| Native: | 0.9% (109) |
| Foreign-born: | 34.2% (79) |
Hispanic or Latino - Speak another language
| Native: | 7.8% (11) |
| Foreign-born: | 100.0% (16) |
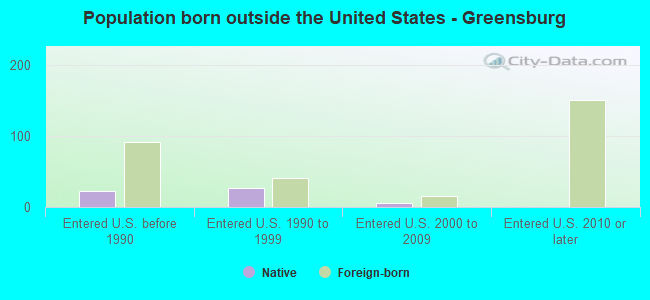
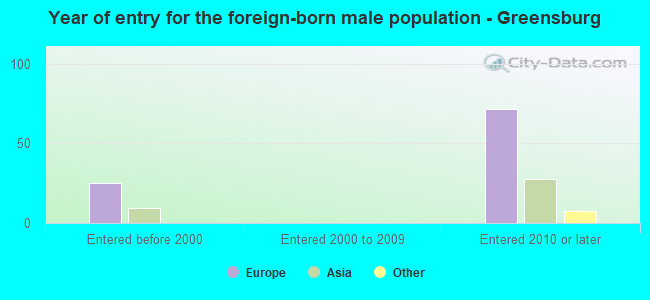
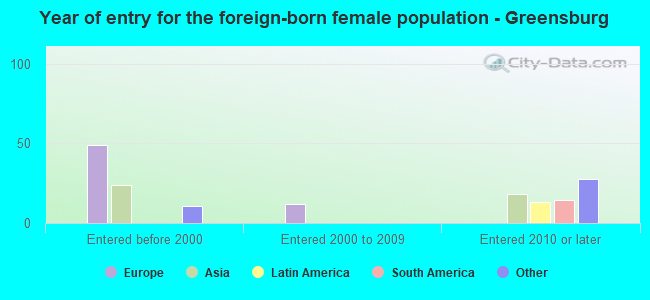
Foreign-born residents in Greensburg
294 residents are foreign born
| This city: | 2.0% |
| Pennsylvania: | 7.3% |

Marital status for residents in Greensburg
Marital status - White (Caucasian) population 15 years and over
- Males
- 44.0%Never married
- 42.0%Now married
- 0.9%Separated
- 3.4%Widowed
- 9.7%Divorced
- Females
- 37.3%Never married
- 36.9%Now married
- 2.0%Separated
- 10.4%Widowed
- 13.4%Divorced
Women who gave birth in the past 12 months
| Now married: | 78.0% (120) |
| Unmarried: | 22.0% (34) |
Women who did not give birth in the past 12 months
| Now married: | 32.9% (1,034) |
| Unmarried: | 67.1% (2,110) |
Marital status - Black or African American population 15 years and over
- Males
- 70.2%Never married
- 27.4%Now married
- 0.0%Separated
- 0.0%Widowed
- 2.4%Divorced
- Females
- 61.6%Never married
- 27.5%Now married
- 0.0%Separated
- 0.0%Widowed
- 10.9%Divorced
Women who gave birth in the past 12 months
| Now married: | 0.0% (0) |
| Unmarried: | 100.0% (7) |
Women who did not give birth in the past 12 months
| Now married: | 19.6% (18) |
| Unmarried: | 80.4% (75) |
Marital status - Asian population 15 years and over
- Males
- 23.1%Never married
- 76.9%Now married
- 0.0%Separated
- 0.0%Widowed
- 0.0%Divorced
- Females
- 21.2%Never married
- 51.9%Now married
- 0.0%Separated
- 0.0%Widowed
- 26.9%Divorced
Women who did not give birth in the past 12 months
| Now married: | 26.7% (4) |
| Unmarried: | 73.3% (11) |
Marital status - Other race population 15 years and over
- Males
- 0.0%Never married
- 100.0%Now married
- 0.0%Separated
- 0.0%Widowed
- 0.0%Divorced
- Females
- 100.0%Never married
- 0.0%Now married
- 0.0%Separated
- 0.0%Widowed
- 0.0%Divorced
Women who did not give birth in the past 12 months
| Now married: | 0.0% (0) |
| Unmarried: | 100.0% (9) |
Marital status - Two or more races population 15 years and over
- Males
- 52.3%Never married
- 30.9%Now married
- 0.0%Separated
- 0.0%Widowed
- 16.8%Divorced
- Females
- 80.8%Never married
- 14.8%Now married
- 0.0%Separated
- 2.2%Widowed
- 2.2%Divorced
Women who did not give birth in the past 12 months
| Now married: | 9.9% (25) |
| Unmarried: | 90.1% (229) |
Marital status - White alone, not Hispanic / Latino population 15 years and over
- Males
- 44.0%Never married
- 41.9%Now married
- 0.9%Separated
- 3.4%Widowed
- 9.8%Divorced
- Females
- 36.9%Never married
- 37.1%Now married
- 2.0%Separated
- 10.5%Widowed
- 13.5%Divorced
Women who gave birth in the past 12 months
| Now married: | 78.0% (121) |
| Unmarried: | 22.0% (34) |
Women who did not give birth in the past 12 months
| Now married: | 33.3% (1,038) |
| Unmarried: | 66.7% (2,082) |
Marital status - Hispanic or Latino population 15 years and over
- Males
- 51.0%Never married
- 49.0%Now married
- 0.0%Separated
- 0.0%Widowed
- 0.0%Divorced
- Females
- 72.9%Never married
- 27.1%Now married
- 0.0%Separated
- 0.0%Widowed
- 0.0%Divorced
Women who did not give birth in the past 12 months
| Now married: | 27.1% (17) |
| Unmarried: | 72.9% (46) |
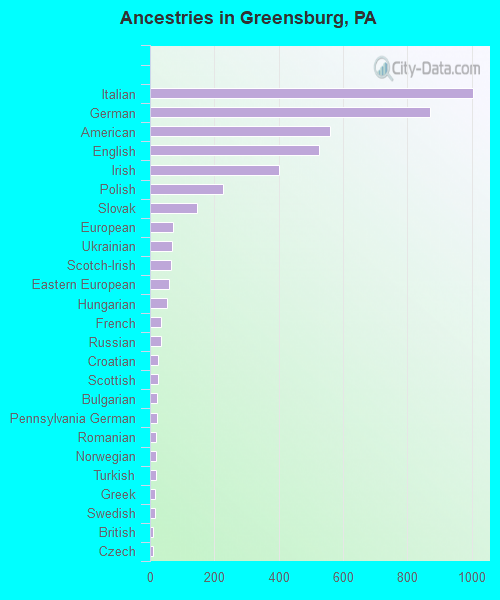
Ancestries in Greensburg

- 1,00419.1%Italian
- 87216.6%German
- 56110.7%American
- 52710.0%English
- 4017.6%Irish
- 2284.3%Polish
- 1462.8%Slovak
- 711.4%European
- 691.3%Ukrainian
- 641.2%Scotch-Irish
- 591.1%Eastern European
- 541.0%Hungarian
- 350.7%French
- 340.6%Russian
- 240.5%Croatian
- 240.5%Scottish
- 210.4%Bulgarian
- 210.4%Pennsylvania German
- 200.4%Romanian
- 190.4%Norwegian
- 190.4%Turkish
- 150.3%Greek
- 150.3%Swedish
- 100.2%British
- 100.2%Czech
- 90.2%Canadian
- 80.2%Belgian
- 80.2%Cypriot
- 80.2%Welsh
- 70.1%Australian
- 70.1%Czechoslovakian
- 70.1%Swiss
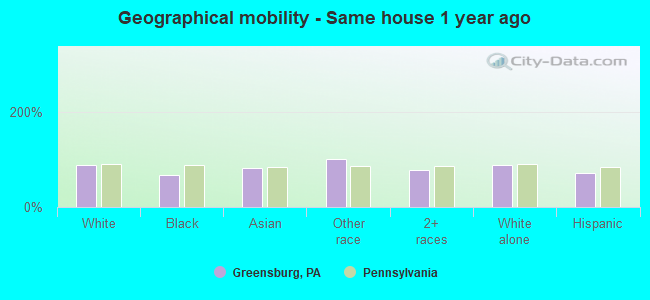
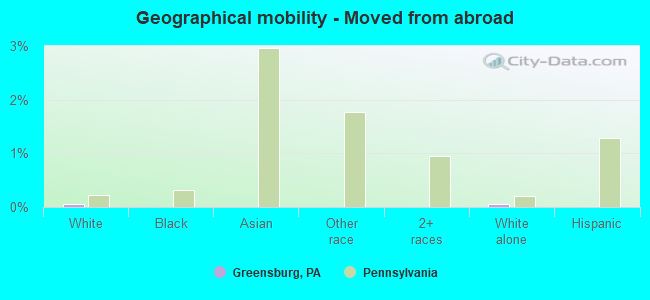
Geographical mobility in Greensburg

- Same house 1 year ago
- 11,63787.4%White (Caucasian)
- 24967.5%Black or African American
- 7882.4%Asian
- 24100.0%Other race
- 68878.2%Two or more races
- 11,58487.4%White alone, not Hispanic / Latino
- 11871.1%Hispanic or Latino
-
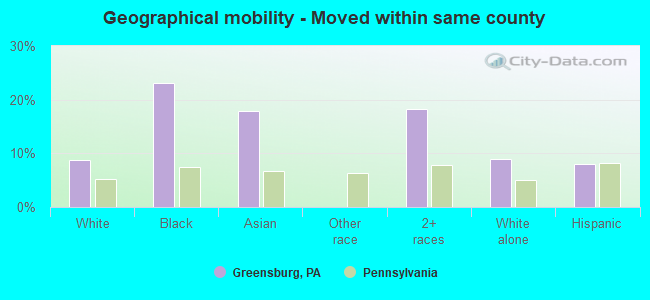
- Moved within same county
- 1,1788.8%White / Caucasian
- 8523.2%Black or African American
- 1718.0%Asian
- 16118.3%Two or more races
- 1,1818.9%White alone, not Hispanic / Latino
- 138.0%Hispanic or Latino
-
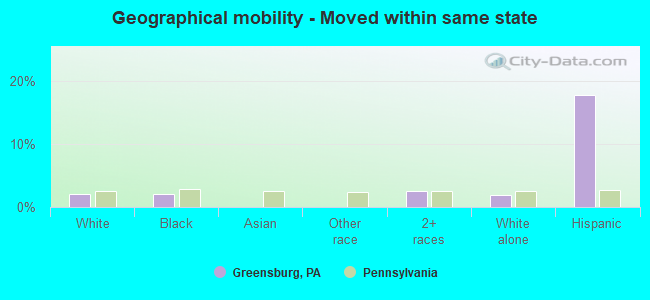
- Moved within same state
- 2672.0%White / Caucasian
- 72.0%Black or African American
- 232.6%Two or more races
- 2612.0%White alone, not Hispanic / Latino
- 2917.7%Hispanic or Latino
-
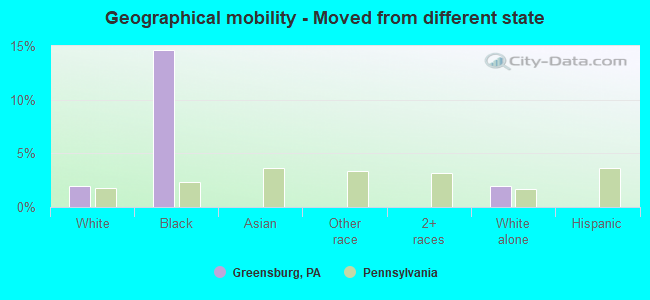
- Moved from different state
- 2581.9%White / Caucasian
- 5414.6%Black or African American
- 2612.0%White alone, not Hispanic / Latino
-
- Moved from abroad
- 90.1%White
- 90.1%White alone, not Hispanic / Latino
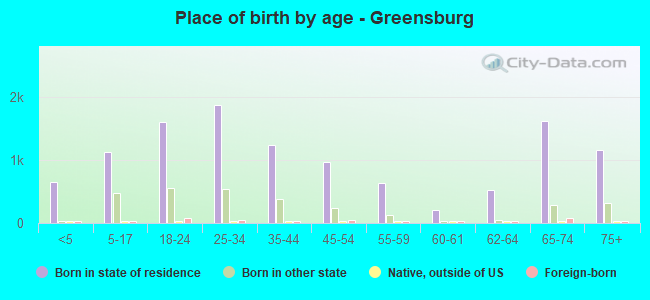
Children Nativity (place of birth) in Greensburg
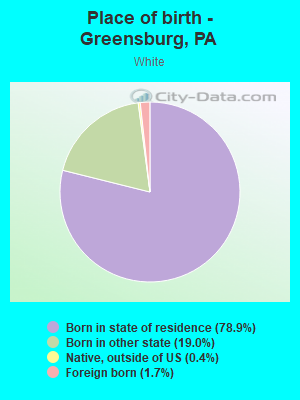
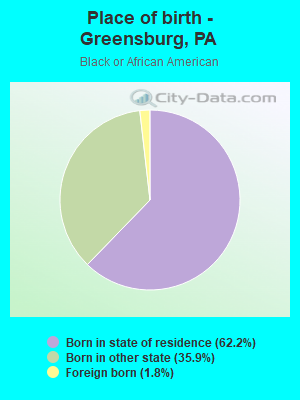
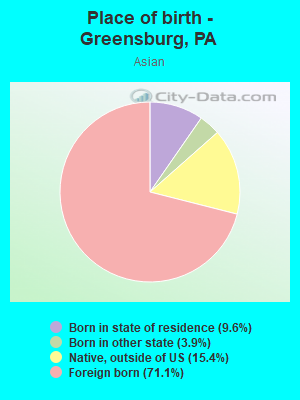
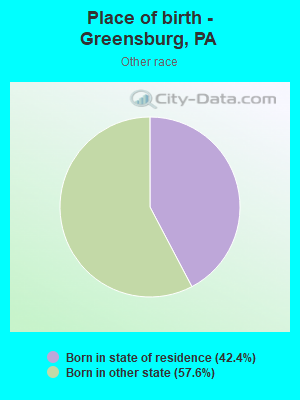
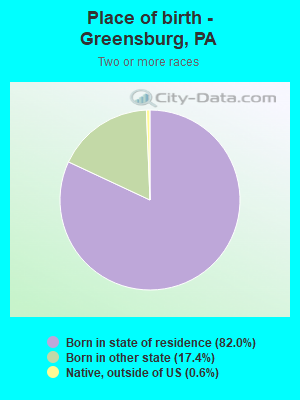
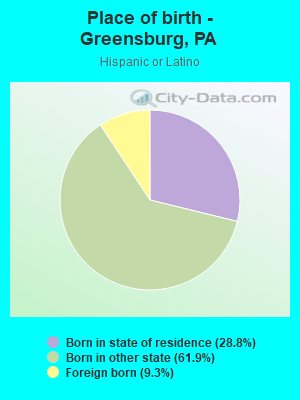
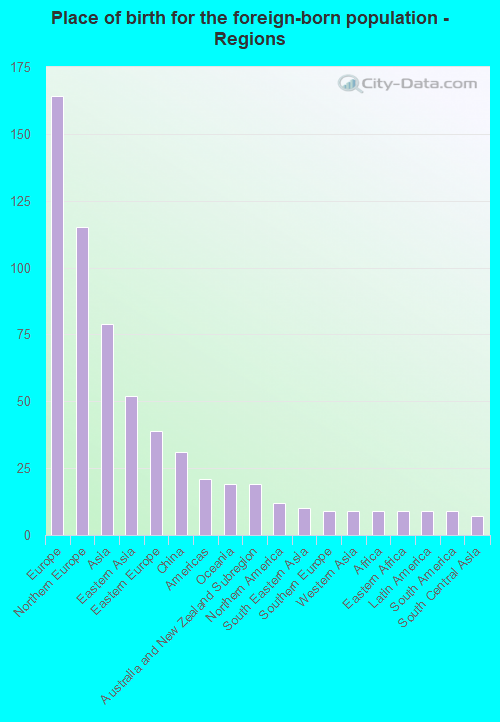
Place of birth for residents in Greensburg
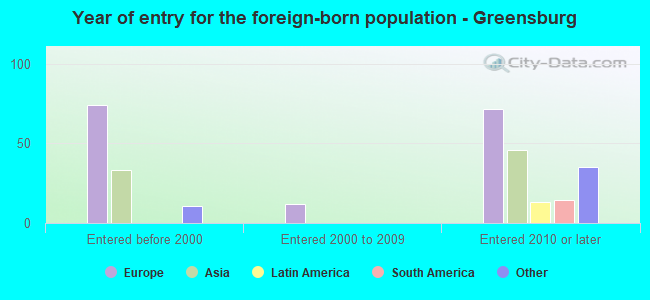
![Place of birth for the foreign-born population - Regions]()
- 164Europe
- 115Northern Europe
- 79Asia
- 52Eastern Asia
- 39Eastern Europe
- 31China
- 21Americas
- 19Oceania
- 19Australia and New Zealand Subregion
- 12Northern America
- 10South Eastern Asia
- 9Southern Europe
- 9Western Asia
- 9Africa
- 9Eastern Africa
- 9Latin America
- 9South America
- 7South Central Asia
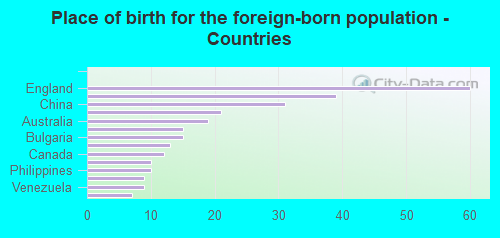
![Place of birth for the foreign-born population - Countries]()
- 60England
- 39United Kingdom
- 31China
- 21Japan
- 19Australia
- 15Sweden
- 15Bulgaria
- 13Ukraine
- 12Canada
- 10Romania
- 10Philippines
- 9Italy
- 9Venezuela
- 7Bangladesh
Grandparents responsible for own grandchildren in Greensburg
Zip codes: 15601.