Races in Greenville, North Carolina (NC) Detailed Stats
Data:
Races - White alone (%)
Races - White alone (% change since 2000)
Races - Black alone (%)
Races - Black alone (% change since 2000)
Races - American Indian alone (%)
Races - American Indian alone (% change since 2000)
Races - Asian alone (%)
Races - Asian alone (% change since 2000)
Races - Hispanic (%)
Races - Hispanic (% change since 2000)
Races - Native Hawaiian and Other Pacific Islander alone (%)
Races - Native Hawaiian and Other Pacific Islander alone (% change since 2000)
Races - Two or more races(%)
Races - Two or more races(% change since 2000)
Races - Other race alone (%)
Races - Other race alone (% change since 2000)
Racial diversity
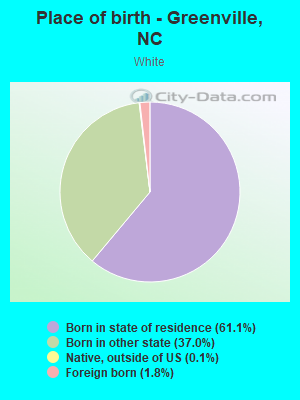
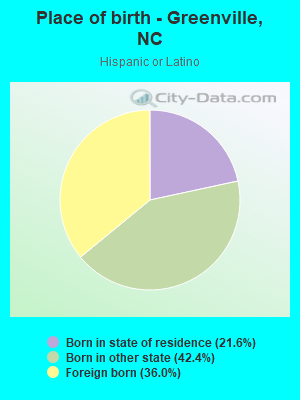
Place of birth - Born in state of residence (%)
Place of birth - Born in state of residence (%) - White
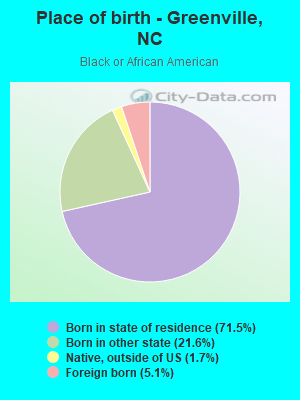
Place of birth - Born in state of residence (%) - Black or African American
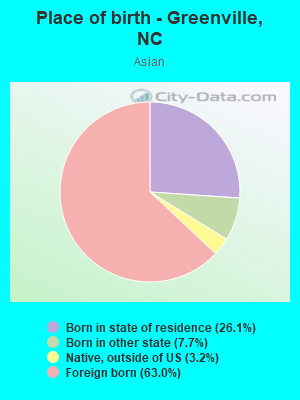
Place of birth - Born in state of residence (%) - Asian
Place of birth - Born in state of residence (%) - Hispanic or Latino
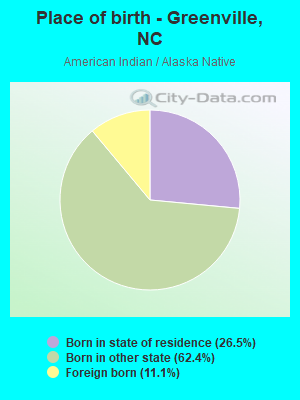
Place of birth - Born in state of residence (%) - American Indian and Alaska Native
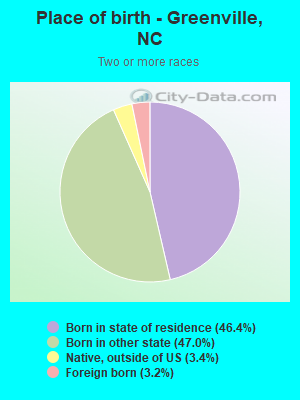
Place of birth - Born in state of residence (%) - Multirace
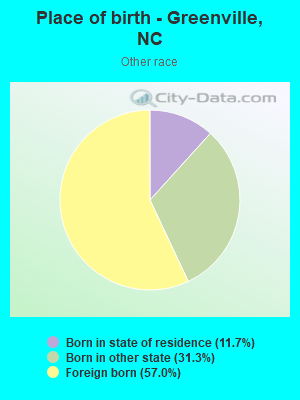
Place of birth - Born in state of residence (%) - Other Race
Place of birth - Born in other state (%)
Place of birth - Born in other state (%) - White
Place of birth - Born in other state (%) - Black or African American
Place of birth - Born in other state (%) - Asian
Place of birth - Born in other state (%) - Hispanic or Latino
Place of birth - Born in other state (%) - American Indian and Alaska Native
Place of birth - Born in other state (%) - Multirace
Place of birth - Born in other state (%) - Other Race
Place of birth - Native, outside of US (%)
Place of birth - Native, outside of US (%) - White
Place of birth - Native, outside of US (%) - Black or African American
Place of birth - Native, outside of US (%) - Asian
Place of birth - Native, outside of US (%) - Hispanic or Latino
Place of birth - Native, outside of US (%) - American Indian and Alaska Native
Place of birth - Native, outside of US (%) - Multirace
Place of birth - Native, outside of US (%) - Other Race
Place of birth - Foreign born (%)
Place of birth - Foreign born (%) - White
Place of birth - Foreign born (%) - Black or African American
Place of birth - Foreign born (%) - Asian
Place of birth - Foreign born (%) - Hispanic or Latino
Place of birth - Foreign born (%) - American Indian and Alaska Native
Place of birth - Foreign born (%) - Multirace
Place of birth - Foreign born (%) - Other Race
Residents speaking English at home (%)
Residents speaking English at home - Born in the United States (%)
Residents speaking English at home - Native, born elsewhere (%)
Residents speaking English at home - Foreign born (%)
Residents speaking Spanish at home (%)
Residents speaking Spanish at home - Born in the United States (%)
Residents speaking Spanish at home - Native, born elsewhere (%)
Residents speaking Spanish at home - Foreign born (%)
Residents speaking other language at home (%)
Residents speaking other language at home - Born in the United States (%)
Residents speaking other language at home - Native, born elsewhere (%)
Residents speaking other language at home - Foreign born (%)
Marital status - Never married (%)
Marital status - Now married (%)
Marital status - Separated (%)
Marital status - Widowed (%)
Marital status - Divorced (%)
Ancestries Reported - Arab (%)
Ancestries Reported - Czech (%)
Ancestries Reported - Danish (%)
Ancestries Reported - Dutch (%)
Ancestries Reported - English (%)
Ancestries Reported - French (%)
Ancestries Reported - French Canadian (%)
Ancestries Reported - German (%)
Ancestries Reported - Greek (%)
Ancestries Reported - Hungarian (%)
Ancestries Reported - Irish (%)
Ancestries Reported - Italian (%)
Ancestries Reported - Lithuanian (%)
Ancestries Reported - Norwegian (%)
Ancestries Reported - Polish (%)
Ancestries Reported - Portuguese (%)
Ancestries Reported - Russian (%)
Ancestries Reported - Scotch-Irish (%)
Ancestries Reported - Scottish (%)
Ancestries Reported - Slovak (%)
Ancestries Reported - Subsaharan African (%)
Ancestries Reported - Swedish (%)
Ancestries Reported - Swiss (%)
Ancestries Reported - Ukrainian (%)
Ancestries Reported - United States (%)
Ancestries Reported - Welsh (%)
Ancestries Reported - West Indian (%)
Ancestries Reported - Other (%)
Geographical mobility - Same house 1 year ago (%)
Geographical mobility - Same house 1 year ago (%) - White
Geographical mobility - Same house 1 year ago (%) - Black or African American
Geographical mobility - Same house 1 year ago (%) - Asian
Geographical mobility - Same house 1 year ago (%) - Hispanic or Latino
Geographical mobility - Same house 1 year ago (%) - American Indian and Alaska Native
Geographical mobility - Same house 1 year ago (%) - Multirace
Geographical mobility - Same house 1 year ago (%) - Other Race
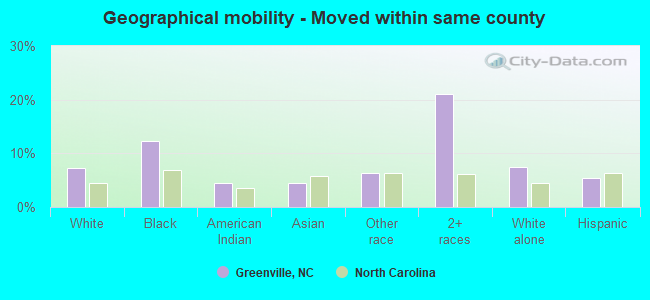
Geographical mobility - Moved within same county (%)
Geographical mobility - Moved within same county (%) - White
Geographical mobility - Moved within same county (%) - Black or African American
Geographical mobility - Moved within same county (%) - Asian
Geographical mobility - Moved within same county (%) - Hispanic or Latino
Geographical mobility - Moved within same county (%) - American Indian and Alaska Native
Geographical mobility - Moved within same county (%) - Multirace
Geographical mobility - Moved within same county (%) - Other Race
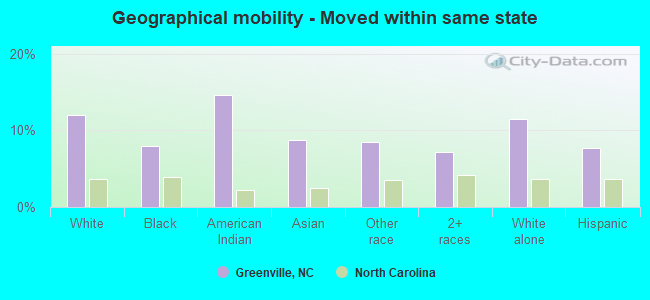
Geographical mobility - Moved from different county within same state (%)
Geographical mobility - Moved from different county within same state (%) - White
Geographical mobility - Moved from different county within same state (%) - Black or African American
Geographical mobility - Moved from different county within same state (%) - Asian
Geographical mobility - Moved from different county within same state (%) - Hispanic or Latino
Geographical mobility - Moved from different county within same state (%) - American Indian and Alaska Native
Geographical mobility - Moved from different county within same state (%) - Multirace
Geographical mobility - Moved from different county within same state (%) - Other Race
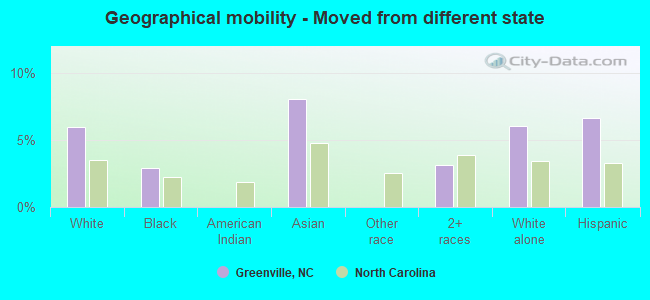
Geographical mobility - Moved from different state (%)
Geographical mobility - Moved from different state (%) - White
Geographical mobility - Moved from different state (%) - Black or African American
Geographical mobility - Moved from different state (%) - Asian
Geographical mobility - Moved from different state (%) - Hispanic or Latino
Geographical mobility - Moved from different state (%) - American Indian and Alaska Native
Geographical mobility - Moved from different state (%) - Multirace
Geographical mobility - Moved from different state (%) - Other Race
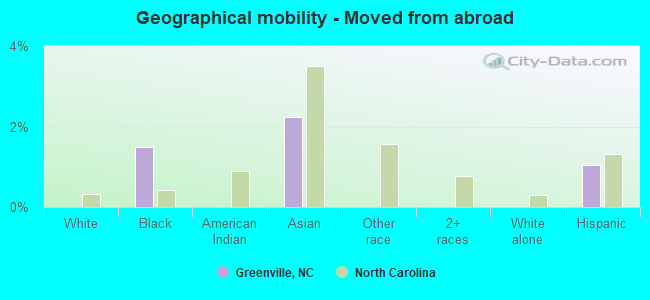
Geographical mobility - Moved from abroad (%)
Geographical mobility - Moved from abroad (%) - White
Geographical mobility - Moved from abroad (%) - Black or African American
Geographical mobility - Moved from abroad (%) - Asian
Geographical mobility - Moved from abroad (%) - Hispanic or Latino
Geographical mobility - Moved from abroad (%) - American Indian and Alaska Native
Geographical mobility - Moved from abroad (%) - Multirace
Geographical mobility - Moved from abroad (%) - Other Race
Place of birth for the foreign-born population - Ireland (%)
Place of birth for the foreign-born population - Denmark (%)
Place of birth for the foreign-born population - Norway (%)
Place of birth for the foreign-born population - Sweden (%)
Place of birth for the foreign-born population - United Kingdom (%)
Place of birth for the foreign-born population - England (%)
Place of birth for the foreign-born population - Scotland (%)
Place of birth for the foreign-born population - Other Northern Europe (%)
Place of birth for the foreign-born population - Austria (%)
Place of birth for the foreign-born population - Belgium (%)
Place of birth for the foreign-born population - France (%)
Place of birth for the foreign-born population - Germany (%)
Place of birth for the foreign-born population - Netherlands (%)
Place of birth for the foreign-born population - Switzerland (%)
Place of birth for the foreign-born population - Other Western Europe (%)
Place of birth for the foreign-born population - Greece (%)
Place of birth for the foreign-born population - Italy (%)
Place of birth for the foreign-born population - Portugal (%)
Place of birth for the foreign-born population - Spain (%)
Place of birth for the foreign-born population - Other Southern Europe (%)
Place of birth for the foreign-born population - Albania (%)
Place of birth for the foreign-born population - Belarus (%)
Place of birth for the foreign-born population - Bosnia and Herzegovina (%)
Place of birth for the foreign-born population - Bulgaria (%)
Place of birth for the foreign-born population - Croatia (%)
Place of birth for the foreign-born population - Czechoslovakia (%)
Place of birth for the foreign-born population - Hungary (%)
Place of birth for the foreign-born population - Latvia (%)
Place of birth for the foreign-born population - Lithuania (%)
Place of birth for the foreign-born population - North Macedonia (Macedonia) (%)
Place of birth for the foreign-born population - Moldova (%)
Place of birth for the foreign-born population - Poland (%)
Place of birth for the foreign-born population - Romania (%)
Place of birth for the foreign-born population - Russia (%)
Place of birth for the foreign-born population - Serbia (%)
Place of birth for the foreign-born population - Ukraine (%)
Place of birth for the foreign-born population - Other Eastern Europe (%)
Place of birth for the foreign-born population - China (%)
Place of birth for the foreign-born population - Hong Kong (%)
Place of birth for the foreign-born population - Taiwan (%)
Place of birth for the foreign-born population - Japan (%)
Place of birth for the foreign-born population - Korea (%)
Place of birth for the foreign-born population - Other Eastern Asia (%)
Place of birth for the foreign-born population - Afghanistan (%)
Place of birth for the foreign-born population - Bangladesh (%)
Place of birth for the foreign-born population - India (%)
Place of birth for the foreign-born population - Iran (%)
Place of birth for the foreign-born population - Kazakhstan (%)
Place of birth for the foreign-born population - Nepal (%)
Place of birth for the foreign-born population - Pakistan (%)
Place of birth for the foreign-born population - Sri Lanka (%)
Place of birth for the foreign-born population - Uzbekistan (%)
Place of birth for the foreign-born population - Other South Central Asia (%)
Place of birth for the foreign-born population - Burma (%)
Place of birth for the foreign-born population - Cambodia (%)
Place of birth for the foreign-born population - Indonesia (%)
Place of birth for the foreign-born population - Laos (%)
Place of birth for the foreign-born population - Malaysia (%)
Place of birth for the foreign-born population - Philippines (%)
Place of birth for the foreign-born population - Singapore (%)
Place of birth for the foreign-born population - Thailand (%)
Place of birth for the foreign-born population - Vietnam (%)
Place of birth for the foreign-born population - Other South Eastern Asia (%)
Place of birth for the foreign-born population - Armenia (%)
Place of birth for the foreign-born population - Iraq (%)
Place of birth for the foreign-born population - Israel (%)
Place of birth for the foreign-born population - Jordan (%)
Place of birth for the foreign-born population - Kuwait (%)
Place of birth for the foreign-born population - Lebanon (%)
Place of birth for the foreign-born population - Saudi Arabia (%)
Place of birth for the foreign-born population - Syria (%)
Place of birth for the foreign-born population - Turkey (%)
Place of birth for the foreign-born population - Yemen (%)
Place of birth for the foreign-born population - Other Western Asia (%)
Place of birth for the foreign-born population - Eritrea (%)
Place of birth for the foreign-born population - Ethiopia (%)
Place of birth for the foreign-born population - Kenya (%)
Place of birth for the foreign-born population - Somalia (%)
Place of birth for the foreign-born population - Uganda (%)
Place of birth for the foreign-born population - Zimbabwe (%)
Place of birth for the foreign-born population - Other Eastern Africa (%)
Place of birth for the foreign-born population - Cameroon (%)
Place of birth for the foreign-born population - Congo (%)
Place of birth for the foreign-born population - Democratic Republic of Congo (Zaire) (%)
Place of birth for the foreign-born population - Other Middle Africa (%)
Place of birth for the foreign-born population - Egypt (%)
Place of birth for the foreign-born population - Morocco (%)
Place of birth for the foreign-born population - Sudan (%)
Place of birth for the foreign-born population - Other Northern Africa (%)
Place of birth for the foreign-born population - South Africa (%)
Place of birth for the foreign-born population - Other Southern Africa (%)
Place of birth for the foreign-born population - Cabo Verde (%)
Place of birth for the foreign-born population - Ghana (%)
Place of birth for the foreign-born population - Liberia (%)
Place of birth for the foreign-born population - Nigeria (%)
Place of birth for the foreign-born population - Senegal (%)
Place of birth for the foreign-born population - Sierra Leone (%)
Place of birth for the foreign-born population - Other Western Africa (%)
Place of birth for the foreign-born population - Australia (%)
Place of birth for the foreign-born population - New Zealand (%)
Place of birth for the foreign-born population - Fiji (%)
Place of birth for the foreign-born population - Micronesia (%)
Place of birth for the foreign-born population - Bahamas (%)
Place of birth for the foreign-born population - Barbados (%)
Place of birth for the foreign-born population - Cuba (%)
Place of birth for the foreign-born population - Dominica (%)
Place of birth for the foreign-born population - Dominican Republic (%)
Place of birth for the foreign-born population - Grenada (%)
Place of birth for the foreign-born population - Haiti (%)
Place of birth for the foreign-born population - Jamaica (%)
Place of birth for the foreign-born population - St. Vincent and the Grenadines (%)
Place of birth for the foreign-born population - Trinidad and Tobago (%)
Place of birth for the foreign-born population - West Indies (%)
Place of birth for the foreign-born population - Other Caribbean (%)
Place of birth for the foreign-born population - Belize (%)
Place of birth for the foreign-born population - Costa Rica (%)
Place of birth for the foreign-born population - El Salvador (%)
Place of birth for the foreign-born population - Guatemala (%)
Place of birth for the foreign-born population - Honduras (%)
Place of birth for the foreign-born population - Mexico (%)
Place of birth for the foreign-born population - Nicaragua (%)
Place of birth for the foreign-born population - Panama (%)
Place of birth for the foreign-born population - Other Central America (%)
Place of birth for the foreign-born population - Argentina (%)
Place of birth for the foreign-born population - Bolivia (%)
Place of birth for the foreign-born population - Brazil (%)
Place of birth for the foreign-born population - Chile (%)
Place of birth for the foreign-born population - Colombia (%)
Place of birth for the foreign-born population - Ecuador (%)
Place of birth for the foreign-born population - Guyana (%)
Place of birth for the foreign-born population - Peru (%)
Place of birth for the foreign-born population - Uruguay (%)
Place of birth for the foreign-born population - Venezuela (%)
Place of birth for the foreign-born population - Other South America (%)
Place of birth for the foreign-born population - Canada (%)
Place of birth for the foreign-born population - Other Northern America (%)
Place of birth for the foreign-born population - Other (%)
Latest news about races in Greenville, NC collected exclusively by city-data.com from local newspapers, TV, and radio stations
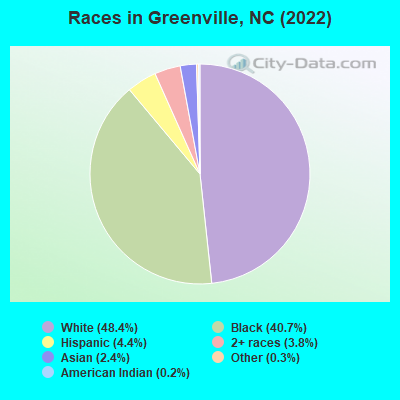
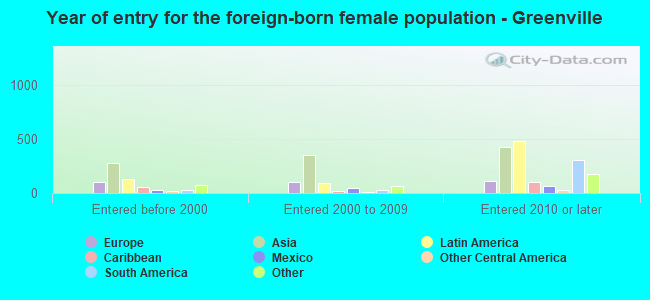
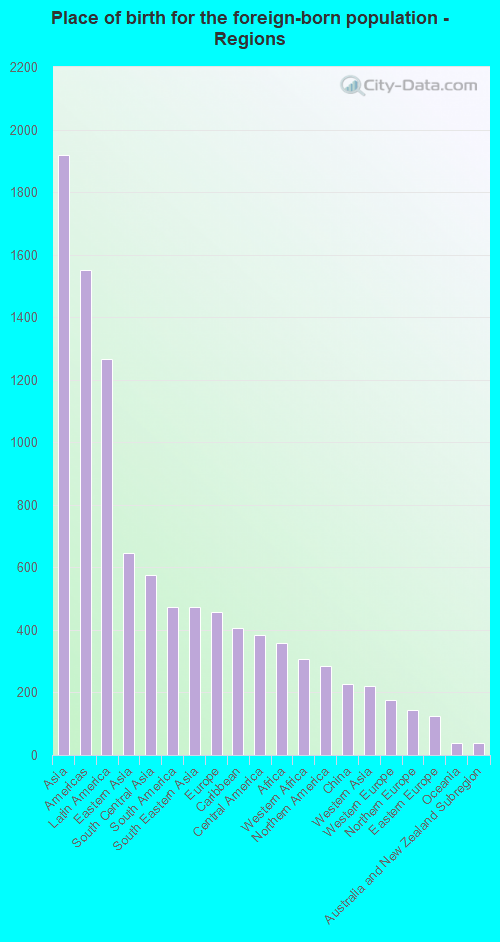
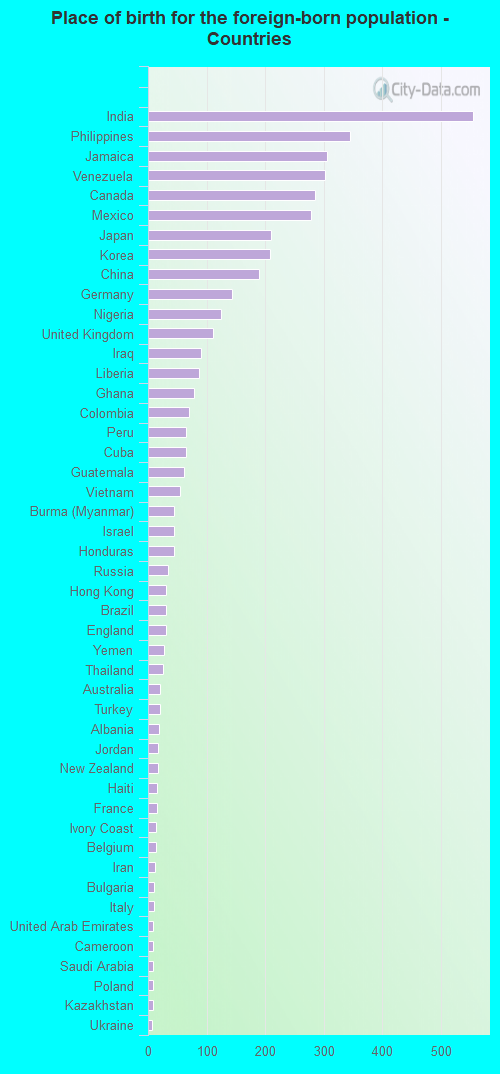
According to 2022 data, the most numerous races in Greenville, NC are White alone (43,133 residents), Black alone (36,262 residents), and Hispanic (3,931 residents). 93.9% of Greenville residents speak English at home. 4.9% of Greenville, NC residents are foreign-born (2.1% born in Asia, 1.4% born in Latin America, 0.5% born in Europe), which is 64.8% less than the foreign-born rate of 8.0% across the entire state of North Carolina.
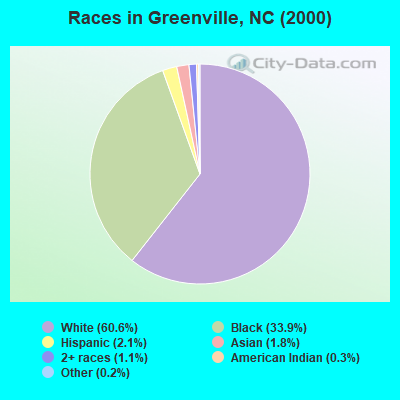
Race distribution in Greenville
2000 2022
5,647,155 70.2% White alone 1,723,301 21.4% Black alone 378,963 4.7% Hispanic 112,416 1.4% Asian alone 95,333 1.2% American Indian alone 79,965 1.0% Two or more races 9,015 0.1% Other race alone 3,165 0.04% Native Hawaiian and Other
6,497,519 60.7% White alone 2,155,650 20.1% Black alone 1,114,799 10.4% Hispanic 438,061 4.1% Two or more races 341,052 3.2% Asian alone 91,758 0.9% American Indian alone 50,180 0.5% Other race alone 9,954 0.09% Native Hawaiian and Other
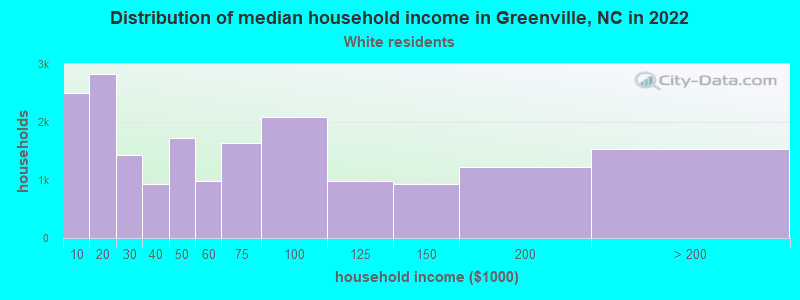
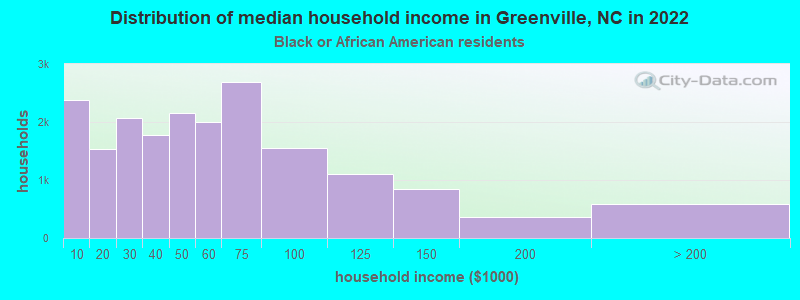
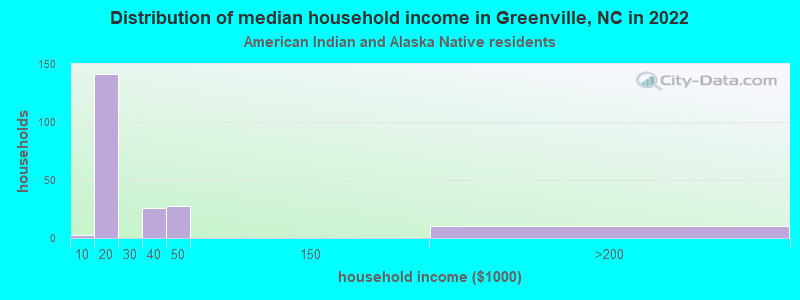
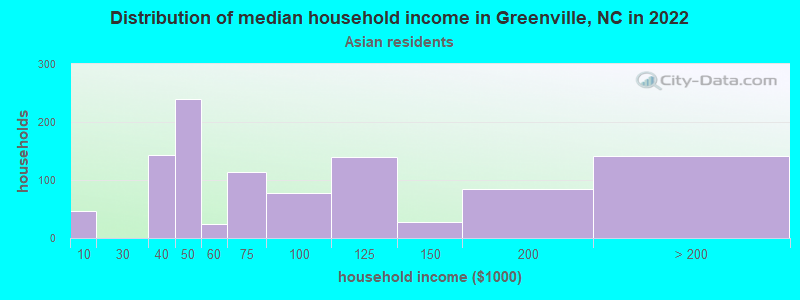
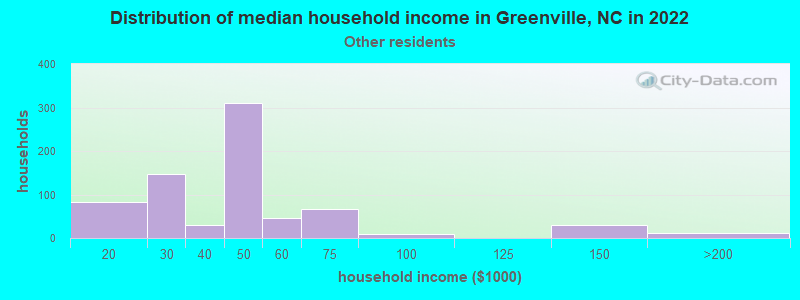
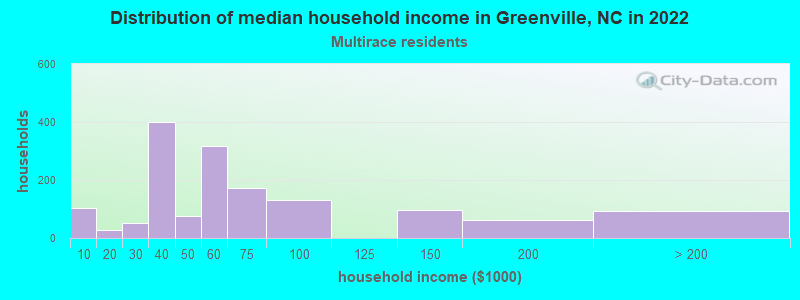
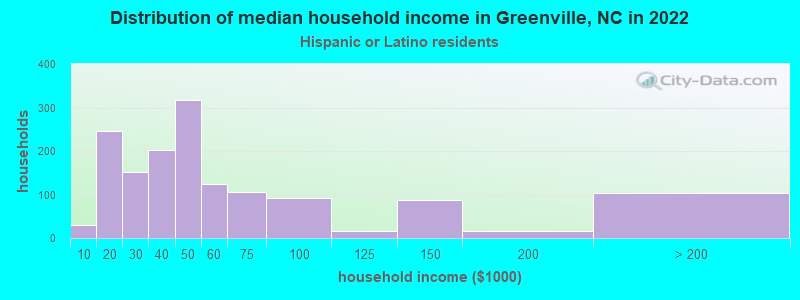
Income and house value in Greenville Median household income in 2022 $49,437 White non-Hispanic householders$47,557 Black householders$74,594 Asian householders$41,324 Some other race householders$58,774 Two or more races householders$46,383 Hispanic or Latino race householdersMedian 2022 house value $314,312 White Non-Hispanic householders$186,928 Black or African American householders$240,193 American Indian or Alaska Native householders $387,425 Asian householders$251,248 Some other race householdersover $1,000,000 Two or more races householders$249,489 Hispanic or Latino householders
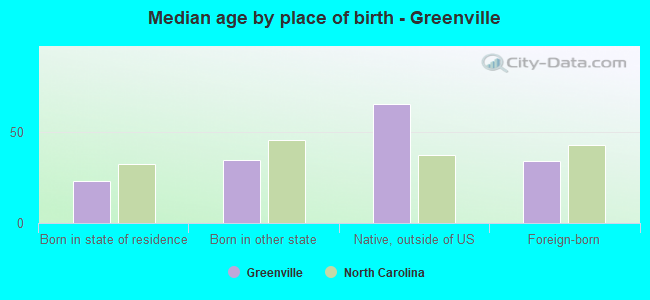
Median age by race in Greenville
26.7 Median age for White residents26.6 26.9 30.5 Median age for Black or African American residents29.4 31.8 35.2 Median age for American Indian / Alaska Native residents21.0 36.1 32.9 Median age for Asian residents33.3 32.7 -666,666,666.0 Median age for Native Hawaiian / Pacific Islander residents-666,666,666.0 -666,666,666.0 25.3 Median age for Other race residents20.6 25.9 21.1 Median age for Two or more races residents21.2 19.8 26.7 Median age for White alone residents26.6 26.8 25.7 Median age for Hispanic or Latino residents20.9 31.4
Owner/renter occupied households by race in Greenville
House owners and renters - White residents 7,608 40.5% Owner occupied11,168 59.5% Renter occupiedHouse owners and renters - Black or African American residents 5,025 26.3% Owner occupied14,066 73.7% Renter occupiedHouse owners and renters - American Indian / Alaska Native residents 10 5.2% Owner occupied179 94.8% Renter occupiedHouse owners and renters - Asian residents 377 35.6% Owner occupied683 64.4% Renter occupiedHouse owners and renters - Other race residents 102 12.0% Owner occupied746 88.0% Renter occupiedHouse owners and renters - Two or more races residents 801 44.2% Owner occupied1,012 55.8% Renter occupiedHouse owners and renters - White alone residents 7,496 40.4% Owner occupied11,064 59.6% Renter occupiedHouse owners and renters - Hispanic or Latino residents 463 33.3% Owner occupied929 66.7% Renter occupied
Language usage in Greenville
English speakers - Total 93.9% of residents of Greenville speak English at home.
2.8% of residents speak Spanish at home 894 38.3% Speak English very well1,443 61.7% Speak English less than very well3.3% of residents speak other language at home 1,663 59.8% Speak English very well1,120 40.2% Speak English less than very well
English speakers - Born in the United States 96.8% of residents of Greenville speak English at home.
2.0% of residents speak Spanish at home 483 91.0% Speak English very well48 9.0% Speak English less than very well1.1% of residents speak other language at home 289 100.0% Speak English very well
English speakers - Native, born elsewhere 87.4% of residents of Greenville speak English at home.
3.4% of residents speak Spanish at home 30 100.0% Speak English very well9.2% of residents speak other language at home 82 100.0% Speak English very well
English speakers - Foreign-born 40.6% of residents of Greenville speak English at home.
20.7% of residents speak Spanish at home 97 8.2% Speak English very well1,093 91.8% Speak English less than very well38.7% of residents speak other language at home 1,110 49.8% Speak English very well1,120 50.2% Speak English less than very well
White (Caucasian) - Speak only English Native:
96.3% (39,206)Foreign-born:
65.9% (862)
White (Caucasian) - Speak another language Native:
3.3% (1,358)Foreign-born:
37.2% (487)
Black or African American - Speak only English Native:
99.3% (31,557)Foreign-born:
69.1% (566)
Black or African American - Speak another language Native:
0.7% (238)Foreign-born:
31.4% (257)
American Indian / Alaska Native - Speak only English Native:
97.4% (250)Foreign-born:
53.7% (19)
Asian - Speak only English Native:
78.9% (306)Foreign-born:
33.7% (660)
Asian - Speak another language Native:
21.1% (82)Foreign-born:
66.3% (1,301)
Other race - Speak only English Native:
25.2% (221)Foreign-born:
10.7% (58)
Other race - Speak another language Native:
69.6% (610)Foreign-born:
93.8% (513)
Two or more races - Speak only English Native:
88.0% (3,859)Foreign-born:
17.6% (22)
Two or more races - Speak another language Native:
10.3% (453)Foreign-born:
81.7% (101)
White alone - Speak only English Native:
96.7% (38,678)Foreign-born:
59.2% (814)
White alone - Speak another language Native:
3.1% (1,259)Foreign-born:
40.9% (563)
Hispanic or Latino - Speak only English Native:
50.2% (1,373)Foreign-born:
21.3% (187)
Hispanic or Latino - Speak another language Native:
46.4% (1,269)Foreign-born:
84.8% (746)
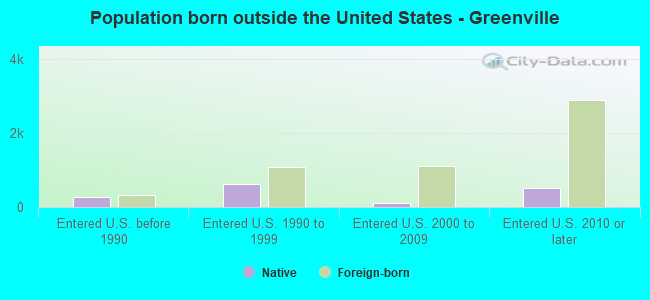
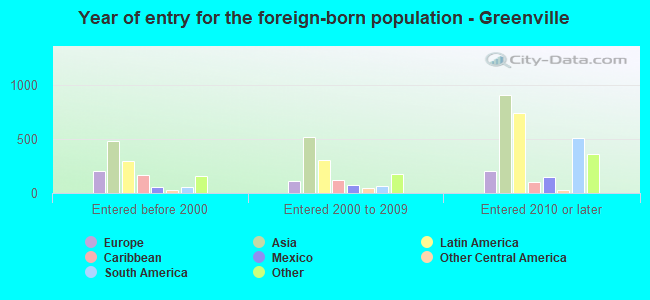
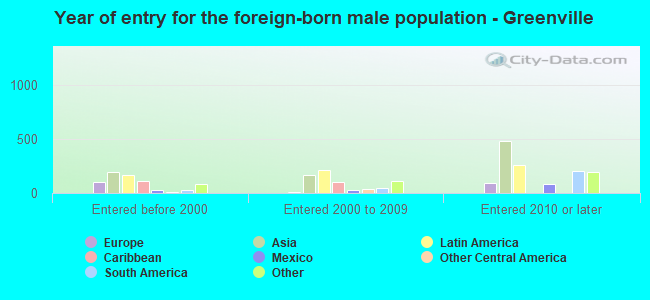
Foreign-born residents in Greenville 4,325 residents are foreign born (2.1% Asia , 1.4% Latin America , 0.5% Europe ).
This city:
4.9%North Carolina:
8.3%
Marital status for residents in Greenville Marital status - White (Caucasian) population 15 years and over
Males 54.5% Never married37.2% Now married1.9% Separated0.6% Widowed5.7% DivorcedFemales 49.7% Never married31.0% Now married0.6% Separated7.8% Widowed11.0% DivorcedWomen who gave birth in the past 12 months Now married:
100.0% (364)Unmarried:
0.0% (0)
Women who did not give birth in the past 12 months Now married:
24.7% (3,529)Unmarried:
75.3% (10,773)
Marital status - Black or African American population 15 years and over
Males 50.0% Never married35.4% Now married4.0% Separated0.6% Widowed9.9% DivorcedFemales 51.1% Never married28.4% Now married4.5% Separated4.9% Widowed11.1% DivorcedWomen who gave birth in the past 12 months Now married:
38.1% (357)Unmarried:
61.9% (580)
Women who did not give birth in the past 12 months Now married:
27.8% (2,965)Unmarried:
72.2% (7,716)
Marital status - American Indian / Alaska Native population 15 years and over
Males 70.7% Never married19.5% Now married0.0% Separated9.8% Widowed0.0% DivorcedFemales 38.0% Never married4.1% Now married57.9% Separated0.0% Widowed0.0% DivorcedWomen who did not give birth in the past 12 months Now married:
58.2% (124)Unmarried:
41.8% (89)
Marital status - Asian population 15 years and over
Males 34.6% Never married61.6% Now married3.8% Separated0.0% Widowed0.0% DivorcedFemales 36.5% Never married53.7% Now married3.3% Separated4.3% Widowed2.3% DivorcedWomen who gave birth in the past 12 months Now married:
100.0% (36)Unmarried:
0.0% (0)
Women who did not give birth in the past 12 months Now married:
52.9% (453)Unmarried:
47.1% (404)
Marital status - Other race population 15 years and over
Males 71.4% Never married19.2% Now married3.1% Separated0.0% Widowed6.3% DivorcedFemales 53.8% Never married21.4% Now married3.9% Separated0.0% Widowed21.0% DivorcedWomen who gave birth in the past 12 months Now married:
100.0% (7)Unmarried:
0.0% (0)
Women who did not give birth in the past 12 months Now married:
27.8% (213)Unmarried:
72.2% (553)
Marital status - Two or more races population 15 years and over
Males 67.8% Never married27.2% Now married0.0% Separated0.0% Widowed5.0% DivorcedFemales 60.7% Never married31.4% Now married2.1% Separated1.5% Widowed4.2% DivorcedWomen who gave birth in the past 12 months Now married:
100.0% (16)Unmarried:
0.0% (0)
Women who did not give birth in the past 12 months Now married:
28.1% (568)Unmarried:
71.9% (1,456)
Marital status - White alone, not Hispanic / Latino population 15 years and over
Males 54.8% Never married36.8% Now married1.9% Separated0.6% Widowed5.8% DivorcedFemales 49.8% Never married30.9% Now married0.6% Separated7.9% Widowed10.8% DivorcedWomen who gave birth in the past 12 months Now married:
100.0% (364)Unmarried:
0.0% (0)
Women who did not give birth in the past 12 months Now married:
25.0% (3,529)Unmarried:
75.0% (10,595)
Marital status - Hispanic or Latino population 15 years and over
Males 51.0% Never married43.1% Now married1.6% Separated0.0% Widowed4.4% DivorcedFemales 54.8% Never married24.9% Now married8.0% Separated2.3% Widowed10.1% DivorcedWomen who gave birth in the past 12 months Now married:
100.0% (20)Unmarried:
0.0% (0)
Women who did not give birth in the past 12 months Now married:
32.6% (549)Unmarried:
67.4% (1,135)
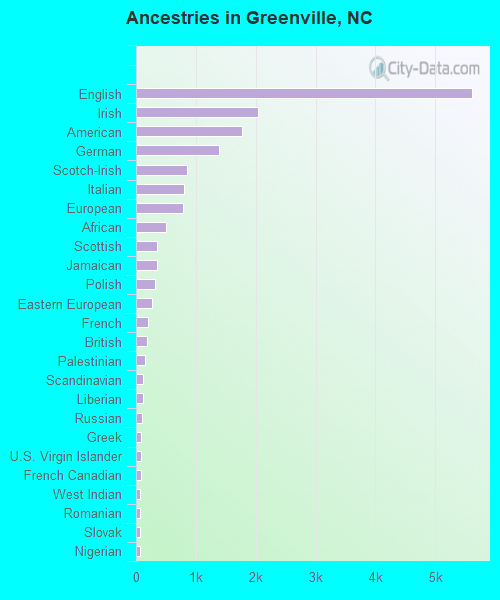
Ancestries in Greenville
5,618 14.7% English2,036 5.3% Irish1,763 4.6% American1,391 3.6% German852 2.2% Scotch-Irish796 2.1% Italian782 2.1% European508 1.3% African356 0.9% Scottish355 0.9% Jamaican323 0.8% Polish268 0.7% Eastern European195 0.5% French185 0.5% British144 0.4% Palestinian124 0.3% Scandinavian110 0.3% Liberian94 0.2% Russian90 0.2% Greek77 0.2% U.S. Virgin Islander77 0.2% French Canadian71 0.2% West Indian68 0.2% Romanian66 0.2% Slovak66 0.2% Nigerian59 0.2% Canadian50 0.1% Dutch44 0.1% Albanian40 0.1% Swiss39 0.1% Iraqi34 0.09% Ukrainian29 0.08% Sudanese29 0.08% Haitian27 0.07% Brazilian24 0.06% Norwegian24 0.06% Northern European22 0.06% Lebanese17 0.04% Iranian17 0.04% Welsh15 0.04% Turkish13 0.03% Czech12 0.03% Armenian11 0.03% Ghanaian11 0.03% Barbadian10 0.03% Jordanian10 0.03% Portuguese6 0.02% Danish5 0.01% Guyanese4 0.01% Serbian2 0.01% Hungarian2 0.01% Kenyan
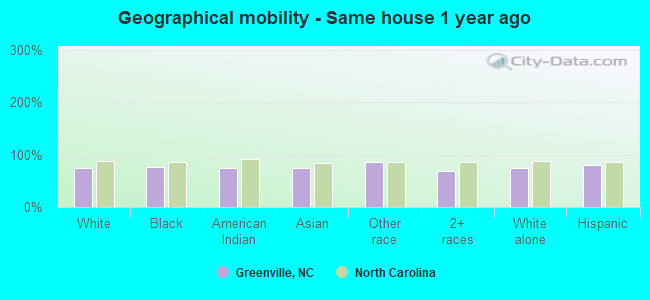
Geographical mobility in Greenville Same house 1 year ago 30,880 74.8% White (Caucasian)28,710 75.4% Black or African American219 75.0% American Indian / Alaska Native1,978 74.3% Asian2,070 85.5% Other race2,978 68.8% Two or more races30,493 75.1% White alone, not Hispanic / Latino3,094 79.4% Hispanic or LatinoMoved within same county 3,003 7.3% White / Caucasian4,653 12.2% Black or African American13 4.5% American Indian / Alaska Native119 4.5% Asian153 6.3% Other race909 21.0% Two or more races3,003 7.4% White alone, not Hispanic / Latino212 5.4% Hispanic or LatinoMoved within same state 4,951 12.0% White / Caucasian3,050 8.0% Black or African American43 14.6% American Indian / Alaska Native234 8.8% Asian204 8.4% Other race310 7.2% Two or more races4,664 11.5% White alone, not Hispanic / Latino301 7.7% Hispanic or LatinoMoved from different state 2,465 6.0% White / Caucasian1,112 2.9% Black or African American213 8.0% Asian134 3.1% Two or more races2,465 6.1% White alone, not Hispanic / Latino259 6.6% Hispanic or LatinoMoved from abroad 571 1.5% Black or African American60 2.2% Asian41 1.0% Hispanic or Latino
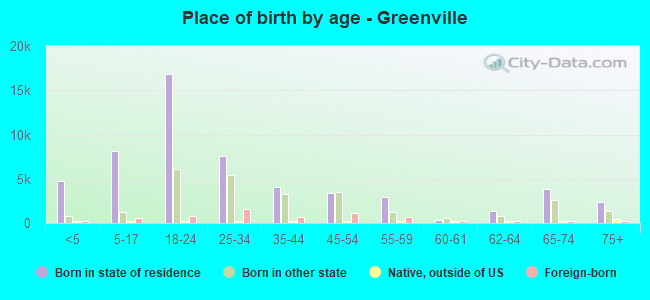
Children Nativity (place of birth) in Greenville
Children under 6 years - Living with two parents Both parents native 2,408 100.0% NativeBoth parents foreign-born 150 51.2% Native143 48.8% Foreign-bornOne native, one foreign-born parent 454 100.0% NativeChildren under 6 years - Living with one parent Native parent 2,567 100.0% NativeForeign-born parent 316 100.0% NativeChildren 6 to 17 years - Living with two parents Both parents native 2,886 99.1% Native25 0.9% Foreign-bornBoth parents foreign-born 168 65.1% Native90 34.9% Foreign-bornOne native, one foreign-born parent 1,011 100.0% NativeChildren 6 to 17 years - Living with one parent Native parent 5,831 100.0% NativeForeign-born parent 544 55.0% Native444 45.0% Foreign-born
Grandparents responsible for own grandchildren in Greenville
Grandparents (30 to 59 years) White / Caucasian 57 73.1% Responsible for grandchildren21 26.9% Not responsible for grandchildrenBlack or African American 13 4.2% Responsible for grandchildren304 95.8% Not responsible for grandchildrenAmerican Indian / Alaska Native 11 100.0% Responsible for grandchildrenAsian 33 100.0% Not responsible for grandchildrenOther race 36 100.0% Responsible for grandchildrenTwo or more races 56 100.0% Not responsible for grandchildrenWhite alone, not Hispanic / Latino 61 73.7% Responsible for grandchildren22 26.3% Not responsible for grandchildrenHispanic or Latino 28 100.0% Responsible for grandchildrenGrandparents (60 years and over) White / Caucasian 46 41.1% Responsible for grandchildren66 58.9% Not responsible for grandchildrenBlack or African American 139 40.4% Responsible for grandchildren204 59.6% Not responsible for grandchildrenAsian 91 100.0% Not responsible for grandchildrenTwo or more races 106 100.0% Responsible for grandchildrenWhite alone, not Hispanic / Latino 47 41.2% Responsible for grandchildren67 58.8% Not responsible for grandchildrenHispanic or Latino 45 100.0% Responsible for grandchildren