Races in Gretna, Louisiana (LA) Detailed Stats
Data:
Races - White alone (%)
Races - White alone (% change since 2000)
Races - Black alone (%)
Races - Black alone (% change since 2000)
Races - American Indian alone (%)
Races - American Indian alone (% change since 2000)
Races - Asian alone (%)
Races - Asian alone (% change since 2000)
Races - Hispanic (%)
Races - Hispanic (% change since 2000)
Races - Native Hawaiian and Other Pacific Islander alone (%)
Races - Native Hawaiian and Other Pacific Islander alone (% change since 2000)
Races - Two or more races(%)
Races - Two or more races(% change since 2000)
Races - Other race alone (%)
Races - Other race alone (% change since 2000)
Racial diversity
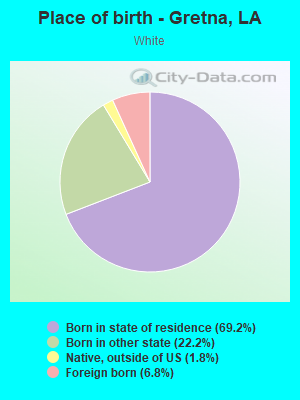
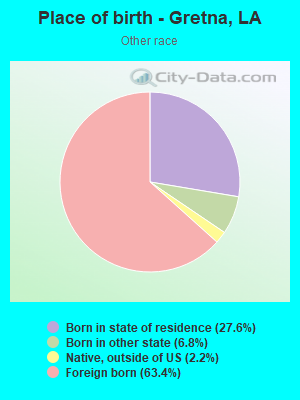
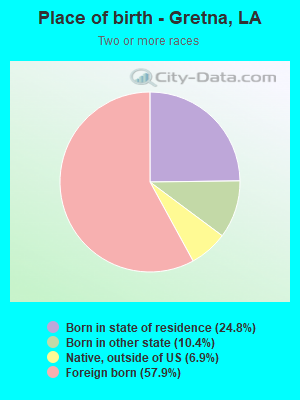
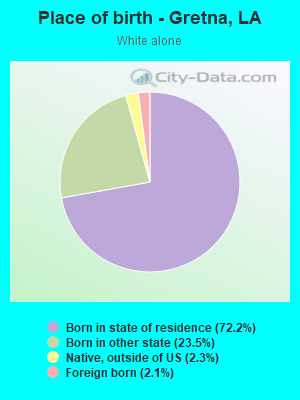
Place of birth - Born in state of residence (%)
Place of birth - Born in state of residence (%) - White
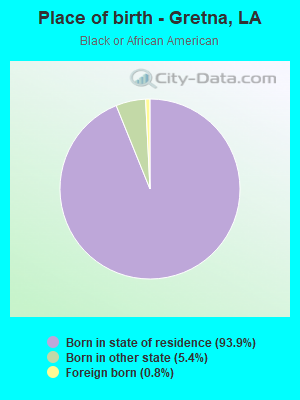
Place of birth - Born in state of residence (%) - Black or African American
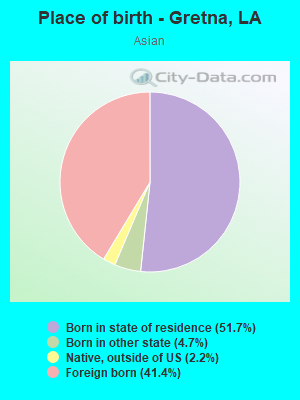
Place of birth - Born in state of residence (%) - Asian
Place of birth - Born in state of residence (%) - Hispanic or Latino
Place of birth - Born in state of residence (%) - American Indian and Alaska Native
Place of birth - Born in state of residence (%) - Multirace
Place of birth - Born in state of residence (%) - Other Race
Place of birth - Born in other state (%)
Place of birth - Born in other state (%) - White
Place of birth - Born in other state (%) - Black or African American
Place of birth - Born in other state (%) - Asian
Place of birth - Born in other state (%) - Hispanic or Latino
Place of birth - Born in other state (%) - American Indian and Alaska Native
Place of birth - Born in other state (%) - Multirace
Place of birth - Born in other state (%) - Other Race
Place of birth - Native, outside of US (%)
Place of birth - Native, outside of US (%) - White
Place of birth - Native, outside of US (%) - Black or African American
Place of birth - Native, outside of US (%) - Asian
Place of birth - Native, outside of US (%) - Hispanic or Latino
Place of birth - Native, outside of US (%) - American Indian and Alaska Native
Place of birth - Native, outside of US (%) - Multirace
Place of birth - Native, outside of US (%) - Other Race
Place of birth - Foreign born (%)
Place of birth - Foreign born (%) - White
Place of birth - Foreign born (%) - Black or African American
Place of birth - Foreign born (%) - Asian
Place of birth - Foreign born (%) - Hispanic or Latino
Place of birth - Foreign born (%) - American Indian and Alaska Native
Place of birth - Foreign born (%) - Multirace
Place of birth - Foreign born (%) - Other Race
Residents speaking English at home (%)
Residents speaking English at home - Born in the United States (%)
Residents speaking English at home - Native, born elsewhere (%)
Residents speaking English at home - Foreign born (%)
Residents speaking Spanish at home (%)
Residents speaking Spanish at home - Born in the United States (%)
Residents speaking Spanish at home - Native, born elsewhere (%)
Residents speaking Spanish at home - Foreign born (%)
Residents speaking other language at home (%)
Residents speaking other language at home - Born in the United States (%)
Residents speaking other language at home - Native, born elsewhere (%)
Residents speaking other language at home - Foreign born (%)
Marital status - Never married (%)
Marital status - Now married (%)
Marital status - Separated (%)
Marital status - Widowed (%)
Marital status - Divorced (%)
Ancestries Reported - Arab (%)
Ancestries Reported - Czech (%)
Ancestries Reported - Danish (%)
Ancestries Reported - Dutch (%)
Ancestries Reported - English (%)
Ancestries Reported - French (%)
Ancestries Reported - French Canadian (%)
Ancestries Reported - German (%)
Ancestries Reported - Greek (%)
Ancestries Reported - Hungarian (%)
Ancestries Reported - Irish (%)
Ancestries Reported - Italian (%)
Ancestries Reported - Lithuanian (%)
Ancestries Reported - Norwegian (%)
Ancestries Reported - Polish (%)
Ancestries Reported - Portuguese (%)
Ancestries Reported - Russian (%)
Ancestries Reported - Scotch-Irish (%)
Ancestries Reported - Scottish (%)
Ancestries Reported - Slovak (%)
Ancestries Reported - Subsaharan African (%)
Ancestries Reported - Swedish (%)
Ancestries Reported - Swiss (%)
Ancestries Reported - Ukrainian (%)
Ancestries Reported - United States (%)
Ancestries Reported - Welsh (%)
Ancestries Reported - West Indian (%)
Ancestries Reported - Other (%)
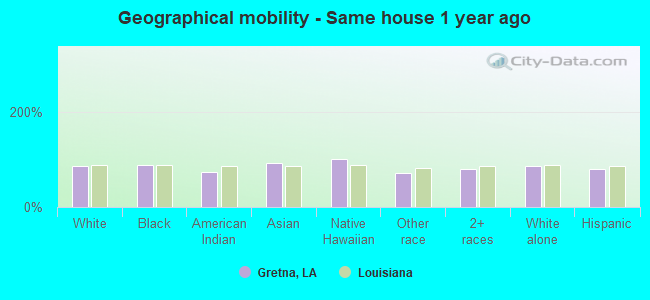
Geographical mobility - Same house 1 year ago (%)
Geographical mobility - Same house 1 year ago (%) - White
Geographical mobility - Same house 1 year ago (%) - Black or African American
Geographical mobility - Same house 1 year ago (%) - Asian
Geographical mobility - Same house 1 year ago (%) - Hispanic or Latino
Geographical mobility - Same house 1 year ago (%) - American Indian and Alaska Native
Geographical mobility - Same house 1 year ago (%) - Multirace
Geographical mobility - Same house 1 year ago (%) - Other Race
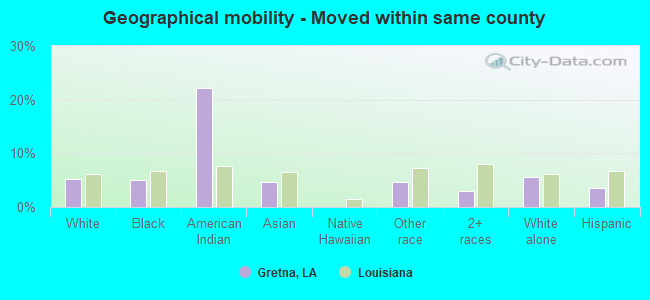
Geographical mobility - Moved within same county (%)
Geographical mobility - Moved within same county (%) - White
Geographical mobility - Moved within same county (%) - Black or African American
Geographical mobility - Moved within same county (%) - Asian
Geographical mobility - Moved within same county (%) - Hispanic or Latino
Geographical mobility - Moved within same county (%) - American Indian and Alaska Native
Geographical mobility - Moved within same county (%) - Multirace
Geographical mobility - Moved within same county (%) - Other Race
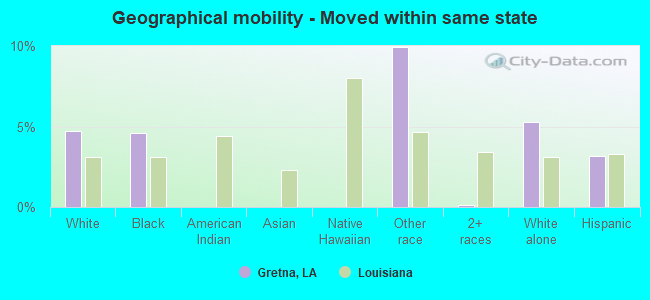
Geographical mobility - Moved from different county within same state (%)
Geographical mobility - Moved from different county within same state (%) - White
Geographical mobility - Moved from different county within same state (%) - Black or African American
Geographical mobility - Moved from different county within same state (%) - Asian
Geographical mobility - Moved from different county within same state (%) - Hispanic or Latino
Geographical mobility - Moved from different county within same state (%) - American Indian and Alaska Native
Geographical mobility - Moved from different county within same state (%) - Multirace
Geographical mobility - Moved from different county within same state (%) - Other Race
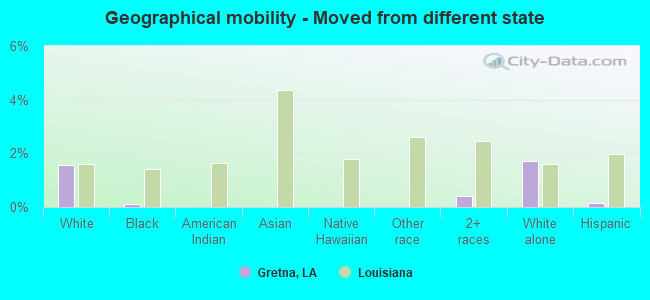
Geographical mobility - Moved from different state (%)
Geographical mobility - Moved from different state (%) - White
Geographical mobility - Moved from different state (%) - Black or African American
Geographical mobility - Moved from different state (%) - Asian
Geographical mobility - Moved from different state (%) - Hispanic or Latino
Geographical mobility - Moved from different state (%) - American Indian and Alaska Native
Geographical mobility - Moved from different state (%) - Multirace
Geographical mobility - Moved from different state (%) - Other Race
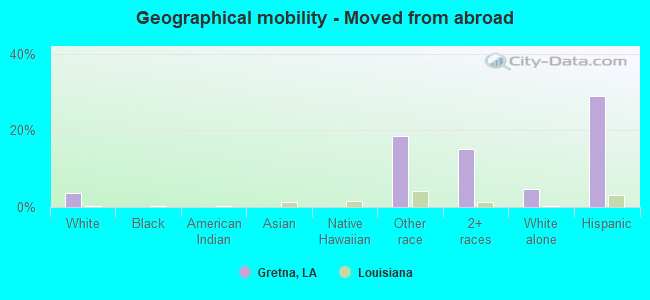
Geographical mobility - Moved from abroad (%)
Geographical mobility - Moved from abroad (%) - White
Geographical mobility - Moved from abroad (%) - Black or African American
Geographical mobility - Moved from abroad (%) - Asian
Geographical mobility - Moved from abroad (%) - Hispanic or Latino
Geographical mobility - Moved from abroad (%) - American Indian and Alaska Native
Geographical mobility - Moved from abroad (%) - Multirace
Geographical mobility - Moved from abroad (%) - Other Race
Place of birth for the foreign-born population - Ireland (%)
Place of birth for the foreign-born population - Denmark (%)
Place of birth for the foreign-born population - Norway (%)
Place of birth for the foreign-born population - Sweden (%)
Place of birth for the foreign-born population - United Kingdom (%)
Place of birth for the foreign-born population - England (%)
Place of birth for the foreign-born population - Scotland (%)
Place of birth for the foreign-born population - Other Northern Europe (%)
Place of birth for the foreign-born population - Austria (%)
Place of birth for the foreign-born population - Belgium (%)
Place of birth for the foreign-born population - France (%)
Place of birth for the foreign-born population - Germany (%)
Place of birth for the foreign-born population - Netherlands (%)
Place of birth for the foreign-born population - Switzerland (%)
Place of birth for the foreign-born population - Other Western Europe (%)
Place of birth for the foreign-born population - Greece (%)
Place of birth for the foreign-born population - Italy (%)
Place of birth for the foreign-born population - Portugal (%)
Place of birth for the foreign-born population - Spain (%)
Place of birth for the foreign-born population - Other Southern Europe (%)
Place of birth for the foreign-born population - Albania (%)
Place of birth for the foreign-born population - Belarus (%)
Place of birth for the foreign-born population - Bosnia and Herzegovina (%)
Place of birth for the foreign-born population - Bulgaria (%)
Place of birth for the foreign-born population - Croatia (%)
Place of birth for the foreign-born population - Czechoslovakia (%)
Place of birth for the foreign-born population - Hungary (%)
Place of birth for the foreign-born population - Latvia (%)
Place of birth for the foreign-born population - Lithuania (%)
Place of birth for the foreign-born population - North Macedonia (Macedonia) (%)
Place of birth for the foreign-born population - Moldova (%)
Place of birth for the foreign-born population - Poland (%)
Place of birth for the foreign-born population - Romania (%)
Place of birth for the foreign-born population - Russia (%)
Place of birth for the foreign-born population - Serbia (%)
Place of birth for the foreign-born population - Ukraine (%)
Place of birth for the foreign-born population - Other Eastern Europe (%)
Place of birth for the foreign-born population - China (%)
Place of birth for the foreign-born population - Hong Kong (%)
Place of birth for the foreign-born population - Taiwan (%)
Place of birth for the foreign-born population - Japan (%)
Place of birth for the foreign-born population - Korea (%)
Place of birth for the foreign-born population - Other Eastern Asia (%)
Place of birth for the foreign-born population - Afghanistan (%)
Place of birth for the foreign-born population - Bangladesh (%)
Place of birth for the foreign-born population - India (%)
Place of birth for the foreign-born population - Iran (%)
Place of birth for the foreign-born population - Kazakhstan (%)
Place of birth for the foreign-born population - Nepal (%)
Place of birth for the foreign-born population - Pakistan (%)
Place of birth for the foreign-born population - Sri Lanka (%)
Place of birth for the foreign-born population - Uzbekistan (%)
Place of birth for the foreign-born population - Other South Central Asia (%)
Place of birth for the foreign-born population - Burma (%)
Place of birth for the foreign-born population - Cambodia (%)
Place of birth for the foreign-born population - Indonesia (%)
Place of birth for the foreign-born population - Laos (%)
Place of birth for the foreign-born population - Malaysia (%)
Place of birth for the foreign-born population - Philippines (%)
Place of birth for the foreign-born population - Singapore (%)
Place of birth for the foreign-born population - Thailand (%)
Place of birth for the foreign-born population - Vietnam (%)
Place of birth for the foreign-born population - Other South Eastern Asia (%)
Place of birth for the foreign-born population - Armenia (%)
Place of birth for the foreign-born population - Iraq (%)
Place of birth for the foreign-born population - Israel (%)
Place of birth for the foreign-born population - Jordan (%)
Place of birth for the foreign-born population - Kuwait (%)
Place of birth for the foreign-born population - Lebanon (%)
Place of birth for the foreign-born population - Saudi Arabia (%)
Place of birth for the foreign-born population - Syria (%)
Place of birth for the foreign-born population - Turkey (%)
Place of birth for the foreign-born population - Yemen (%)
Place of birth for the foreign-born population - Other Western Asia (%)
Place of birth for the foreign-born population - Eritrea (%)
Place of birth for the foreign-born population - Ethiopia (%)
Place of birth for the foreign-born population - Kenya (%)
Place of birth for the foreign-born population - Somalia (%)
Place of birth for the foreign-born population - Uganda (%)
Place of birth for the foreign-born population - Zimbabwe (%)
Place of birth for the foreign-born population - Other Eastern Africa (%)
Place of birth for the foreign-born population - Cameroon (%)
Place of birth for the foreign-born population - Congo (%)
Place of birth for the foreign-born population - Democratic Republic of Congo (Zaire) (%)
Place of birth for the foreign-born population - Other Middle Africa (%)
Place of birth for the foreign-born population - Egypt (%)
Place of birth for the foreign-born population - Morocco (%)
Place of birth for the foreign-born population - Sudan (%)
Place of birth for the foreign-born population - Other Northern Africa (%)
Place of birth for the foreign-born population - South Africa (%)
Place of birth for the foreign-born population - Other Southern Africa (%)
Place of birth for the foreign-born population - Cabo Verde (%)
Place of birth for the foreign-born population - Ghana (%)
Place of birth for the foreign-born population - Liberia (%)
Place of birth for the foreign-born population - Nigeria (%)
Place of birth for the foreign-born population - Senegal (%)
Place of birth for the foreign-born population - Sierra Leone (%)
Place of birth for the foreign-born population - Other Western Africa (%)
Place of birth for the foreign-born population - Australia (%)
Place of birth for the foreign-born population - New Zealand (%)
Place of birth for the foreign-born population - Fiji (%)
Place of birth for the foreign-born population - Micronesia (%)
Place of birth for the foreign-born population - Bahamas (%)
Place of birth for the foreign-born population - Barbados (%)
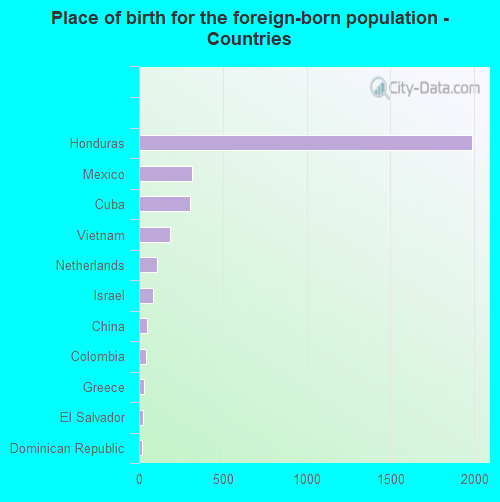
Place of birth for the foreign-born population - Cuba (%)
Place of birth for the foreign-born population - Dominica (%)
Place of birth for the foreign-born population - Dominican Republic (%)
Place of birth for the foreign-born population - Grenada (%)
Place of birth for the foreign-born population - Haiti (%)
Place of birth for the foreign-born population - Jamaica (%)
Place of birth for the foreign-born population - St. Vincent and the Grenadines (%)
Place of birth for the foreign-born population - Trinidad and Tobago (%)
Place of birth for the foreign-born population - West Indies (%)
Place of birth for the foreign-born population - Other Caribbean (%)
Place of birth for the foreign-born population - Belize (%)
Place of birth for the foreign-born population - Costa Rica (%)
Place of birth for the foreign-born population - El Salvador (%)
Place of birth for the foreign-born population - Guatemala (%)
Place of birth for the foreign-born population - Honduras (%)
Place of birth for the foreign-born population - Mexico (%)
Place of birth for the foreign-born population - Nicaragua (%)
Place of birth for the foreign-born population - Panama (%)
Place of birth for the foreign-born population - Other Central America (%)
Place of birth for the foreign-born population - Argentina (%)
Place of birth for the foreign-born population - Bolivia (%)
Place of birth for the foreign-born population - Brazil (%)
Place of birth for the foreign-born population - Chile (%)
Place of birth for the foreign-born population - Colombia (%)
Place of birth for the foreign-born population - Ecuador (%)
Place of birth for the foreign-born population - Guyana (%)
Place of birth for the foreign-born population - Peru (%)
Place of birth for the foreign-born population - Uruguay (%)
Place of birth for the foreign-born population - Venezuela (%)
Place of birth for the foreign-born population - Other South America (%)
Place of birth for the foreign-born population - Canada (%)
Place of birth for the foreign-born population - Other Northern America (%)
Place of birth for the foreign-born population - Other (%)
Latest news about races in Gretna, LA collected exclusively by city-data.com from local newspapers, TV, and radio stations
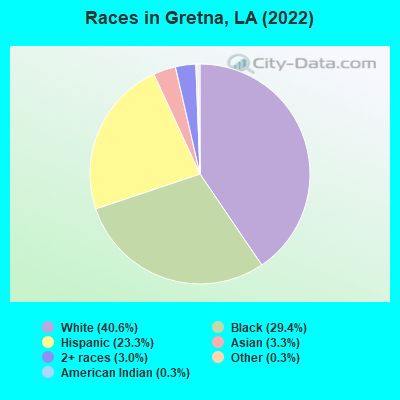
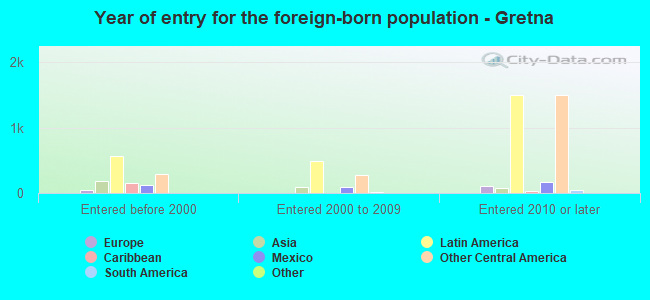
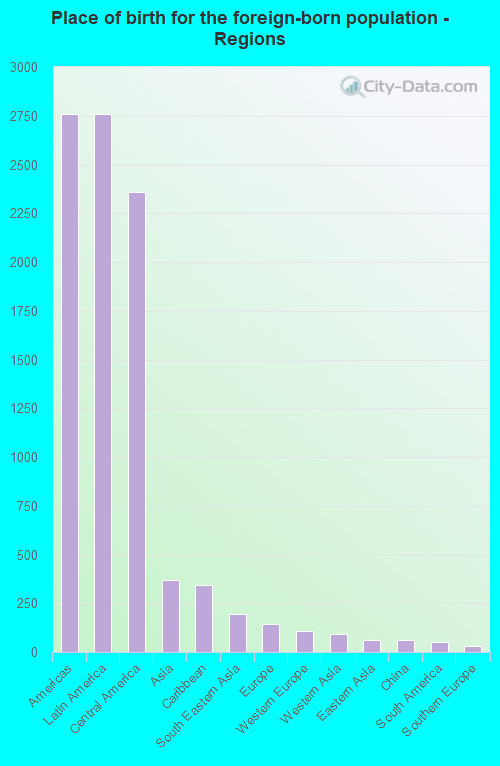
According to 2022 data, the most numerous races in Gretna, LA are White alone (7,000 residents), Black alone (5,064 residents), and Hispanic (4,016 residents). 77.2% of Gretna residents speak English at home. 19.1% of Gretna, LA residents are foreign-born (15.3% born in Latin America, 2.1% born in Asia), which is 79.0% greater than the foreign-born rate of 4.0% across the entire state of Louisiana.
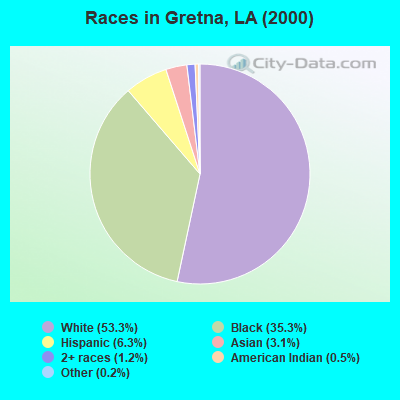
Race distribution in Gretna
2000 2022
2,794,391 62.5% White alone 1,443,390 32.3% Black alone 107,738 2.4% Hispanic 54,256 1.2% Asian alone 39,260 0.9% Two or more races 24,129 0.5% American Indian alone 4,736 0.1% Other race alone 1,076 0.02% Native Hawaiian and Other
2,603,221 56.7% White alone 1,420,055 30.9% Black alone 262,213 5.7% Hispanic 183,270 4.0% Two or more races 81,169 1.8% Asian alone 19,991 0.4% American Indian alone 18,043 0.4% Other race alone 2,279 0.05% Native Hawaiian and Other
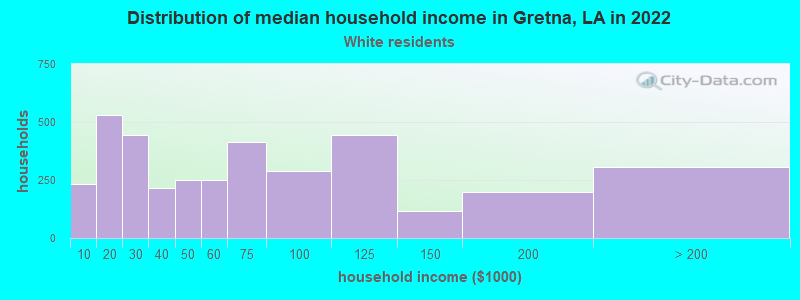
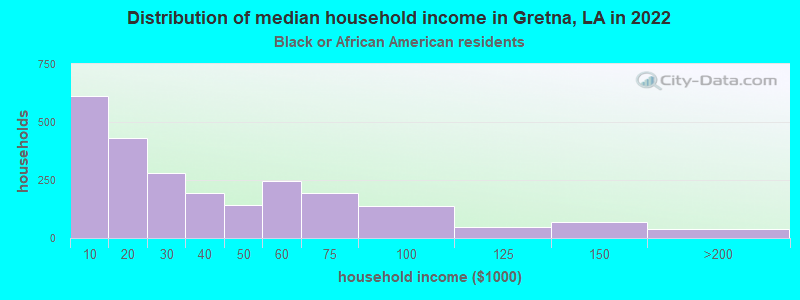
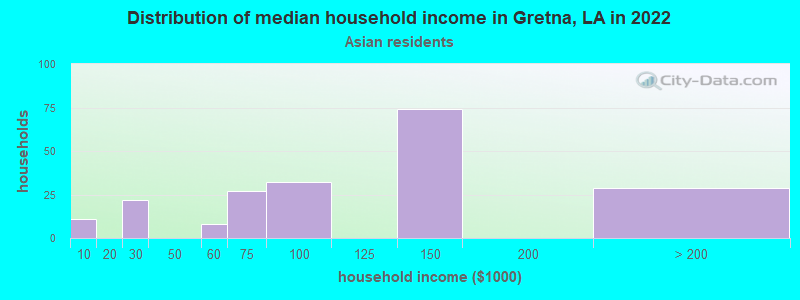
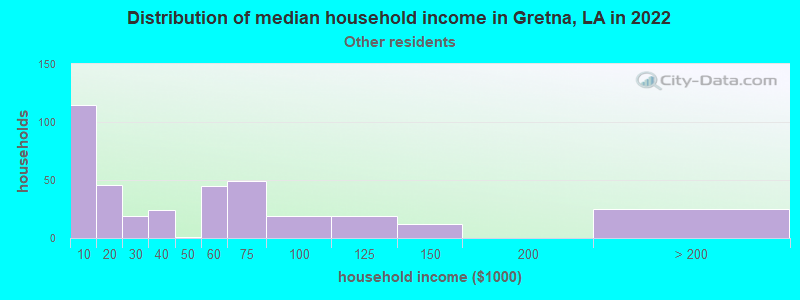
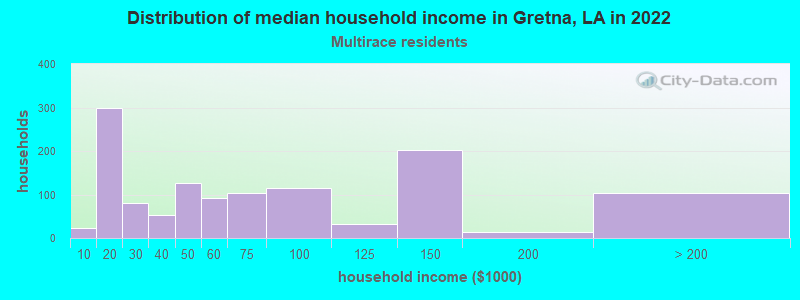
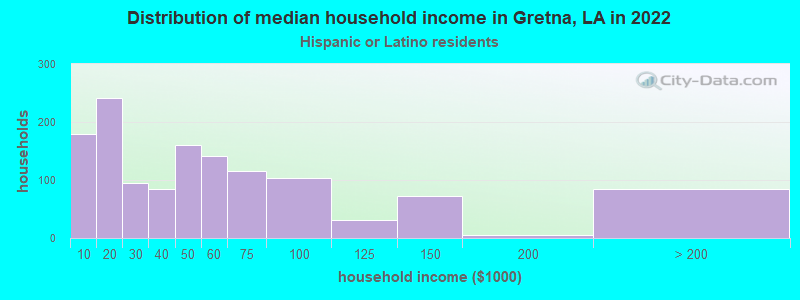
Income and house value in Gretna Median household income in 2022 $56,025 White non-Hispanic householders$25,082 Black householders$121,264 Asian householders$54,670 Two or more races householders$42,790 Hispanic or Latino race householdersMedian 2022 house value $271,383 White Non-Hispanic householders$217,661 Black or African American householders$329,264 American Indian or Alaska Native householders $311,935 Asian householders$233,258 Some other race householders$294,605 Two or more races householders$258,212 Hispanic or Latino householders
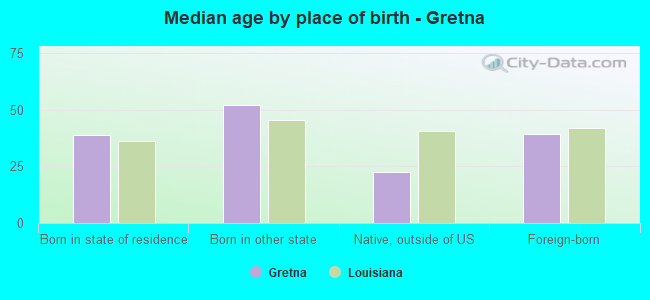
Median age by race in Gretna
44.6 Median age for White residents41.9 47.7 40.7 Median age for Black or African American residents40.3 40.1 25.9 Median age for American Indian / Alaska Native residents-679,966,749.1 -1,174,917,490.6 38.1 Median age for Asian residents34.1 37.4 -1,031,509,120.0 Median age for Native Hawaiian / Pacific Islander residents-868,167,201.7 -599,999,999.4 26.7 Median age for Other race residents24.7 28.1 37.7 Median age for Two or more races residents38.4 37.6 45.7 Median age for White alone residents43.2 49.4 31.6 Median age for Hispanic or Latino residents33.7 30.8
Owner/renter occupied households by race in Gretna
House owners and renters - White residents 2,564 70.8% Owner occupied1,056 29.2% Renter occupiedHouse owners and renters - Black or African American residents 592 25.9% Owner occupied1,695 74.1% Renter occupiedHouse owners and renters - American Indian / Alaska Native residents 30 100.0% Renter occupiedHouse owners and renters - Asian residents 199 95.4% Owner occupied10 4.6% Renter occupiedHouse owners and renters - Native Hawaiian / Pacific Islander residents 3 100.0% Renter occupiedHouse owners and renters - Other race residents 106 21.6% Owner occupied385 78.4% Renter occupiedHouse owners and renters - Two or more races residents 490 37.8% Owner occupied806 62.2% Renter occupiedHouse owners and renters - White alone residents 2,522 70.4% Owner occupied1,060 29.6% Renter occupiedHouse owners and renters - Hispanic or Latino residents 428 31.1% Owner occupied950 68.9% Renter occupied
Language usage in Gretna
English speakers - Total 77.2% of residents of Gretna speak English at home.
16.3% of residents speak Spanish at home 1,057 40.0% Speak English very well1,586 60.0% Speak English less than very well5.2% of residents speak other language at home 614 73.4% Speak English very well223 26.6% Speak English less than very well
English speakers - Born in the United States 87.8% of residents of Gretna speak English at home.
8.5% of residents speak Spanish at home 183 95.3% Speak English very well9 4.7% Speak English less than very well3.7% of residents speak other language at home 85 100.0% Speak English very well
English speakers - Native, born elsewhere 67.4% of residents of Gretna speak English at home.
13.4% of residents speak Spanish at home 29 67.4% Speak English very well14 32.6% Speak English less than very well4.0% of residents speak other language at home 13 100.0% Speak English less than very well
English speakers - Foreign-born 5.1% of residents of Gretna speak English at home.
74.3% of residents speak Spanish at home 386 19.9% Speak English very well1,556 80.1% Speak English less than very well17.0% of residents speak other language at home 274 61.6% Speak English very well171 38.4% Speak English less than very well
White (Caucasian) - Speak only English Native:
96.6% (6,439)Foreign-born:
5.6% (27)
White (Caucasian) - Speak another language Native:
3.6% (237)Foreign-born:
85.4% (409)
Black or African American - Speak only English Native:
98.2% (4,877)Foreign-born:
32.2% (13)
Black or African American - Speak another language Native:
1.1% (57)Foreign-born:
67.7% (28)
Asian - Speak only English Native:
30.9% (111)Foreign-born:
6.6% (16)
Asian - Speak another language Native:
64.4% (230)Foreign-born:
93.6% (235)
Other race - Speak only English Native:
62.7% (253)Foreign-born:
21.1% (185)
Other race - Speak another language Native:
39.6% (159)Foreign-born:
82.8% (726)
Two or more races - Speak only English Native:
58.3% (670)Foreign-born:
0.6% (11)
Two or more races - Speak another language Native:
44.9% (516)Foreign-born:
100.0% (1,713)
White alone - Speak only English Native:
97.6% (6,353)Foreign-born:
3.1% (5)
White alone - Speak another language Native:
2.5% (162)Foreign-born:
100.0% (146)
Hispanic or Latino - Speak only English Native:
48.4% (627)Foreign-born:
6.1% (131)
Hispanic or Latino - Speak another language Native:
48.3% (625)Foreign-born:
93.0% (1,996)
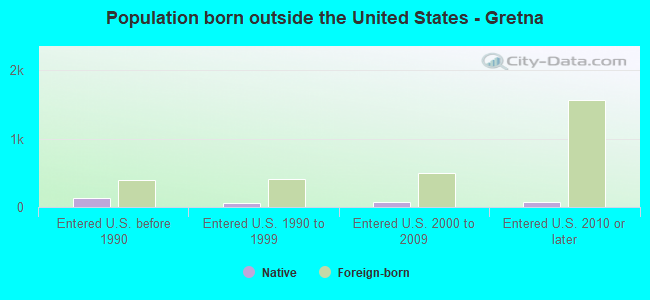
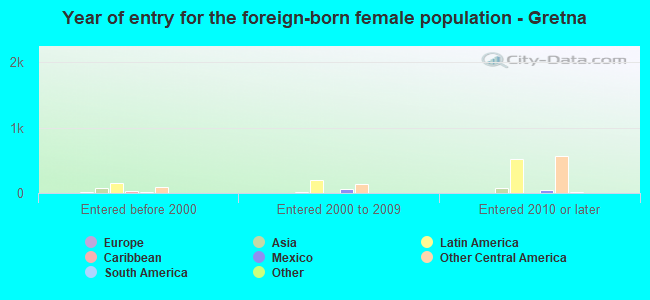
Foreign-born residents in Gretna 3,283 residents are foreign born (15.3% Latin America , 2.1% Asia ).
This city:
19.1%Louisiana:
4.2%
Marital status for residents in Gretna Marital status - White (Caucasian) population 15 years and over
Males 36.4% Never married47.2% Now married2.0% Separated2.5% Widowed11.9% DivorcedFemales 28.0% Never married37.5% Now married1.3% Separated14.0% Widowed19.2% DivorcedWomen who gave birth in the past 12 months Now married:
76.9% (61)Unmarried:
23.1% (18)
Women who did not give birth in the past 12 months Now married:
41.0% (600)Unmarried:
59.0% (863)
Marital status - Black or African American population 15 years and over
Males 66.2% Never married11.3% Now married1.8% Separated4.5% Widowed16.1% DivorcedFemales 55.2% Never married9.3% Now married2.5% Separated14.3% Widowed18.7% DivorcedWomen who gave birth in the past 12 months Now married:
8.5% (6)Unmarried:
91.5% (63)
Women who did not give birth in the past 12 months Now married:
4.8% (58)Unmarried:
95.2% (1,159)
Marital status - American Indian / Alaska Native population 15 years and over
Males 0.0% Never married100.0% Now married0.0% Separated0.0% Widowed0.0% DivorcedFemales 82.6% Never married0.0% Now married17.4% Separated0.0% Widowed0.0% DivorcedWomen who did not give birth in the past 12 months Now married:
17.4% (7)Unmarried:
82.6% (32)
Marital status - Asian population 15 years and over
Males 11.5% Never married81.0% Now married0.0% Separated0.0% Widowed7.5% DivorcedFemales 10.8% Never married66.5% Now married0.0% Separated11.3% Widowed11.3% DivorcedWomen who did not give birth in the past 12 months Now married:
73.2% (93)Unmarried:
26.8% (34)
Marital status - Other race population 15 years and over
Males 40.1% Never married40.3% Now married19.5% Separated0.0% Widowed0.2% DivorcedFemales 44.4% Never married35.3% Now married4.1% Separated12.4% Widowed3.9% DivorcedWomen who gave birth in the past 12 months Now married:
37.1% (32)Unmarried:
62.9% (54)
Women who did not give birth in the past 12 months Now married:
41.2% (124)Unmarried:
58.8% (177)
Marital status - Two or more races population 15 years and over
Males 40.7% Never married30.6% Now married5.7% Separated1.6% Widowed21.3% DivorcedFemales 56.5% Never married35.3% Now married0.2% Separated5.0% Widowed3.1% DivorcedWomen who gave birth in the past 12 months Now married:
0.0% (0)Unmarried:
100.0% (51)
Women who did not give birth in the past 12 months Now married:
31.4% (213)Unmarried:
68.6% (466)
Marital status - White alone, not Hispanic / Latino population 15 years and over
Males 36.3% Never married46.1% Now married2.2% Separated2.7% Widowed12.7% DivorcedFemales 27.3% Never married36.2% Now married1.4% Separated14.7% Widowed20.4% DivorcedWomen who gave birth in the past 12 months Now married:
69.6% (45)Unmarried:
30.4% (19)
Women who did not give birth in the past 12 months Now married:
39.1% (554)Unmarried:
60.9% (861)
Marital status - Hispanic or Latino population 15 years and over
Males 38.5% Never married38.9% Now married9.2% Separated0.0% Widowed13.3% DivorcedFemales 48.5% Never married41.1% Now married2.2% Separated5.5% Widowed2.7% DivorcedWomen who gave birth in the past 12 months Now married:
38.1% (47)Unmarried:
61.9% (77)
Women who did not give birth in the past 12 months Now married:
42.1% (301)Unmarried:
57.9% (413)
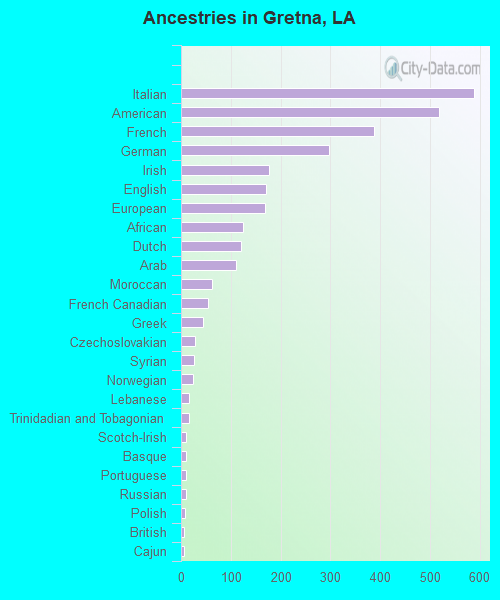
Ancestries in Gretna
589 5.4% Italian518 4.7% American387 3.5% French298 2.7% German176 1.6% Irish171 1.6% English169 1.5% European125 1.1% African121 1.1% Dutch111 1.0% Arab63 0.6% Moroccan55 0.5% French Canadian44 0.4% Greek28 0.3% Czechoslovakian27 0.2% Syrian25 0.2% Norwegian17 0.2% Lebanese17 0.2% Trinidadian and Tobagonian11 0.1% Scotch-Irish10 0.09% Basque10 0.09% Portuguese10 0.09% Russian8 0.07% Polish7 0.06% British6 0.05% Cajun6 0.05% Swiss4 0.04% Scottish4 0.04% West Indian2 0.02% Egyptian1 0.01% Austrian
Geographical mobility in Gretna Same house 1 year ago 6,263 86.1% White (Caucasian)4,508 87.9% Black or African American50 73.7% American Indian / Alaska Native549 92.8% Asian3 100.0% Native Hawaiian / Pacific Islander999 71.3% Other race2,431 79.1% Two or more races5,919 85.3% White alone, not Hispanic / Latino3,056 78.8% Hispanic or LatinoMoved within same county 375 5.2% White / Caucasian258 5.0% Black or African American15 22.2% American Indian / Alaska Native27 4.6% Asian66 4.7% Other race90 2.9% Two or more races392 5.6% White alone, not Hispanic / Latino134 3.4% Hispanic or LatinoMoved within same state 342 4.7% White / Caucasian237 4.6% Black or African American139 9.9% Other race3 0.1% Two or more races365 5.3% White alone, not Hispanic / Latino123 3.2% Hispanic or LatinoMoved from different state 114 1.6% White / Caucasian7 0.1% Black or African American12 0.4% Two or more races119 1.7% White alone, not Hispanic / Latino5 0.1% Hispanic or LatinoMoved from abroad 258 3.5% White260 18.5% Other race466 15.2% Two or more races328 4.7% White alone, not Hispanic / Latino1,120 28.9% Hispanic or Latino
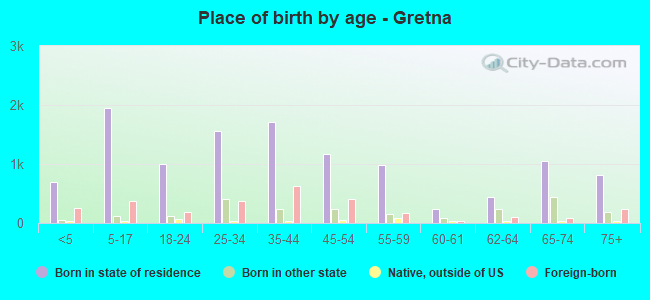
Children Nativity (place of birth) in Gretna
Children under 6 years - Living with two parents Both parents native 255 100.0% NativeBoth parents foreign-born 62 58.0% Native45 42.0% Foreign-bornOne native, one foreign-born parent 100 100.0% NativeChildren under 6 years - Living with one parent Native parent 332 100.0% NativeForeign-born parent 61 11.4% Native474 88.6% Foreign-bornChildren 6 to 17 years - Living with two parents Both parents native 516 99.7% Native1 0.3% Foreign-bornBoth parents foreign-born 263 81.2% Native61 18.8% Foreign-bornOne native, one foreign-born parent 105 100.0% NativeChildren 6 to 17 years - Living with one parent Native parent 553 96.3% Native21 3.7% Foreign-bornForeign-born parent 352 70.1% Native150 29.9% Foreign-born
Grandparents responsible for own grandchildren in Gretna
Grandparents (30 to 59 years) White / Caucasian 43 100.0% Not responsible for grandchildrenBlack or African American 12 100.0% Responsible for grandchildrenOther race 23 100.0% Not responsible for grandchildrenWhite alone, not Hispanic / Latino 35 100.0% Not responsible for grandchildrenHispanic or Latino 43 100.0% Not responsible for grandchildrenGrandparents (60 years and over) White / Caucasian 33 65.9% Responsible for grandchildren17 34.1% Not responsible for grandchildrenBlack or African American 30 65.6% Responsible for grandchildren16 34.4% Not responsible for grandchildrenWhite alone, not Hispanic / Latino 34 64.3% Responsible for grandchildren19 35.7% Not responsible for grandchildren