Races in Greybull, Wyoming (WY) Detailed Stats
Data:
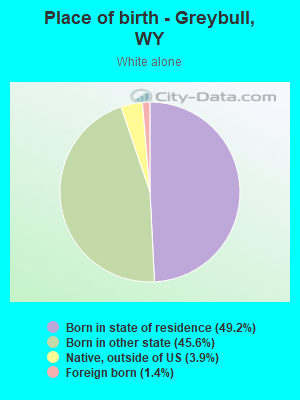
Races - White alone (%)
Races - White alone (% change since 2000)
Races - Black alone (%)
Races - Black alone (% change since 2000)
Races - American Indian alone (%)
Races - American Indian alone (% change since 2000)
Races - Asian alone (%)
Races - Asian alone (% change since 2000)
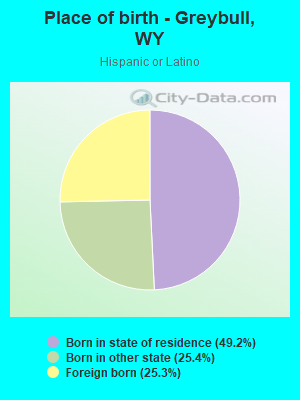
Races - Hispanic (%)
Races - Hispanic (% change since 2000)
Races - Native Hawaiian and Other Pacific Islander alone (%)
Races - Native Hawaiian and Other Pacific Islander alone (% change since 2000)
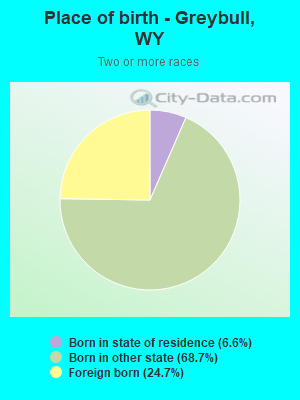
Races - Two or more races(%)
Races - Two or more races(% change since 2000)
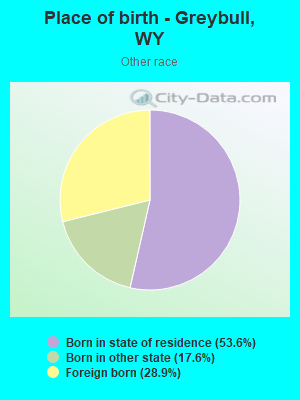
Races - Other race alone (%)
Races - Other race alone (% change since 2000)
Racial diversity
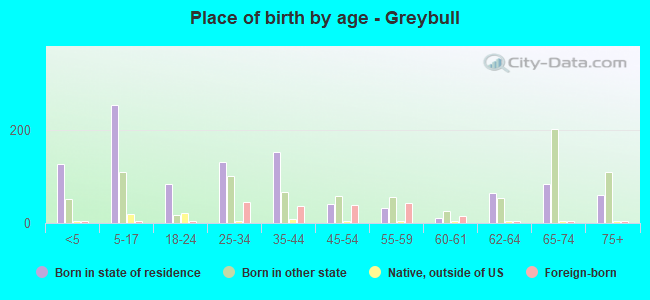
Place of birth - Born in state of residence (%)
Place of birth - Born in state of residence (%) - White
Place of birth - Born in state of residence (%) - Black or African American
Place of birth - Born in state of residence (%) - Asian
Place of birth - Born in state of residence (%) - Hispanic or Latino
Place of birth - Born in state of residence (%) - American Indian and Alaska Native
Place of birth - Born in state of residence (%) - Multirace
Place of birth - Born in state of residence (%) - Other Race
Place of birth - Born in other state (%)
Place of birth - Born in other state (%) - White
Place of birth - Born in other state (%) - Black or African American
Place of birth - Born in other state (%) - Asian
Place of birth - Born in other state (%) - Hispanic or Latino
Place of birth - Born in other state (%) - American Indian and Alaska Native
Place of birth - Born in other state (%) - Multirace
Place of birth - Born in other state (%) - Other Race
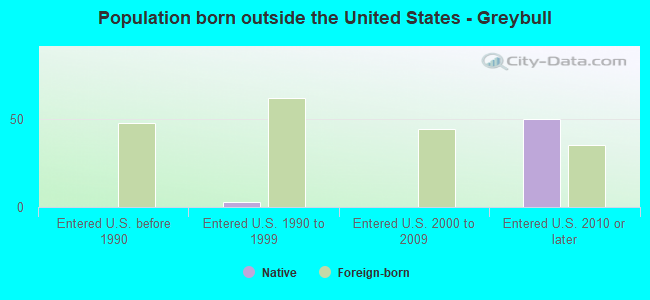
Place of birth - Native, outside of US (%)
Place of birth - Native, outside of US (%) - White
Place of birth - Native, outside of US (%) - Black or African American
Place of birth - Native, outside of US (%) - Asian
Place of birth - Native, outside of US (%) - Hispanic or Latino
Place of birth - Native, outside of US (%) - American Indian and Alaska Native
Place of birth - Native, outside of US (%) - Multirace
Place of birth - Native, outside of US (%) - Other Race
Place of birth - Foreign born (%)
Place of birth - Foreign born (%) - White
Place of birth - Foreign born (%) - Black or African American
Place of birth - Foreign born (%) - Asian
Place of birth - Foreign born (%) - Hispanic or Latino
Place of birth - Foreign born (%) - American Indian and Alaska Native
Place of birth - Foreign born (%) - Multirace
Place of birth - Foreign born (%) - Other Race
Residents speaking English at home (%)
Residents speaking English at home - Born in the United States (%)
Residents speaking English at home - Native, born elsewhere (%)
Residents speaking English at home - Foreign born (%)
Residents speaking Spanish at home (%)
Residents speaking Spanish at home - Born in the United States (%)
Residents speaking Spanish at home - Native, born elsewhere (%)
Residents speaking Spanish at home - Foreign born (%)
Residents speaking other language at home (%)
Residents speaking other language at home - Born in the United States (%)
Residents speaking other language at home - Native, born elsewhere (%)
Residents speaking other language at home - Foreign born (%)
Marital status - Never married (%)
Marital status - Now married (%)
Marital status - Separated (%)
Marital status - Widowed (%)
Marital status - Divorced (%)
Ancestries Reported - Arab (%)
Ancestries Reported - Czech (%)
Ancestries Reported - Danish (%)
Ancestries Reported - Dutch (%)
Ancestries Reported - English (%)
Ancestries Reported - French (%)
Ancestries Reported - French Canadian (%)
Ancestries Reported - German (%)
Ancestries Reported - Greek (%)
Ancestries Reported - Hungarian (%)
Ancestries Reported - Irish (%)
Ancestries Reported - Italian (%)
Ancestries Reported - Lithuanian (%)
Ancestries Reported - Norwegian (%)
Ancestries Reported - Polish (%)
Ancestries Reported - Portuguese (%)
Ancestries Reported - Russian (%)
Ancestries Reported - Scotch-Irish (%)
Ancestries Reported - Scottish (%)
Ancestries Reported - Slovak (%)
Ancestries Reported - Subsaharan African (%)
Ancestries Reported - Swedish (%)
Ancestries Reported - Swiss (%)
Ancestries Reported - Ukrainian (%)
Ancestries Reported - United States (%)
Ancestries Reported - Welsh (%)
Ancestries Reported - West Indian (%)
Ancestries Reported - Other (%)
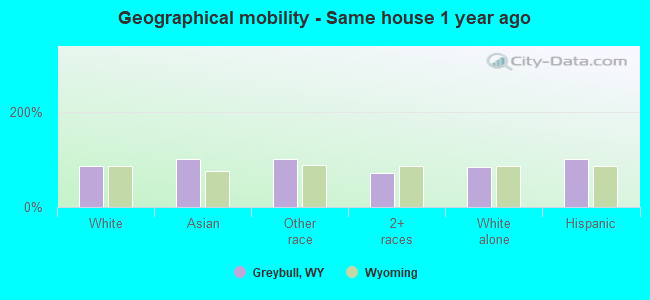
Geographical mobility - Same house 1 year ago (%)
Geographical mobility - Same house 1 year ago (%) - White
Geographical mobility - Same house 1 year ago (%) - Black or African American
Geographical mobility - Same house 1 year ago (%) - Asian
Geographical mobility - Same house 1 year ago (%) - Hispanic or Latino
Geographical mobility - Same house 1 year ago (%) - American Indian and Alaska Native
Geographical mobility - Same house 1 year ago (%) - Multirace
Geographical mobility - Same house 1 year ago (%) - Other Race
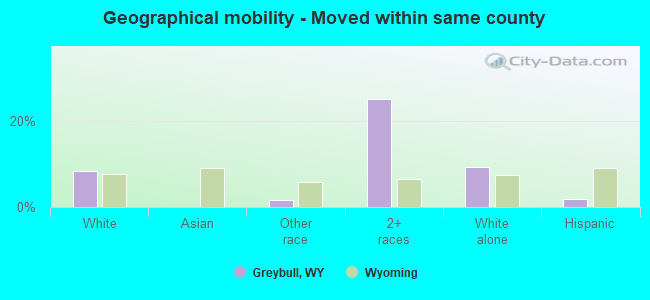
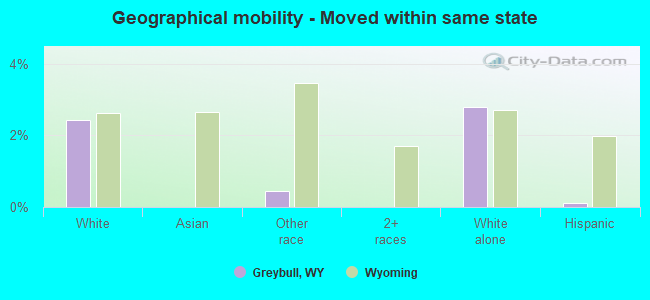
Geographical mobility - Moved within same county (%)
Geographical mobility - Moved within same county (%) - White
Geographical mobility - Moved within same county (%) - Black or African American
Geographical mobility - Moved within same county (%) - Asian
Geographical mobility - Moved within same county (%) - Hispanic or Latino
Geographical mobility - Moved within same county (%) - American Indian and Alaska Native
Geographical mobility - Moved within same county (%) - Multirace
Geographical mobility - Moved within same county (%) - Other Race
Geographical mobility - Moved from different county within same state (%)
Geographical mobility - Moved from different county within same state (%) - White
Geographical mobility - Moved from different county within same state (%) - Black or African American
Geographical mobility - Moved from different county within same state (%) - Asian
Geographical mobility - Moved from different county within same state (%) - Hispanic or Latino
Geographical mobility - Moved from different county within same state (%) - American Indian and Alaska Native
Geographical mobility - Moved from different county within same state (%) - Multirace
Geographical mobility - Moved from different county within same state (%) - Other Race
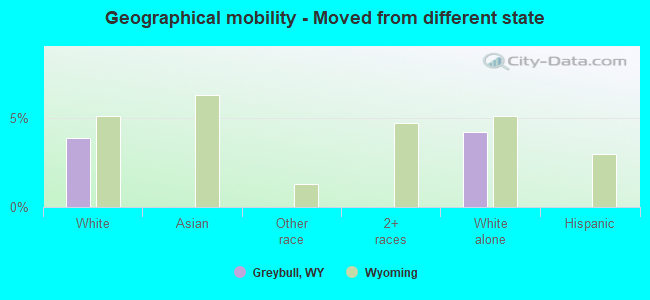
Geographical mobility - Moved from different state (%)
Geographical mobility - Moved from different state (%) - White
Geographical mobility - Moved from different state (%) - Black or African American
Geographical mobility - Moved from different state (%) - Asian
Geographical mobility - Moved from different state (%) - Hispanic or Latino
Geographical mobility - Moved from different state (%) - American Indian and Alaska Native
Geographical mobility - Moved from different state (%) - Multirace
Geographical mobility - Moved from different state (%) - Other Race
Geographical mobility - Moved from abroad (%)
Geographical mobility - Moved from abroad (%) - White
Geographical mobility - Moved from abroad (%) - Black or African American
Geographical mobility - Moved from abroad (%) - Asian
Geographical mobility - Moved from abroad (%) - Hispanic or Latino
Geographical mobility - Moved from abroad (%) - American Indian and Alaska Native
Geographical mobility - Moved from abroad (%) - Multirace
Geographical mobility - Moved from abroad (%) - Other Race
Place of birth for the foreign-born population - Ireland (%)
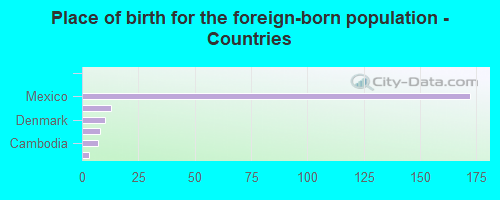
Place of birth for the foreign-born population - Denmark (%)
Place of birth for the foreign-born population - Norway (%)
Place of birth for the foreign-born population - Sweden (%)
Place of birth for the foreign-born population - United Kingdom (%)
Place of birth for the foreign-born population - England (%)
Place of birth for the foreign-born population - Scotland (%)
Place of birth for the foreign-born population - Other Northern Europe (%)
Place of birth for the foreign-born population - Austria (%)
Place of birth for the foreign-born population - Belgium (%)
Place of birth for the foreign-born population - France (%)
Place of birth for the foreign-born population - Germany (%)
Place of birth for the foreign-born population - Netherlands (%)
Place of birth for the foreign-born population - Switzerland (%)
Place of birth for the foreign-born population - Other Western Europe (%)
Place of birth for the foreign-born population - Greece (%)
Place of birth for the foreign-born population - Italy (%)
Place of birth for the foreign-born population - Portugal (%)
Place of birth for the foreign-born population - Spain (%)
Place of birth for the foreign-born population - Other Southern Europe (%)
Place of birth for the foreign-born population - Albania (%)
Place of birth for the foreign-born population - Belarus (%)
Place of birth for the foreign-born population - Bosnia and Herzegovina (%)
Place of birth for the foreign-born population - Bulgaria (%)
Place of birth for the foreign-born population - Croatia (%)
Place of birth for the foreign-born population - Czechoslovakia (%)
Place of birth for the foreign-born population - Hungary (%)
Place of birth for the foreign-born population - Latvia (%)
Place of birth for the foreign-born population - Lithuania (%)
Place of birth for the foreign-born population - North Macedonia (Macedonia) (%)
Place of birth for the foreign-born population - Moldova (%)
Place of birth for the foreign-born population - Poland (%)
Place of birth for the foreign-born population - Romania (%)
Place of birth for the foreign-born population - Russia (%)
Place of birth for the foreign-born population - Serbia (%)
Place of birth for the foreign-born population - Ukraine (%)
Place of birth for the foreign-born population - Other Eastern Europe (%)
Place of birth for the foreign-born population - China (%)
Place of birth for the foreign-born population - Hong Kong (%)
Place of birth for the foreign-born population - Taiwan (%)
Place of birth for the foreign-born population - Japan (%)
Place of birth for the foreign-born population - Korea (%)
Place of birth for the foreign-born population - Other Eastern Asia (%)
Place of birth for the foreign-born population - Afghanistan (%)
Place of birth for the foreign-born population - Bangladesh (%)
Place of birth for the foreign-born population - India (%)
Place of birth for the foreign-born population - Iran (%)
Place of birth for the foreign-born population - Kazakhstan (%)
Place of birth for the foreign-born population - Nepal (%)
Place of birth for the foreign-born population - Pakistan (%)
Place of birth for the foreign-born population - Sri Lanka (%)
Place of birth for the foreign-born population - Uzbekistan (%)
Place of birth for the foreign-born population - Other South Central Asia (%)
Place of birth for the foreign-born population - Burma (%)
Place of birth for the foreign-born population - Cambodia (%)
Place of birth for the foreign-born population - Indonesia (%)
Place of birth for the foreign-born population - Laos (%)
Place of birth for the foreign-born population - Malaysia (%)
Place of birth for the foreign-born population - Philippines (%)
Place of birth for the foreign-born population - Singapore (%)
Place of birth for the foreign-born population - Thailand (%)
Place of birth for the foreign-born population - Vietnam (%)
Place of birth for the foreign-born population - Other South Eastern Asia (%)
Place of birth for the foreign-born population - Armenia (%)
Place of birth for the foreign-born population - Iraq (%)
Place of birth for the foreign-born population - Israel (%)
Place of birth for the foreign-born population - Jordan (%)
Place of birth for the foreign-born population - Kuwait (%)
Place of birth for the foreign-born population - Lebanon (%)
Place of birth for the foreign-born population - Saudi Arabia (%)
Place of birth for the foreign-born population - Syria (%)
Place of birth for the foreign-born population - Turkey (%)
Place of birth for the foreign-born population - Yemen (%)
Place of birth for the foreign-born population - Other Western Asia (%)
Place of birth for the foreign-born population - Eritrea (%)
Place of birth for the foreign-born population - Ethiopia (%)
Place of birth for the foreign-born population - Kenya (%)
Place of birth for the foreign-born population - Somalia (%)
Place of birth for the foreign-born population - Uganda (%)
Place of birth for the foreign-born population - Zimbabwe (%)
Place of birth for the foreign-born population - Other Eastern Africa (%)
Place of birth for the foreign-born population - Cameroon (%)
Place of birth for the foreign-born population - Congo (%)
Place of birth for the foreign-born population - Democratic Republic of Congo (Zaire) (%)
Place of birth for the foreign-born population - Other Middle Africa (%)
Place of birth for the foreign-born population - Egypt (%)
Place of birth for the foreign-born population - Morocco (%)
Place of birth for the foreign-born population - Sudan (%)
Place of birth for the foreign-born population - Other Northern Africa (%)
Place of birth for the foreign-born population - South Africa (%)
Place of birth for the foreign-born population - Other Southern Africa (%)
Place of birth for the foreign-born population - Cabo Verde (%)
Place of birth for the foreign-born population - Ghana (%)
Place of birth for the foreign-born population - Liberia (%)
Place of birth for the foreign-born population - Nigeria (%)
Place of birth for the foreign-born population - Senegal (%)
Place of birth for the foreign-born population - Sierra Leone (%)
Place of birth for the foreign-born population - Other Western Africa (%)
Place of birth for the foreign-born population - Australia (%)
Place of birth for the foreign-born population - New Zealand (%)
Place of birth for the foreign-born population - Fiji (%)
Place of birth for the foreign-born population - Micronesia (%)
Place of birth for the foreign-born population - Bahamas (%)
Place of birth for the foreign-born population - Barbados (%)
Place of birth for the foreign-born population - Cuba (%)
Place of birth for the foreign-born population - Dominica (%)
Place of birth for the foreign-born population - Dominican Republic (%)
Place of birth for the foreign-born population - Grenada (%)
Place of birth for the foreign-born population - Haiti (%)
Place of birth for the foreign-born population - Jamaica (%)
Place of birth for the foreign-born population - St. Vincent and the Grenadines (%)
Place of birth for the foreign-born population - Trinidad and Tobago (%)
Place of birth for the foreign-born population - West Indies (%)
Place of birth for the foreign-born population - Other Caribbean (%)
Place of birth for the foreign-born population - Belize (%)
Place of birth for the foreign-born population - Costa Rica (%)
Place of birth for the foreign-born population - El Salvador (%)
Place of birth for the foreign-born population - Guatemala (%)
Place of birth for the foreign-born population - Honduras (%)
Place of birth for the foreign-born population - Mexico (%)
Place of birth for the foreign-born population - Nicaragua (%)
Place of birth for the foreign-born population - Panama (%)
Place of birth for the foreign-born population - Other Central America (%)
Place of birth for the foreign-born population - Argentina (%)
Place of birth for the foreign-born population - Bolivia (%)
Place of birth for the foreign-born population - Brazil (%)
Place of birth for the foreign-born population - Chile (%)
Place of birth for the foreign-born population - Colombia (%)
Place of birth for the foreign-born population - Ecuador (%)
Place of birth for the foreign-born population - Guyana (%)
Place of birth for the foreign-born population - Peru (%)
Place of birth for the foreign-born population - Uruguay (%)
Place of birth for the foreign-born population - Venezuela (%)
Place of birth for the foreign-born population - Other South America (%)
Place of birth for the foreign-born population - Canada (%)
Place of birth for the foreign-born population - Other Northern America (%)
Place of birth for the foreign-born population - Other (%)
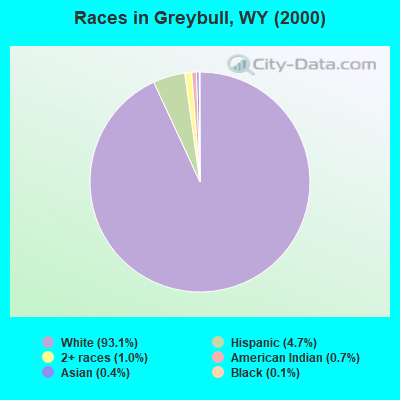
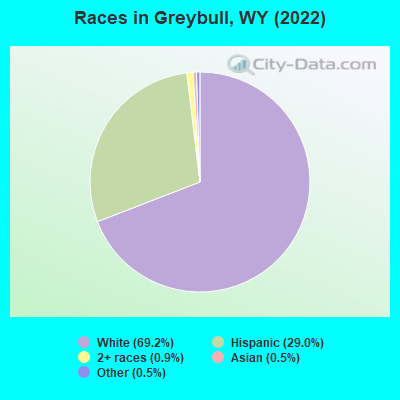
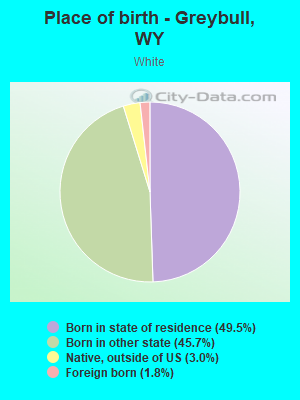
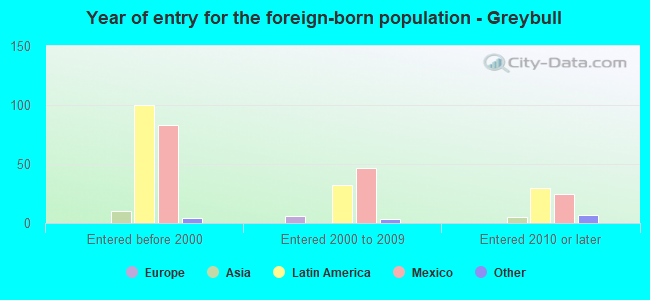
According to 2022 data, the most numerous races in Greybull, WY are White alone (1,492 residents), Hispanic (626 residents), and Two or more races (20 residents). 76.9% of Greybull residents speak English at home. 9.9% of Greybull, WY residents are foreign-born (7.9% born in Latin America), which is 69.7% greater than the foreign-born rate of 3.0% across the entire state of Wyoming.
Race distribution in Greybull
2000 2022
438,799 88.9% White alone 31,669 6.4% Hispanic 10,238 2.1% American Indian alone 6,164 1.2% Two or more races 3,504 0.7% Black alone 2,670 0.5% Asian alone 474 0.10% Other race alone 264 0.05% Native Hawaiian and Other
473,220 81.4% White alone 62,803 10.8% Hispanic 22,911 3.9% Two or more races 9,589 1.6% American Indian alone 4,997 0.9% Other race alone 3,990 0.7% Black alone 3,577 0.6% Asian alone 294 0.05% Native Hawaiian and Other
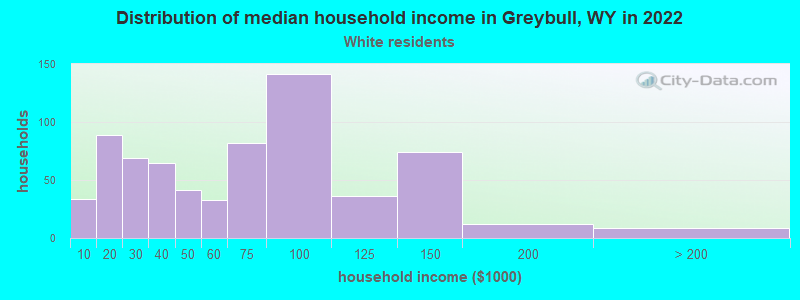
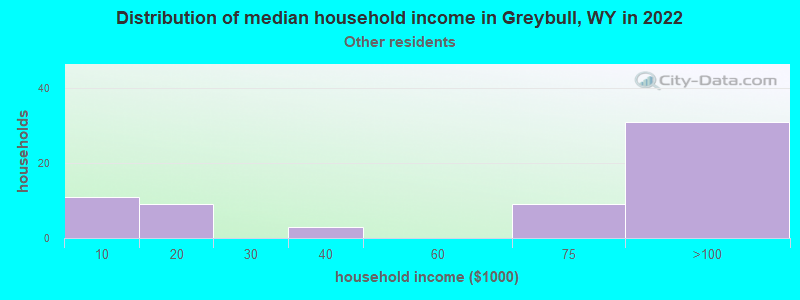
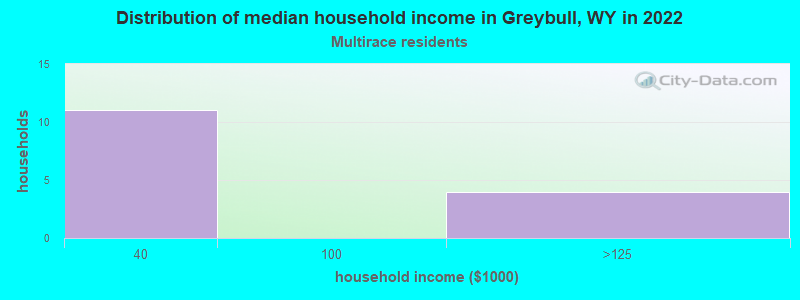
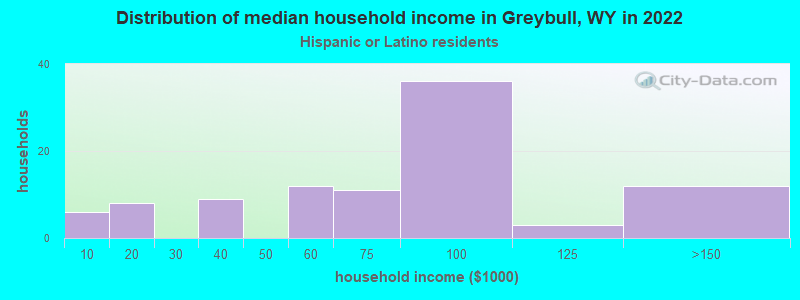
Income and house value in Greybull Median household income in 2022 $59,556 White non-Hispanic householders$67,483 Some other race householders$80,489 Hispanic or Latino race householdersMedian 2022 house value $180,920 White Non-Hispanic householders$164,473 American Indian or Alaska Native householders$191,885 Two or more races householders$178,179 Hispanic or Latino householders
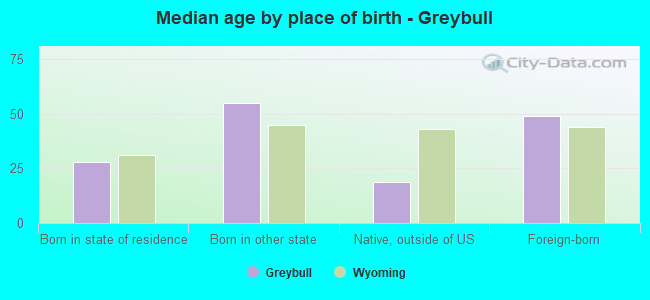
Median age by race in Greybull
42.9 Median age for White residents44.6 41.9 -662,146,892.0 Median age for Black or African American residents-558,558,558.0 -746,302,615.9 -703,703,703.0 Median age for American Indian / Alaska Native residents-826,666,665.8 -642,934,195.7 -802,845,527.7 Median age for Asian residents-684,684,684.0 -929,503,915.5 -594,708,994.1 Median age for Native Hawaiian / Pacific Islander residents-652,729,383.8 -865,828,091.4 20.6 Median age for Other race residents20.1 18.4 41.3 Median age for Two or more races residents40.5 70.2 46.0 Median age for White alone residents45.7 46.7 19.9 Median age for Hispanic or Latino residents18.6 20.0
Owner/renter occupied households by race in Greybull
House owners and renters - White residents 499 74.5% Owner occupied171 25.5% Renter occupiedHouse owners and renters - Asian residents 5 100.0% Owner occupiedHouse owners and renters - Other race residents 44 67.1% Owner occupied22 32.9% Renter occupiedHouse owners and renters - Two or more races residents 4 15.6% Owner occupied21 84.4% Renter occupiedHouse owners and renters - White alone residents 488 75.4% Owner occupied159 24.6% Renter occupiedHouse owners and renters - Hispanic or Latino residents 54 53.7% Owner occupied47 46.3% Renter occupied
Language usage in Greybull
English speakers - Total 76.9% of residents of Greybull speak English at home.
22.4% of residents speak Spanish at home 261 59.0% Speak English very well181 41.0% Speak English less than very well1.1% of residents speak other language at home 10 47.6% Speak English very well11 52.4% Speak English less than very well
English speakers - Born in the United States 85.5% of residents of Greybull speak English at home.
14.5% of residents speak Spanish at home 109 94.0% Speak English very well7 6.0% Speak English less than very well
All residents speak only English at home
English speakers - Foreign-born 9.5% of residents of Greybull speak English at home.
87.3% of residents speak Spanish at home 30 18.2% Speak English very well135 81.8% Speak English less than very well10.6% of residents speak other language at home 7 35.0% Speak English very well13 65.0% Speak English less than very well
White (Caucasian) - Speak only English Native:
97.6% (1,429)Foreign-born:
52.5% (15)
White (Caucasian) - Speak another language Native:
2.1% (31)Foreign-born:
48.5% (14)
Other race - Speak another language Native:
81.7% (248)Foreign-born:
100.0% (158)
Two or more races - Speak another language Native:
47.3% (23)Foreign-born:
100.0% (15)
White alone - Speak only English Native:
99.7% (1,385)Foreign-born:
60.4% (12)
White alone - Speak another language Native:
0.6% (8)Foreign-born:
39.5% (8)
Hispanic or Latino - Speak only English Native:
20.7% (73)Foreign-born:
4.2% (7)
Hispanic or Latino - Speak another language Native:
79.8% (282)Foreign-born:
100.0% (157)
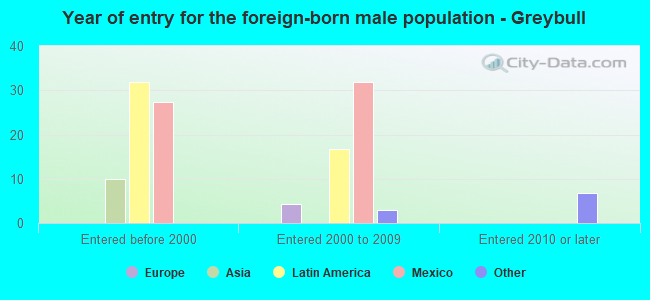
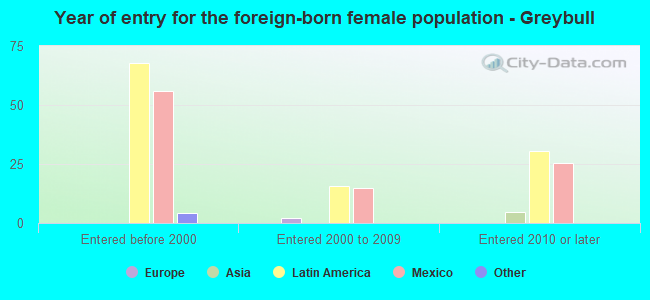
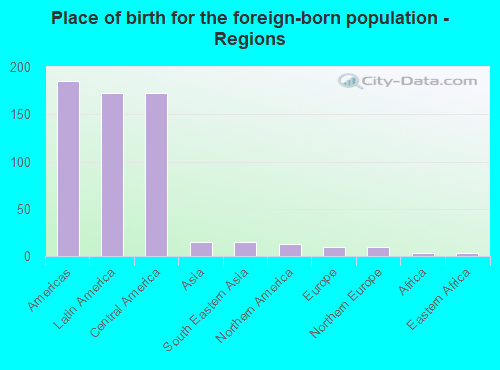
Foreign-born residents in Greybull 214 residents are foreign born (7.9% Latin America ).
This city:
9.9%Wyoming:
3.4%
Marital status for residents in Greybull Marital status - White (Caucasian) population 15 years and over
Males 23.2% Never married60.0% Now married1.9% Separated3.8% Widowed11.1% DivorcedFemales 21.2% Never married51.5% Now married1.9% Separated9.6% Widowed15.8% DivorcedWomen who gave birth in the past 12 months Now married:
100.0% (35)Unmarried:
0.0% (0)
Women who did not give birth in the past 12 months Now married:
49.6% (128)Unmarried:
50.4% (130)
Marital status - Asian population 15 years and over
Males 0.0% Never married100.0% Now married0.0% Separated0.0% Widowed0.0% DivorcedFemales 0.0% Never married100.0% Now married0.0% Separated0.0% Widowed0.0% DivorcedWomen who did not give birth in the past 12 months Now married:
100.0% (8)Unmarried:
0.0% (0)
Marital status - Other race population 15 years and over
Males 79.5% Never married20.5% Now married0.0% Separated0.0% Widowed0.0% DivorcedFemales 49.3% Never married26.5% Now married0.0% Separated5.1% Widowed19.1% DivorcedWomen who did not give birth in the past 12 months Now married:
25.3% (30)Unmarried:
74.7% (88)
Marital status - Two or more races population 15 years and over
Males 91.3% Never married8.7% Now married0.0% Separated0.0% Widowed0.0% DivorcedFemales 0.0% Never married58.8% Now married0.0% Separated0.0% Widowed41.2% DivorcedWomen who did not give birth in the past 12 months Now married:
0.0% (0)Unmarried:
100.0% (10)
Marital status - White alone, not Hispanic / Latino population 15 years and over
Males 23.6% Never married58.9% Now married2.0% Separated3.9% Widowed11.6% DivorcedFemales 21.4% Never married50.2% Now married2.0% Separated10.0% Widowed16.4% DivorcedWomen who gave birth in the past 12 months Now married:
100.0% (32)Unmarried:
0.0% (0)
Women who did not give birth in the past 12 months Now married:
47.4% (116)Unmarried:
52.6% (129)
Marital status - Hispanic or Latino population 15 years and over
Males 71.6% Never married28.4% Now married0.0% Separated0.0% Widowed0.0% DivorcedFemales 43.0% Never married37.0% Now married0.0% Separated4.2% Widowed15.8% DivorcedWomen who gave birth in the past 12 months Now married:
100.0% (4)Unmarried:
0.0% (0)
Women who did not give birth in the past 12 months Now married:
32.8% (38)Unmarried:
67.2% (78)
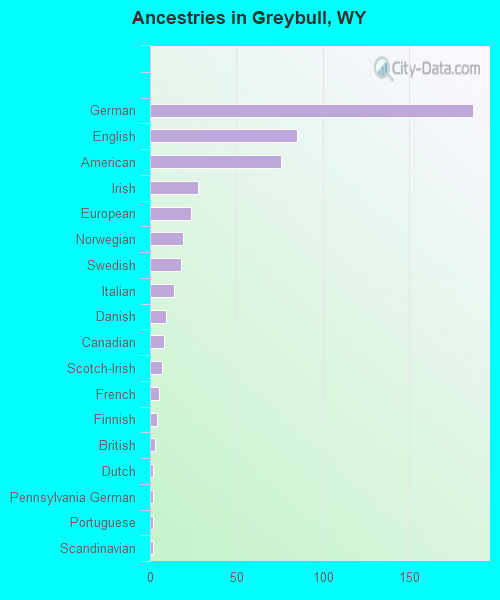
Ancestries in Greybull
187 19.1% German85 8.7% English76 7.7% American28 2.9% Irish24 2.4% European19 1.9% Norwegian18 1.8% Swedish14 1.4% Italian9 0.9% Danish8 0.8% Canadian7 0.7% Scotch-Irish5 0.5% French4 0.4% Finnish3 0.3% British2 0.2% Dutch2 0.2% Pennsylvania German2 0.2% Portuguese2 0.2% Scandinavian
Children Nativity (place of birth) in Greybull
Children under 6 years - Living with two parents Both parents native 127 100.0% NativeBoth parents foreign-born 22 100.0% NativeChildren under 6 years - Living with one parent Native parent 39 100.0% NativeForeign-born parent 9 100.0% NativeChildren 6 to 17 years - Living with two parents Both parents native 150 100.0% NativeBoth parents foreign-born 71 100.0% NativeOne native, one foreign-born parent 38 92.4% Native3 7.6% Foreign-bornChildren 6 to 17 years - Living with one parent Native parent 69 100.0% NativeForeign-born parent 53 47.6% Native58 52.4% Foreign-born
Grandparents responsible for own grandchildren in Greybull
Grandparents (30 to 59 years) Other race 29 100.0% Not responsible for grandchildrenHispanic or Latino 24 100.0% Not responsible for grandchildren
Grandparents (60 years and over) Other race 15 100.0% Responsible for grandchildrenHispanic or Latino 14 100.0% Responsible for grandchildren