Races in Grosse Ile, Michigan (MI) Detailed Stats
Ancestries, Foreign-born residents, place of birth

Recent posts about races in Grosse Ile, Michigan on our local forum with over 2,400,000 registered users:
 | Where to live near Troy, Michigan :) (19 replies) |
| What's your favorite Metro Detroit area restaurant (ethnic or not)? (41 replies) |
| Please recommend a Detroit area to a mid 30s native couple who have been spoiled by the west coast! (35 replies) |
| Dream House (26 replies) |
| Mid 40s, no kids, returning to area. (6 replies) |
| Moving to Michigan from CT (6 replies) |
6.5% of Grosse Ile, MI residents are foreign-born (3.0% born in Europe, 2.0% born in Asia, 0.8% born in North America), which is 8.3% greater than the foreign-born rate of 6.0% across the entire state of Michigan.
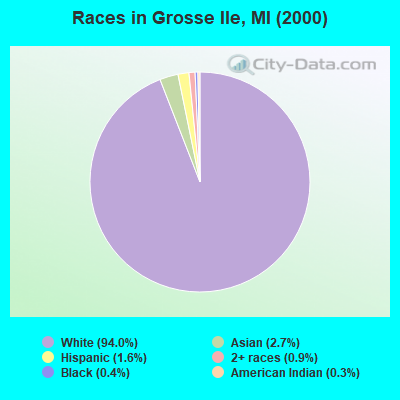
Race distribution in Grosse Ile

- 10,24194.0%White alone
- 2942.7%Asian alone
- 1751.6%Hispanic
- 990.9%Two or more races
- 390.4%Black alone
- 350.3%American Indian alone
- 70.06%Other race alone
- 40.04%Native Hawaiian and Other
Pacific Islander alone
2000
2022
-
- 7,806,69178.6%White alone
- 1,402,04714.1%Black alone
- 323,8773.3%Hispanic
- 175,3111.8%Asian alone
- 163,4871.6%Two or more races
- 53,4210.5%American Indian alone
- 11,4650.1%Other race alone
- 2,1450.02%Native Hawaiian and Other
Pacific Islander alone

-
- 7,289,05172.6%White alone
- 1,310,46413.1%Black alone
- 572,4055.7%Hispanic
- 450,0314.5%Two or more races
- 335,7323.3%Asian alone
- 45,2170.5%Other race alone
- 29,0110.3%American Indian alone
- 2,2070.02%Native Hawaiian and Other
Pacific Islander alone

Income and house value in Grosse Ile
- Median household income in 2022
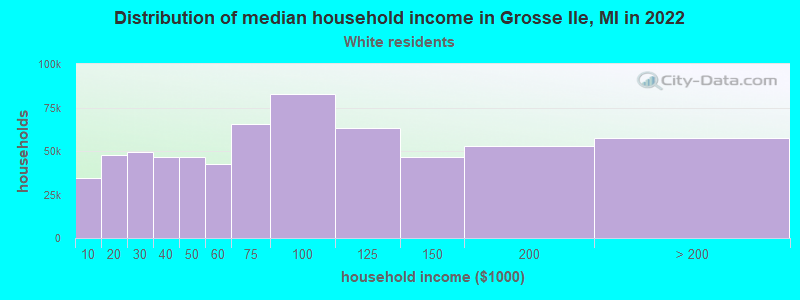
- $125,963White non-Hispanic householders
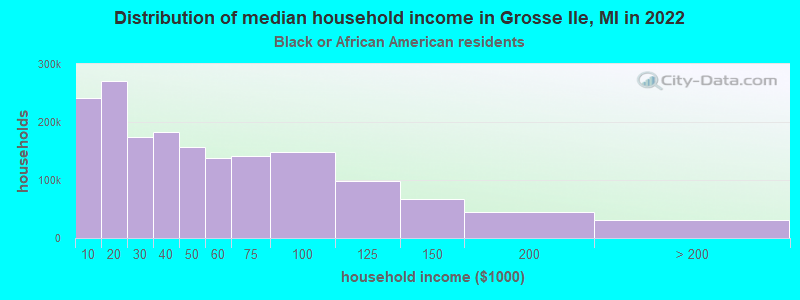
- over $200,000Black householders
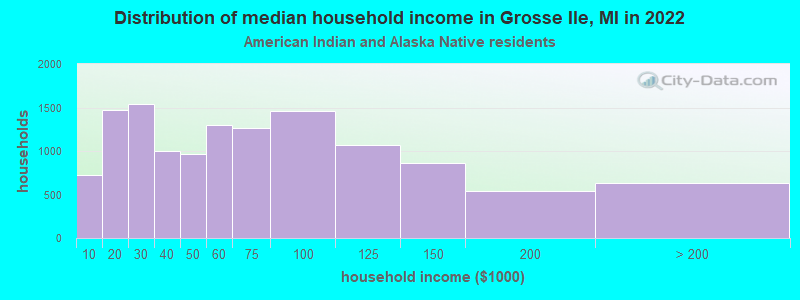
- $63,534American Indian and Alaska Native householders
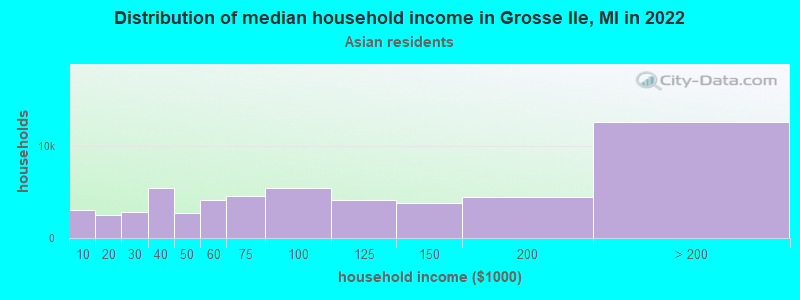
- over $200,000Asian householders
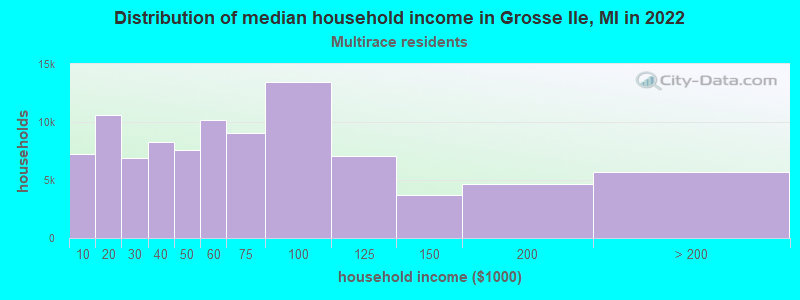
- $143,261Two or more races householders
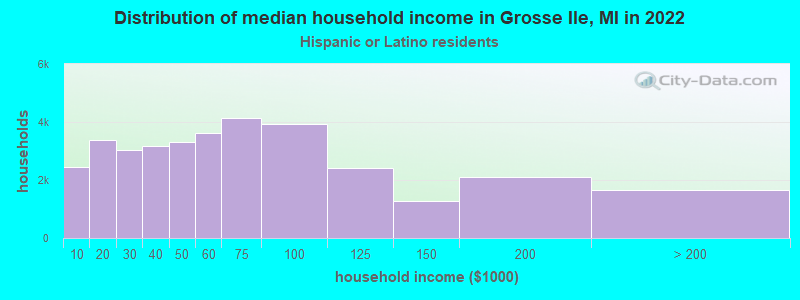
- $54,295Hispanic or Latino race householders
- Median 2022 house value
- $447,276White Non-Hispanic householders
- $202,897American Indian or Alaska Native householders
- $535,649Asian householders
- $158,350Two or more races householders
- $561,079Hispanic or Latino householders
Household income for White non-Hispanic householders
Household income for Black householders
Household income for American Indian and Alaska Native householders
Household income for Asian householders
Household income for Two or more races householders
Household income for Hispanic or Latino race householders
Foreign-born residents in Grosse Ile
713 residents are foreign born (3.0% Europe, 2.0% Asia, 0.8% North America).
| This city: | 6.5% |
| Michigan: | 5.3% |
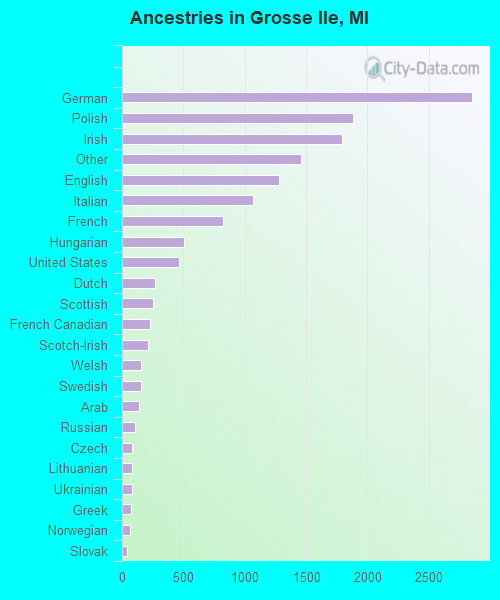
Ancestries in Grosse Ile

- 2,84920.2%German
- 1,88313.3%Polish
- 1,79412.7%Irish
- 1,46010.4%Other
- 1,2829.1%English
- 1,0687.6%Italian
- 8265.9%French
- 5083.6%Hungarian
- 4653.3%United States
- 2711.9%Dutch
- 2491.8%Scottish
- 2291.6%French Canadian
- 2141.5%Scotch-Irish
- 1561.1%Welsh
- 1531.1%Swedish
- 1381.0%Arab
- 1070.8%Russian
- 820.6%Czech
- 820.6%Lithuanian
- 780.6%Ukrainian
- 740.5%Greek
- 640.5%Norwegian
- 370.3%Slovak
- 200.1%Swiss
- 170.1%Danish
Zip codes: 48138.