Races in Grosse Pointe Farms, Michigan (MI) Detailed Stats
Data:
Races - White alone (%)
Races - White alone (% change since 2000)
Races - Black alone (%)
Races - Black alone (% change since 2000)
Races - American Indian alone (%)
Races - American Indian alone (% change since 2000)
Races - Asian alone (%)
Races - Asian alone (% change since 2000)
Races - Hispanic (%)
Races - Hispanic (% change since 2000)
Races - Native Hawaiian and Other Pacific Islander alone (%)
Races - Native Hawaiian and Other Pacific Islander alone (% change since 2000)
Races - Two or more races(%)
Races - Two or more races(% change since 2000)
Races - Other race alone (%)
Races - Other race alone (% change since 2000)
Racial diversity
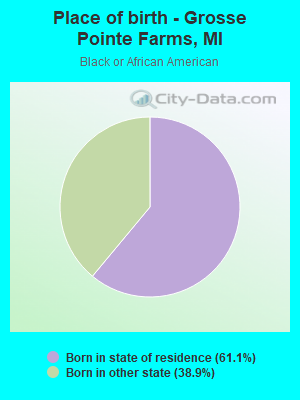
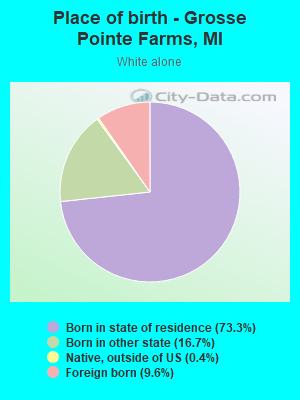
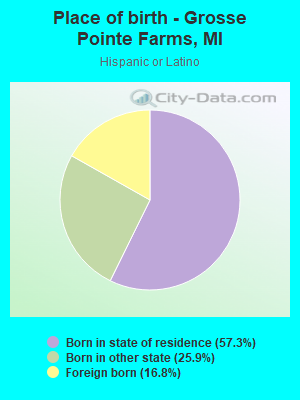
Place of birth - Born in state of residence (%)
Place of birth - Born in state of residence (%) - White
Place of birth - Born in state of residence (%) - Black or African American
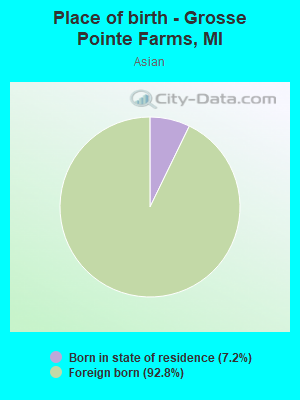
Place of birth - Born in state of residence (%) - Asian
Place of birth - Born in state of residence (%) - Hispanic or Latino
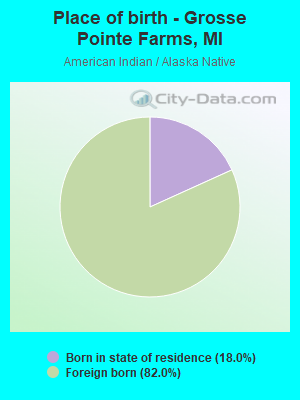
Place of birth - Born in state of residence (%) - American Indian and Alaska Native
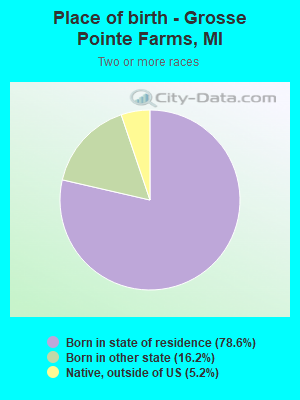
Place of birth - Born in state of residence (%) - Multirace
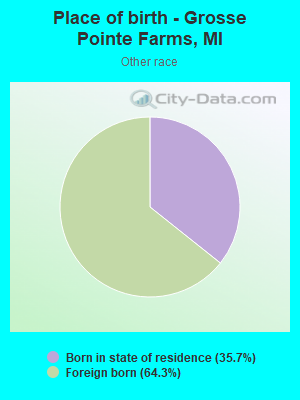
Place of birth - Born in state of residence (%) - Other Race
Place of birth - Born in other state (%)
Place of birth - Born in other state (%) - White
Place of birth - Born in other state (%) - Black or African American
Place of birth - Born in other state (%) - Asian
Place of birth - Born in other state (%) - Hispanic or Latino
Place of birth - Born in other state (%) - American Indian and Alaska Native
Place of birth - Born in other state (%) - Multirace
Place of birth - Born in other state (%) - Other Race
Place of birth - Native, outside of US (%)
Place of birth - Native, outside of US (%) - White
Place of birth - Native, outside of US (%) - Black or African American
Place of birth - Native, outside of US (%) - Asian
Place of birth - Native, outside of US (%) - Hispanic or Latino
Place of birth - Native, outside of US (%) - American Indian and Alaska Native
Place of birth - Native, outside of US (%) - Multirace
Place of birth - Native, outside of US (%) - Other Race
Place of birth - Foreign born (%)
Place of birth - Foreign born (%) - White
Place of birth - Foreign born (%) - Black or African American
Place of birth - Foreign born (%) - Asian
Place of birth - Foreign born (%) - Hispanic or Latino
Place of birth - Foreign born (%) - American Indian and Alaska Native
Place of birth - Foreign born (%) - Multirace
Place of birth - Foreign born (%) - Other Race
Residents speaking English at home (%)
Residents speaking English at home - Born in the United States (%)
Residents speaking English at home - Native, born elsewhere (%)
Residents speaking English at home - Foreign born (%)
Residents speaking Spanish at home (%)
Residents speaking Spanish at home - Born in the United States (%)
Residents speaking Spanish at home - Native, born elsewhere (%)
Residents speaking Spanish at home - Foreign born (%)
Residents speaking other language at home (%)
Residents speaking other language at home - Born in the United States (%)
Residents speaking other language at home - Native, born elsewhere (%)
Residents speaking other language at home - Foreign born (%)
Marital status - Never married (%)
Marital status - Now married (%)
Marital status - Separated (%)
Marital status - Widowed (%)
Marital status - Divorced (%)
Ancestries Reported - Arab (%)
Ancestries Reported - Czech (%)
Ancestries Reported - Danish (%)
Ancestries Reported - Dutch (%)
Ancestries Reported - English (%)
Ancestries Reported - French (%)
Ancestries Reported - French Canadian (%)
Ancestries Reported - German (%)
Ancestries Reported - Greek (%)
Ancestries Reported - Hungarian (%)
Ancestries Reported - Irish (%)
Ancestries Reported - Italian (%)
Ancestries Reported - Lithuanian (%)
Ancestries Reported - Norwegian (%)
Ancestries Reported - Polish (%)
Ancestries Reported - Portuguese (%)
Ancestries Reported - Russian (%)
Ancestries Reported - Scotch-Irish (%)
Ancestries Reported - Scottish (%)
Ancestries Reported - Slovak (%)
Ancestries Reported - Subsaharan African (%)
Ancestries Reported - Swedish (%)
Ancestries Reported - Swiss (%)
Ancestries Reported - Ukrainian (%)
Ancestries Reported - United States (%)
Ancestries Reported - Welsh (%)
Ancestries Reported - West Indian (%)
Ancestries Reported - Other (%)
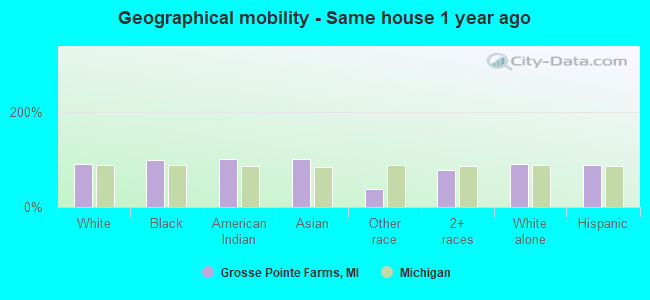
Geographical mobility - Same house 1 year ago (%)
Geographical mobility - Same house 1 year ago (%) - White
Geographical mobility - Same house 1 year ago (%) - Black or African American
Geographical mobility - Same house 1 year ago (%) - Asian
Geographical mobility - Same house 1 year ago (%) - Hispanic or Latino
Geographical mobility - Same house 1 year ago (%) - American Indian and Alaska Native
Geographical mobility - Same house 1 year ago (%) - Multirace
Geographical mobility - Same house 1 year ago (%) - Other Race
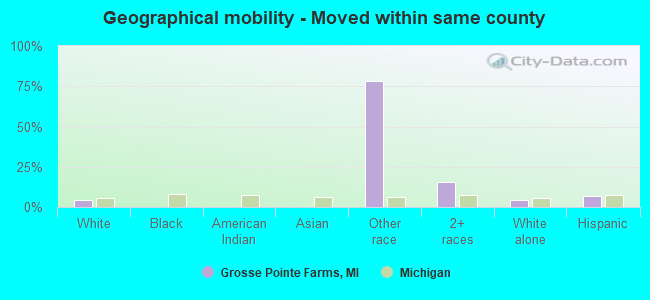
Geographical mobility - Moved within same county (%)
Geographical mobility - Moved within same county (%) - White
Geographical mobility - Moved within same county (%) - Black or African American
Geographical mobility - Moved within same county (%) - Asian
Geographical mobility - Moved within same county (%) - Hispanic or Latino
Geographical mobility - Moved within same county (%) - American Indian and Alaska Native
Geographical mobility - Moved within same county (%) - Multirace
Geographical mobility - Moved within same county (%) - Other Race
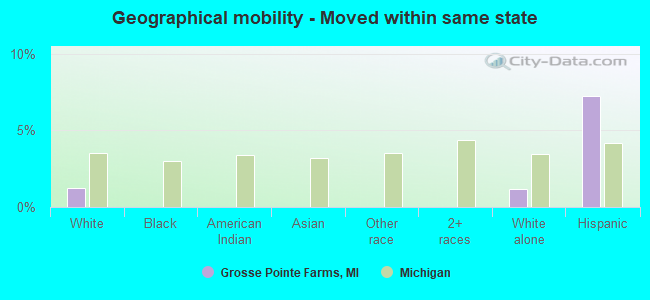
Geographical mobility - Moved from different county within same state (%)
Geographical mobility - Moved from different county within same state (%) - White
Geographical mobility - Moved from different county within same state (%) - Black or African American
Geographical mobility - Moved from different county within same state (%) - Asian
Geographical mobility - Moved from different county within same state (%) - Hispanic or Latino
Geographical mobility - Moved from different county within same state (%) - American Indian and Alaska Native
Geographical mobility - Moved from different county within same state (%) - Multirace
Geographical mobility - Moved from different county within same state (%) - Other Race
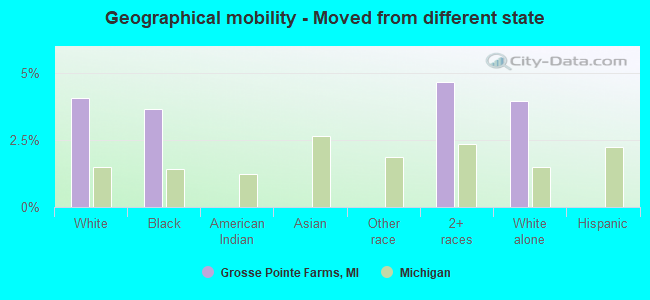
Geographical mobility - Moved from different state (%)
Geographical mobility - Moved from different state (%) - White
Geographical mobility - Moved from different state (%) - Black or African American
Geographical mobility - Moved from different state (%) - Asian
Geographical mobility - Moved from different state (%) - Hispanic or Latino
Geographical mobility - Moved from different state (%) - American Indian and Alaska Native
Geographical mobility - Moved from different state (%) - Multirace
Geographical mobility - Moved from different state (%) - Other Race
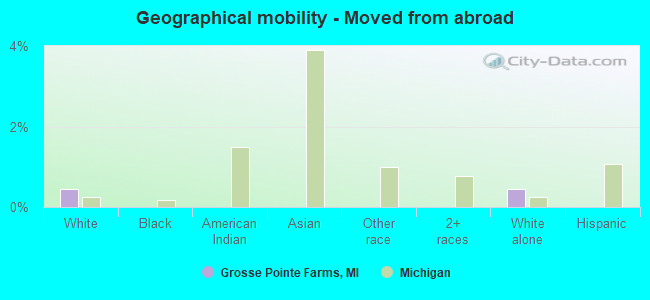
Geographical mobility - Moved from abroad (%)
Geographical mobility - Moved from abroad (%) - White
Geographical mobility - Moved from abroad (%) - Black or African American
Geographical mobility - Moved from abroad (%) - Asian
Geographical mobility - Moved from abroad (%) - Hispanic or Latino
Geographical mobility - Moved from abroad (%) - American Indian and Alaska Native
Geographical mobility - Moved from abroad (%) - Multirace
Geographical mobility - Moved from abroad (%) - Other Race
Place of birth for the foreign-born population - Ireland (%)
Place of birth for the foreign-born population - Denmark (%)
Place of birth for the foreign-born population - Norway (%)
Place of birth for the foreign-born population - Sweden (%)
Place of birth for the foreign-born population - United Kingdom (%)
Place of birth for the foreign-born population - England (%)
Place of birth for the foreign-born population - Scotland (%)
Place of birth for the foreign-born population - Other Northern Europe (%)
Place of birth for the foreign-born population - Austria (%)
Place of birth for the foreign-born population - Belgium (%)
Place of birth for the foreign-born population - France (%)
Place of birth for the foreign-born population - Germany (%)
Place of birth for the foreign-born population - Netherlands (%)
Place of birth for the foreign-born population - Switzerland (%)
Place of birth for the foreign-born population - Other Western Europe (%)
Place of birth for the foreign-born population - Greece (%)
Place of birth for the foreign-born population - Italy (%)
Place of birth for the foreign-born population - Portugal (%)
Place of birth for the foreign-born population - Spain (%)
Place of birth for the foreign-born population - Other Southern Europe (%)
Place of birth for the foreign-born population - Albania (%)
Place of birth for the foreign-born population - Belarus (%)
Place of birth for the foreign-born population - Bosnia and Herzegovina (%)
Place of birth for the foreign-born population - Bulgaria (%)
Place of birth for the foreign-born population - Croatia (%)
Place of birth for the foreign-born population - Czechoslovakia (%)
Place of birth for the foreign-born population - Hungary (%)
Place of birth for the foreign-born population - Latvia (%)
Place of birth for the foreign-born population - Lithuania (%)
Place of birth for the foreign-born population - North Macedonia (Macedonia) (%)
Place of birth for the foreign-born population - Moldova (%)
Place of birth for the foreign-born population - Poland (%)
Place of birth for the foreign-born population - Romania (%)
Place of birth for the foreign-born population - Russia (%)
Place of birth for the foreign-born population - Serbia (%)
Place of birth for the foreign-born population - Ukraine (%)
Place of birth for the foreign-born population - Other Eastern Europe (%)
Place of birth for the foreign-born population - China (%)
Place of birth for the foreign-born population - Hong Kong (%)
Place of birth for the foreign-born population - Taiwan (%)
Place of birth for the foreign-born population - Japan (%)
Place of birth for the foreign-born population - Korea (%)
Place of birth for the foreign-born population - Other Eastern Asia (%)
Place of birth for the foreign-born population - Afghanistan (%)
Place of birth for the foreign-born population - Bangladesh (%)
Place of birth for the foreign-born population - India (%)
Place of birth for the foreign-born population - Iran (%)
Place of birth for the foreign-born population - Kazakhstan (%)
Place of birth for the foreign-born population - Nepal (%)
Place of birth for the foreign-born population - Pakistan (%)
Place of birth for the foreign-born population - Sri Lanka (%)
Place of birth for the foreign-born population - Uzbekistan (%)
Place of birth for the foreign-born population - Other South Central Asia (%)
Place of birth for the foreign-born population - Burma (%)
Place of birth for the foreign-born population - Cambodia (%)
Place of birth for the foreign-born population - Indonesia (%)
Place of birth for the foreign-born population - Laos (%)
Place of birth for the foreign-born population - Malaysia (%)
Place of birth for the foreign-born population - Philippines (%)
Place of birth for the foreign-born population - Singapore (%)
Place of birth for the foreign-born population - Thailand (%)
Place of birth for the foreign-born population - Vietnam (%)
Place of birth for the foreign-born population - Other South Eastern Asia (%)
Place of birth for the foreign-born population - Armenia (%)
Place of birth for the foreign-born population - Iraq (%)
Place of birth for the foreign-born population - Israel (%)
Place of birth for the foreign-born population - Jordan (%)
Place of birth for the foreign-born population - Kuwait (%)
Place of birth for the foreign-born population - Lebanon (%)
Place of birth for the foreign-born population - Saudi Arabia (%)
Place of birth for the foreign-born population - Syria (%)
Place of birth for the foreign-born population - Turkey (%)
Place of birth for the foreign-born population - Yemen (%)
Place of birth for the foreign-born population - Other Western Asia (%)
Place of birth for the foreign-born population - Eritrea (%)
Place of birth for the foreign-born population - Ethiopia (%)
Place of birth for the foreign-born population - Kenya (%)
Place of birth for the foreign-born population - Somalia (%)
Place of birth for the foreign-born population - Uganda (%)
Place of birth for the foreign-born population - Zimbabwe (%)
Place of birth for the foreign-born population - Other Eastern Africa (%)
Place of birth for the foreign-born population - Cameroon (%)
Place of birth for the foreign-born population - Congo (%)
Place of birth for the foreign-born population - Democratic Republic of Congo (Zaire) (%)
Place of birth for the foreign-born population - Other Middle Africa (%)
Place of birth for the foreign-born population - Egypt (%)
Place of birth for the foreign-born population - Morocco (%)
Place of birth for the foreign-born population - Sudan (%)
Place of birth for the foreign-born population - Other Northern Africa (%)
Place of birth for the foreign-born population - South Africa (%)
Place of birth for the foreign-born population - Other Southern Africa (%)
Place of birth for the foreign-born population - Cabo Verde (%)
Place of birth for the foreign-born population - Ghana (%)
Place of birth for the foreign-born population - Liberia (%)
Place of birth for the foreign-born population - Nigeria (%)
Place of birth for the foreign-born population - Senegal (%)
Place of birth for the foreign-born population - Sierra Leone (%)
Place of birth for the foreign-born population - Other Western Africa (%)
Place of birth for the foreign-born population - Australia (%)
Place of birth for the foreign-born population - New Zealand (%)
Place of birth for the foreign-born population - Fiji (%)
Place of birth for the foreign-born population - Micronesia (%)
Place of birth for the foreign-born population - Bahamas (%)
Place of birth for the foreign-born population - Barbados (%)
Place of birth for the foreign-born population - Cuba (%)
Place of birth for the foreign-born population - Dominica (%)
Place of birth for the foreign-born population - Dominican Republic (%)
Place of birth for the foreign-born population - Grenada (%)
Place of birth for the foreign-born population - Haiti (%)
Place of birth for the foreign-born population - Jamaica (%)
Place of birth for the foreign-born population - St. Vincent and the Grenadines (%)
Place of birth for the foreign-born population - Trinidad and Tobago (%)
Place of birth for the foreign-born population - West Indies (%)
Place of birth for the foreign-born population - Other Caribbean (%)
Place of birth for the foreign-born population - Belize (%)
Place of birth for the foreign-born population - Costa Rica (%)
Place of birth for the foreign-born population - El Salvador (%)
Place of birth for the foreign-born population - Guatemala (%)
Place of birth for the foreign-born population - Honduras (%)
Place of birth for the foreign-born population - Mexico (%)
Place of birth for the foreign-born population - Nicaragua (%)
Place of birth for the foreign-born population - Panama (%)
Place of birth for the foreign-born population - Other Central America (%)
Place of birth for the foreign-born population - Argentina (%)
Place of birth for the foreign-born population - Bolivia (%)
Place of birth for the foreign-born population - Brazil (%)
Place of birth for the foreign-born population - Chile (%)
Place of birth for the foreign-born population - Colombia (%)
Place of birth for the foreign-born population - Ecuador (%)
Place of birth for the foreign-born population - Guyana (%)
Place of birth for the foreign-born population - Peru (%)
Place of birth for the foreign-born population - Uruguay (%)
Place of birth for the foreign-born population - Venezuela (%)
Place of birth for the foreign-born population - Other South America (%)
Place of birth for the foreign-born population - Canada (%)
Place of birth for the foreign-born population - Other Northern America (%)
Place of birth for the foreign-born population - Other (%)
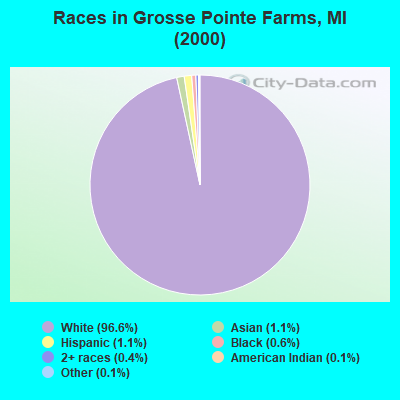
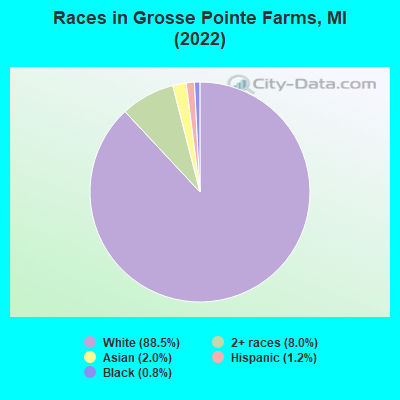
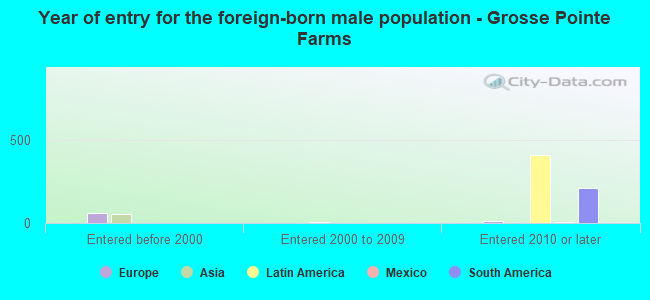
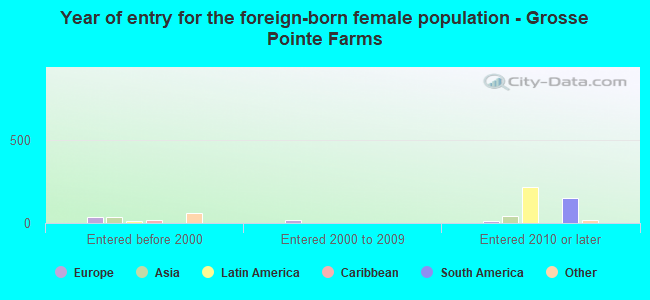
According to 2022 data, the most numerous races in Grosse Pointe Farms, MI are White alone (8,742 residents), Black alone (81 residents), and Hispanic (118 residents). 92.0% of Grosse Pointe Farms residents speak English at home. 10.0% of Grosse Pointe Farms, MI residents are foreign-born (6.3% born in Latin America, 1.5% born in Asia, 1.3% born in Europe), which is 40.1% greater than the foreign-born rate of 6.0% across the entire state of Michigan.
Race distribution in Grosse Pointe Farms
2000 2022
7,806,691 78.6% White alone 1,402,047 14.1% Black alone 323,877 3.3% Hispanic 175,311 1.8% Asian alone 163,487 1.6% Two or more races 53,421 0.5% American Indian alone 11,465 0.1% Other race alone 2,145 0.02% Native Hawaiian and Other
7,289,051 72.6% White alone 1,310,464 13.1% Black alone 572,405 5.7% Hispanic 450,031 4.5% Two or more races 335,732 3.3% Asian alone 45,217 0.5% Other race alone 29,011 0.3% American Indian alone 2,207 0.02% Native Hawaiian and Other
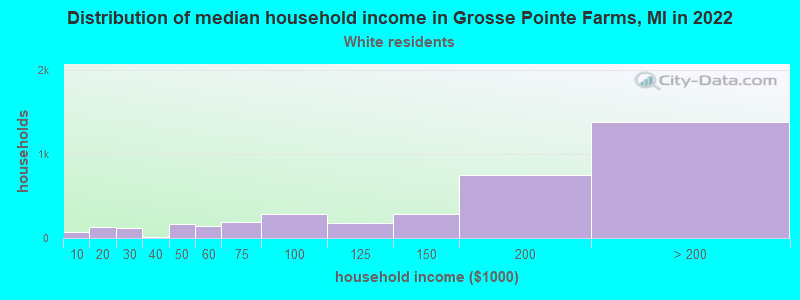
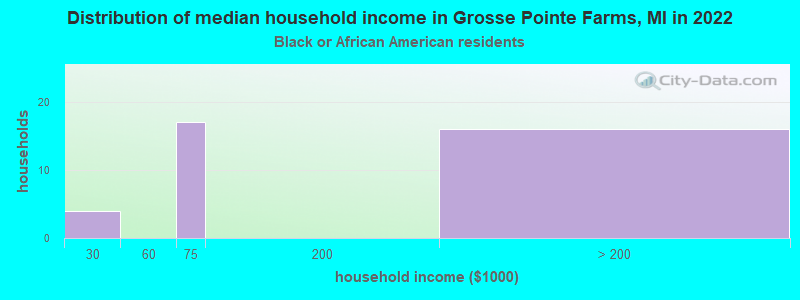
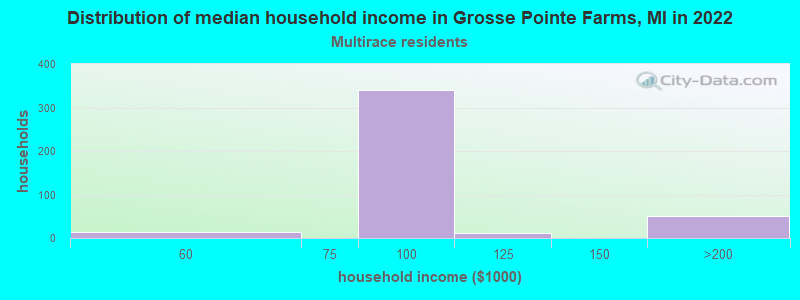
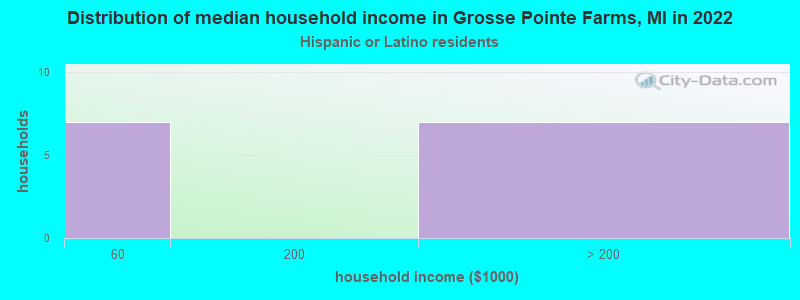
Income and house value in Grosse Pointe Farms Median household income in 2022 $163,752 White non-Hispanic householders$77,283 Two or more races householdersMedian 2022 house value $450,840 White Non-Hispanic householders$106,581 Black or African American householders $662,785 Asian householders$98,968 Some other race householders$244,681 Two or more races householders$100,948 Hispanic or Latino householders
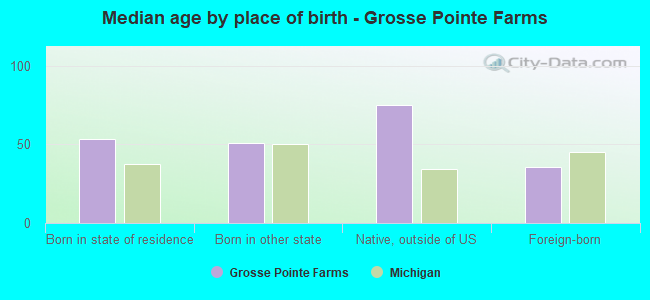
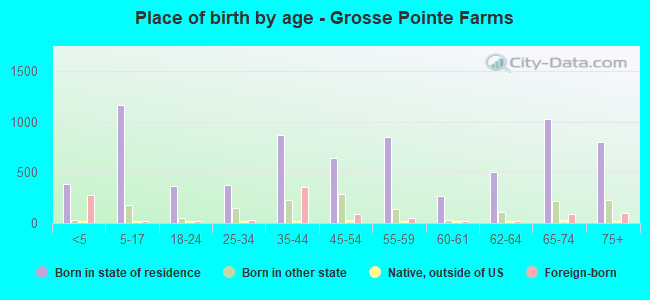
Median age by race in Grosse Pointe Farms
52.5 Median age for White residents52.0 53.3 63.8 Median age for Black or African American residents64.2 64.0 32.6 Median age for American Indian / Alaska Native residents-795,074,757.3 -684,380,031.5 41.6 Median age for Asian residents40.8 47.1 -934,108,526.2 Median age for Native Hawaiian / Pacific Islander residents-674,772,035.8 -699,588,476.7 -727,272,726.5 Median age for Other race residents-747,549,018.9 -709,523,808.8 48.5 Median age for Two or more races residents17.0 92.1 52.1 Median age for White alone residents51.8 53.0 33.8 Median age for Hispanic or Latino residents25.2 40.9
Owner/renter occupied households by race in Grosse Pointe Farms
House owners and renters - White residents 3,658 95.6% Owner occupied168 4.4% Renter occupiedHouse owners and renters - Black or African American residents 44 100.0% Owner occupiedHouse owners and renters - American Indian / Alaska Native residents 1 100.0% Owner occupiedHouse owners and renters - Asian residents 10 100.0% Owner occupiedHouse owners and renters - Other race residents 6 100.0% Owner occupiedHouse owners and renters - Two or more races residents 423 100.0% Owner occupiedHouse owners and renters - White alone residents 3,684 95.6% Owner occupied171 4.4% Renter occupiedHouse owners and renters - Hispanic or Latino residents 11 100.0% Owner occupied
Language usage in Grosse Pointe Farms
English speakers - Total 92.0% of residents of Grosse Pointe Farms speak English at home.
2.9% of residents speak Spanish at home 243 90.0% Speak English very well27 10.0% Speak English less than very well4.4% of residents speak other language at home 369 91.3% Speak English very well35 8.7% Speak English less than very well
English speakers - Born in the United States 97.4% of residents of Grosse Pointe Farms speak English at home.
1.0% of residents speak Spanish at home 16 100.0% Speak English very well0.8% of residents speak other language at home 13 100.0% Speak English very well
All residents speak only English at home
English speakers - Foreign-born 24.1% of residents of Grosse Pointe Farms speak English at home.
28.5% of residents speak Spanish at home 216 100.0% Speak English very well40.4% of residents speak other language at home 285 92.8% Speak English very well22 7.2% Speak English less than very well
White (Caucasian) - Speak only English Native:
99.8% (7,403)Foreign-born:
26.1% (145)
White (Caucasian) - Speak another language Native:
1.3% (95)Foreign-born:
74.1% (410)
American Indian / Alaska Native - Speak only English Native:
82.8% (3)Foreign-born:
24.8% (3)
Asian - Speak another language Native:
100.0% (4)Foreign-born:
79.4% (145)
Other race - Speak another language Native:
100.0% (5)Foreign-born:
100.0% (9)
White alone - Speak only English Native:
99.3% (7,437)Foreign-born:
25.6% (147)
White alone - Speak another language Native:
1.3% (98)Foreign-born:
74.0% (425)
Hispanic or Latino - Speak another language Native:
48.4% (40)Foreign-born:
100.0% (20)
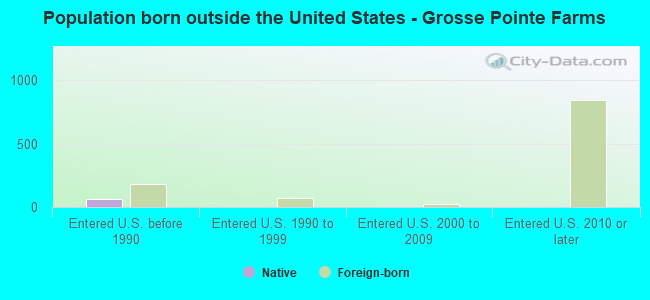
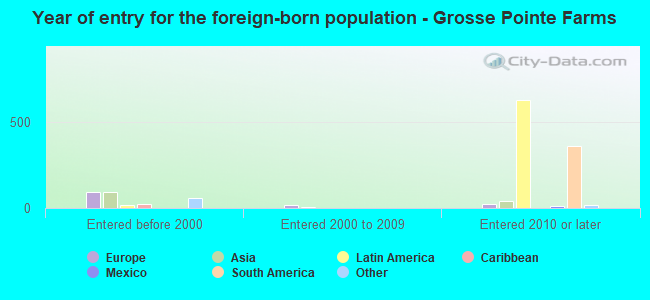
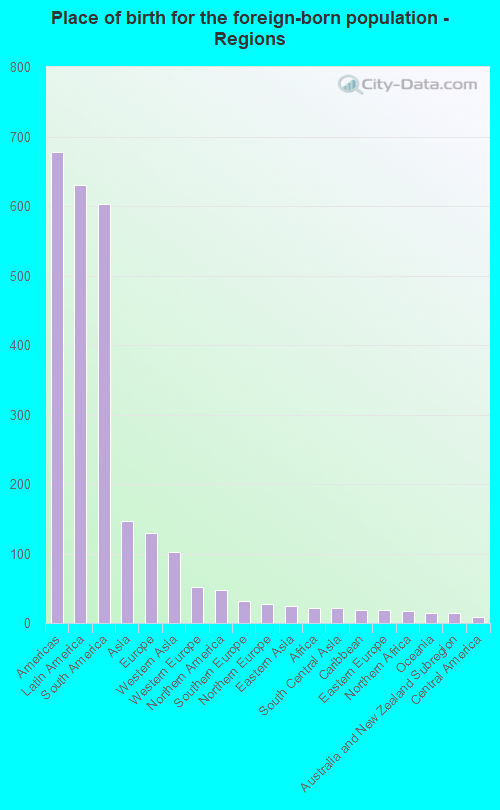
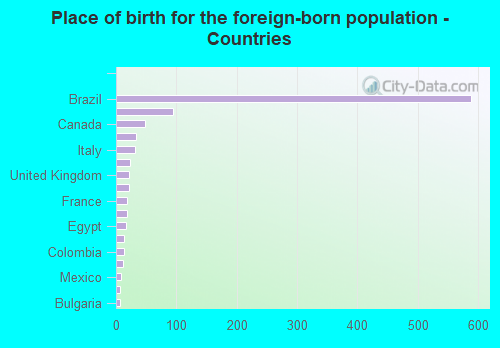
Foreign-born residents in Grosse Pointe Farms 990 residents are foreign born (6.3% Latin America , 1.5% Asia , 1.3% Europe ).
This city:
10.0%Michigan:
6.9%
Marital status for residents in Grosse Pointe Farms Marital status - White (Caucasian) population 15 years and over
Males 20.4% Never married68.6% Now married0.5% Separated3.9% Widowed6.5% DivorcedFemales 14.2% Never married68.6% Now married0.5% Separated9.1% Widowed7.6% DivorcedWomen who gave birth in the past 12 months Now married:
100.0% (41)Unmarried:
0.0% (0)
Women who did not give birth in the past 12 months Now married:
62.0% (800)Unmarried:
38.0% (491)
Marital status - Black or African American population 15 years and over
Males 7.1% Never married25.0% Now married50.0% Separated0.0% Widowed17.9% DivorcedFemales 32.1% Never married32.1% Now married0.0% Separated35.7% Widowed0.0% DivorcedMarital status - American Indian / Alaska Native population 15 years and over
Males 0.0% Never married0.0% Now married0.0% Separated0.0% Widowed100.0% DivorcedFemales 100.0% Never married0.0% Now married0.0% Separated0.0% Widowed0.0% DivorcedWomen who did not give birth in the past 12 months Now married:
0.0% (0)Unmarried:
100.0% (10)
Marital status - Asian population 15 years and over
Males 0.0% Never married100.0% Now married0.0% Separated0.0% Widowed0.0% DivorcedFemales 12.1% Never married87.9% Now married0.0% Separated0.0% Widowed0.0% DivorcedWomen who did not give birth in the past 12 months Now married:
84.6% (21)Unmarried:
15.4% (4)
Marital status - Two or more races population 15 years and over
Males 40.9% Never married59.1% Now married0.0% Separated0.0% Widowed0.0% DivorcedFemales 6.1% Never married27.2% Now married0.0% Separated64.9% Widowed1.8% DivorcedWomen who did not give birth in the past 12 months Now married:
80.2% (119)Unmarried:
19.8% (29)
Marital status - White alone, not Hispanic / Latino population 15 years and over
Males 20.4% Never married68.6% Now married0.5% Separated3.9% Widowed6.5% DivorcedFemales 14.3% Never married68.5% Now married0.5% Separated9.2% Widowed7.5% DivorcedWomen who gave birth in the past 12 months Now married:
100.0% (41)Unmarried:
0.0% (0)
Women who did not give birth in the past 12 months Now married:
61.6% (804)Unmarried:
38.4% (502)
Marital status - Hispanic or Latino population 15 years and over
Males 35.8% Never married54.7% Now married0.0% Separated0.0% Widowed9.4% DivorcedFemales 0.0% Never married81.5% Now married0.0% Separated0.0% Widowed18.5% DivorcedWomen who did not give birth in the past 12 months Now married:
100.0% (14)Unmarried:
0.0% (0)
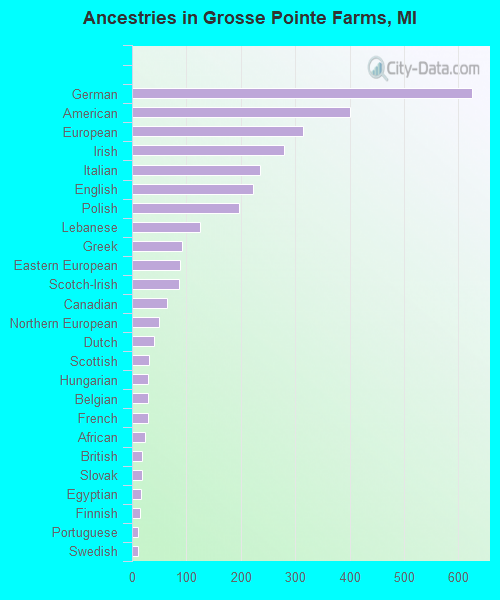
Ancestries in Grosse Pointe Farms
625 17.1% German400 11.0% American315 8.6% European280 7.7% Irish236 6.5% Italian222 6.1% English197 5.4% Polish125 3.4% Lebanese91 2.5% Greek89 2.4% Eastern European87 2.4% Scotch-Irish64 1.8% Canadian49 1.3% Northern European40 1.1% Dutch32 0.9% Scottish30 0.8% Hungarian29 0.8% Belgian29 0.8% French23 0.6% African19 0.5% British18 0.5% Slovak16 0.4% Egyptian15 0.4% Finnish11 0.3% Portuguese11 0.3% Swedish7 0.2% Danish7 0.2% Maltese7 0.2% Norwegian6 0.2% Macedonian6 0.2% Russian5 0.1% Jordanian5 0.1% Scandinavian5 0.1% Welsh2 0.05% Bulgarian2 0.05% Czechoslovakian
Children Nativity (place of birth) in Grosse Pointe Farms
Children under 6 years - Living with two parents Both parents native 489 100.0% NativeBoth parents foreign-born 15 3.9% Native365 96.1% Foreign-bornOne native, one foreign-born parent 35 100.0% NativeChildren under 6 years - Living with one parent Native parent 5 100.0% NativeChildren 6 to 17 years - Living with two parents Both parents native 1,030 99.9% Native1 0.1% Foreign-bornBoth parents foreign-born 24 61.9% Native15 38.1% Foreign-bornOne native, one foreign-born parent 62 100.0% NativeChildren 6 to 17 years - Living with one parent Native parent 112 100.0% Native
Grandparents responsible for own grandchildren in Grosse Pointe Farms
Grandparents (30 to 59 years) White / Caucasian 21 66.4% Responsible for grandchildren11 33.6% Not responsible for grandchildrenWhite alone, not Hispanic / Latino 21 65.1% Responsible for grandchildren11 34.9% Not responsible for grandchildrenGrandparents (60 years and over) White / Caucasian 26 55.8% Responsible for grandchildren21 44.2% Not responsible for grandchildrenWhite alone, not Hispanic / Latino 25 53.1% Responsible for grandchildren22 46.9% Not responsible for grandchildren