Races in Grosse Pointe Park, Michigan (MI) Detailed Stats
Ancestries, Foreign-born residents, place of birth
Settings
X


Recent posts about races in Grosse Pointe Park, Michigan on our local forum with over 2,400,000 registered users:

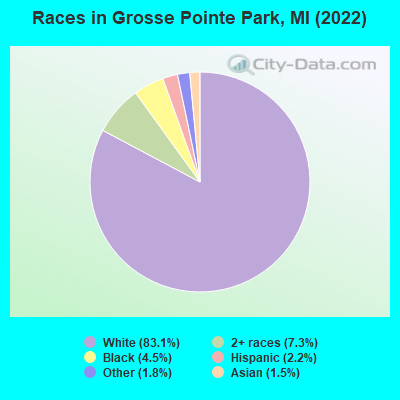
According to 2022 data, the most numerous races in Grosse Pointe Park, MI are White alone (9,431 residents), Black alone (508 residents), and Hispanic (249 residents). 91.9% of Grosse Pointe Park residents speak English at home. 6.9% of Grosse Pointe Park, MI residents are foreign-born (4.2% born in Europe, 1.4% born in Asia, 0.7% born in North America), which is 13.1% greater than the foreign-born rate of 6.0% across the entire state of Michigan.
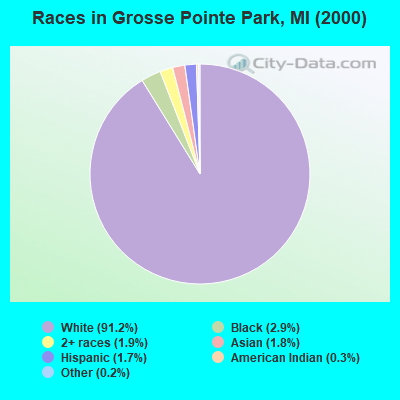
Race distribution in Grosse Pointe Park
2000
2022

- 11,34591.2%White alone
- 3622.9%Black alone
- 2331.9%Two or more races
- 2201.8%Asian alone
- 2171.7%Hispanic
- 410.3%American Indian alone
- 210.2%Other race alone
- 40.03%Native Hawaiian and Other
Pacific Islander alone
-
- 9,43183.1%White alone
- 8287.3%Two or more races
- 5084.5%Black alone
- 2492.2%Hispanic
- 2101.8%Other race alone
- 1751.5%Asian alone
2000
2022
-
- 7,806,69178.6%White alone
- 1,402,04714.1%Black alone
- 323,8773.3%Hispanic
- 175,3111.8%Asian alone
- 163,4871.6%Two or more races
- 53,4210.5%American Indian alone
- 11,4650.1%Other race alone
- 2,1450.02%Native Hawaiian and Other
Pacific Islander alone

-
- 7,289,05172.6%White alone
- 1,310,46413.1%Black alone
- 572,4055.7%Hispanic
- 450,0314.5%Two or more races
- 335,7323.3%Asian alone
- 45,2170.5%Other race alone
- 29,0110.3%American Indian alone
- 2,2070.02%Native Hawaiian and Other
Pacific Islander alone

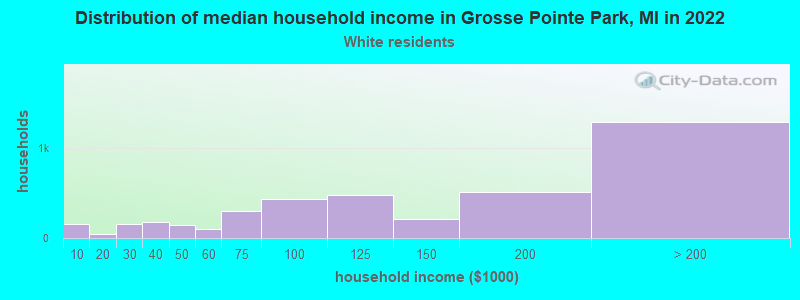
Income and house value in Grosse Pointe Park
- Median household income in 2022
- $129,625White non-Hispanic householders
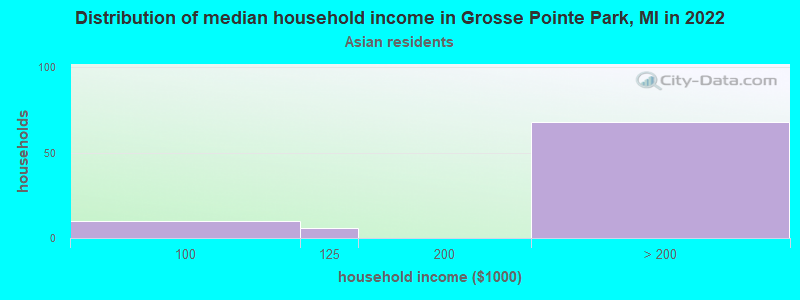
- over $200,000Asian householders
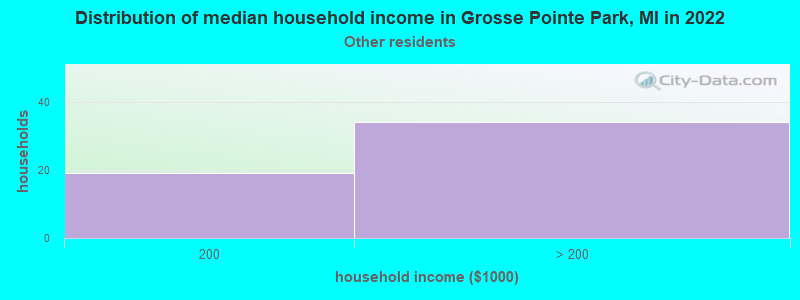
- over $200,000Some other race householders
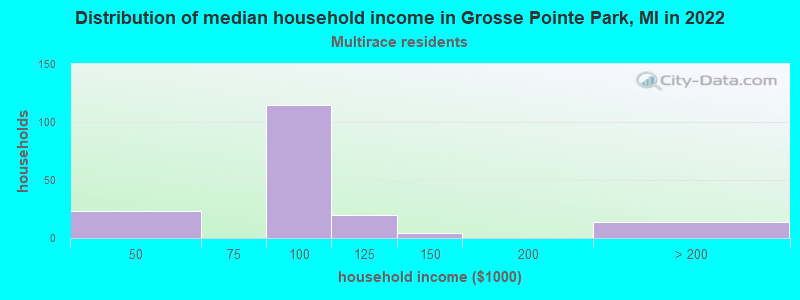
- $75,162Two or more races householders
- Median 2022 house value
- $516,894White Non-Hispanic householders
- $535,282Black or African American householders
- $695,373American Indian or Alaska Native householders
- $427,886Asian householders
- $540,845Some other race householders
- $354,176Two or more races householders
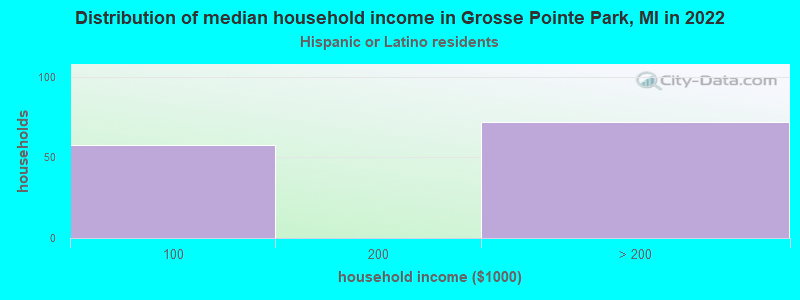
- $376,737Hispanic or Latino householders
Household income for White non-Hispanic householders
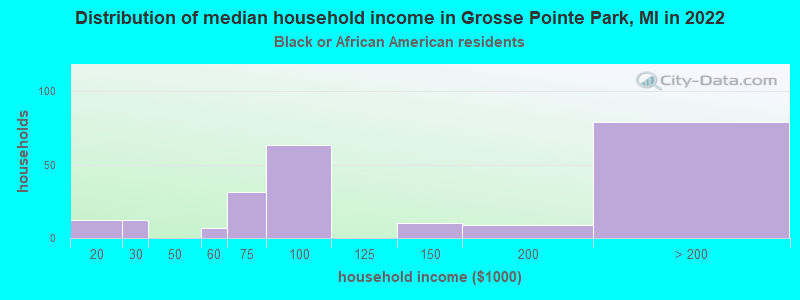
Household income for Black householders
Household income for Asian householders
Household income for Some other race householders
Household income for Two or more races householders
Household income for Hispanic or Latino race householders
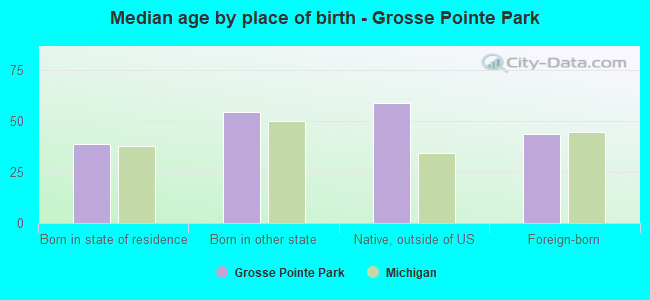
Median age by race in Grosse Pointe Park
- 45.3Median age for White residents
- 48.3Males
- 42.6Females
- 41.1Median age for Black or African American residents
- 36.5Males
- 48.7Females
- -738,693,466.6Median age for American Indian / Alaska Native residents
- -795,074,757.3Males
- -684,380,031.5Females
- 48.5Median age for Asian residents
- 52.7Males
- 48.8Females
- -934,108,526.2Median age for Native Hawaiian / Pacific Islander residents
- -674,772,035.8Males
- -699,588,476.7Females
- 33.8Median age for Other race residents
- 26.2Males
- 64.1Females
- 23.2Median age for Two or more races residents
- 15.1Males
- 24.0Females
- 44.9Median age for White alone residents
- 48.1Males
- 42.4Females
- 48.9Median age for Hispanic or Latino residents
- 31.8Males
- 54.5Females
Owner/renter occupied households by race in Grosse Pointe Park
- House owners and renters - White residents
- 3,22779.3%Owner occupied
- 84420.7%Renter occupied
- House owners and renters - Black or African American residents
- 18171.6%Owner occupied
- 7228.4%Renter occupied
- House owners and renters - Asian residents
- 88100.0%Owner occupied
- House owners and renters - Native Hawaiian / Pacific Islander residents
- 1100.0%Owner occupied
- House owners and renters - Other race residents
- 2365.1%Owner occupied
- 1234.9%Renter occupied
- House owners and renters - Two or more races residents
- 4121.3%Owner occupied
- 15178.7%Renter occupied
- House owners and renters - White alone residents
- 3,20179.5%Owner occupied
- 82820.5%Renter occupied
- House owners and renters - Hispanic or Latino residents
- 8872.8%Owner occupied
- 3327.2%Renter occupied
Language usage in Grosse Pointe Park
- English speakers - Total
- 91.9% of residents of Grosse Pointe Park speak English at home.
- 2.4% of residents speak Spanish at home
- 17969.6%Speak English very well
- 7830.4%Speak English less than very well
- 5.4% of residents speak other language at home
- 39367.2%Speak English very well
- 19232.8%Speak English less than very well
- English speakers - Born in the United States
- 92.4% of residents of Grosse Pointe Park speak English at home.
- 0.6% of residents speak Spanish at home
- 11100.0%Speak English very well
- 6.3% of residents speak other language at home
- 8575.2%Speak English very well
- 2824.8%Speak English less than very well
All residents speak only English at home
- English speakers - Foreign-born
- 38.6% of residents of Grosse Pointe Park speak English at home.
- 11.3% of residents speak Spanish at home
- 3135.6%Speak English very well
- 5664.4%Speak English less than very well
- 45.6% of residents speak other language at home
- 23867.8%Speak English very well
- 11332.2%Speak English less than very well
White (Caucasian) - Speak only English
| Native: | 97.9% (8,241) |
| Foreign-born: | 40.0% (253) |
White (Caucasian) - Speak another language
| Native: | 2.9% (245) |
| Foreign-born: | 60.5% (382) |
Asian - Speak only English
| Native: | 64.0% (50) |
| Foreign-born: | 57.4% (57) |
Asian - Speak another language
| Native: | 33.6% (26) |
| Foreign-born: | 49.4% (49) |
Other race - Speak another language
| Native: | 27.3% (57) |
| Foreign-born: | 100.0% (21) |
Two or more races - Speak another language
| Native: | 5.8% (51) |
| Foreign-born: | 100.0% (15) |
White alone - Speak only English
| Native: | 97.3% (8,241) |
| Foreign-born: | 42.6% (258) |
White alone - Speak another language
| Native: | 3.1% (263) |
| Foreign-born: | 56.5% (342) |
Hispanic or Latino - Speak another language
| Native: | 9.9% (12) |
| Foreign-born: | 100.0% (88) |
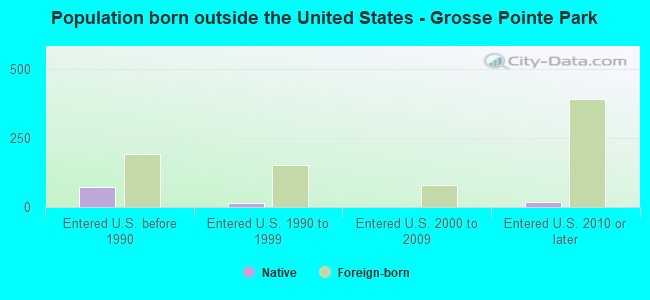
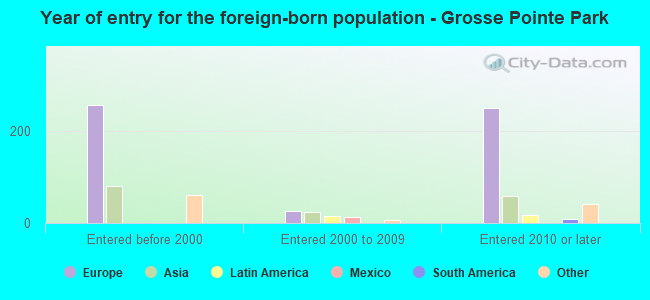
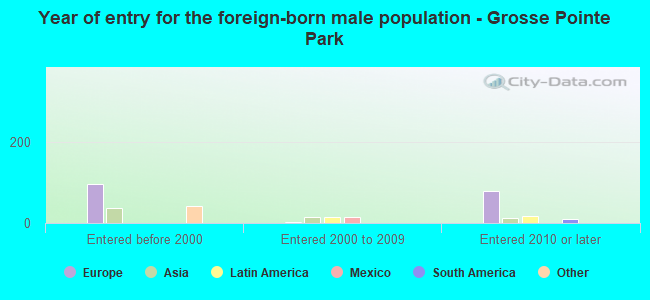
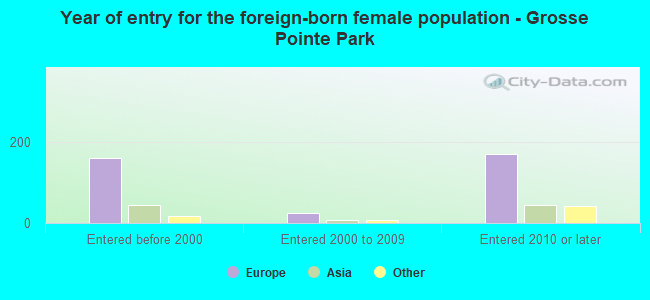
Foreign-born residents in Grosse Pointe Park
784 residents are foreign born (4.2% Europe, 1.4% Asia, 0.7% North America).
| This city: | 6.9% |
| Michigan: | 6.9% |
Marital status for residents in Grosse Pointe Park
Marital status - White (Caucasian) population 15 years and over
- Males
- 25.0%Never married
- 70.1%Now married
- 0.3%Separated
- 1.3%Widowed
- 3.4%Divorced
- Females
- 26.9%Never married
- 60.8%Now married
- 0.2%Separated
- 5.1%Widowed
- 7.1%Divorced
Women who gave birth in the past 12 months
| Now married: | 100.0% (66) |
| Unmarried: | 0.0% (0) |
Women who did not give birth in the past 12 months
| Now married: | 49.0% (1,020) |
| Unmarried: | 51.0% (1,062) |
Marital status - Black or African American population 15 years and over
- Males
- 45.5%Never married
- 48.4%Now married
- 0.0%Separated
- 6.1%Widowed
- 0.0%Divorced
- Females
- 42.9%Never married
- 26.3%Now married
- 0.0%Separated
- 4.6%Widowed
- 26.3%Divorced
Women who did not give birth in the past 12 months
| Now married: | 28.9% (27) |
| Unmarried: | 71.1% (66) |
Marital status - Asian population 15 years and over
- Males
- 7.1%Never married
- 92.9%Now married
- 0.0%Separated
- 0.0%Widowed
- 0.0%Divorced
- Females
- 14.8%Never married
- 85.2%Now married
- 0.0%Separated
- 0.0%Widowed
- 0.0%Divorced
Women who did not give birth in the past 12 months
| Now married: | 75.5% (39) |
| Unmarried: | 24.5% (13) |
Marital status - Other race population 15 years and over
- Males
- 64.7%Never married
- 35.3%Now married
- 0.0%Separated
- 0.0%Widowed
- 0.0%Divorced
- Females
- 10.7%Never married
- 89.3%Now married
- 0.0%Separated
- 0.0%Widowed
- 0.0%Divorced
Women who did not give birth in the past 12 months
| Now married: | 54.2% (14) |
| Unmarried: | 45.8% (12) |
Marital status - Two or more races population 15 years and over
- Males
- 35.6%Never married
- 22.2%Now married
- 0.0%Separated
- 0.0%Widowed
- 42.2%Divorced
- Females
- 68.2%Never married
- 28.5%Now married
- 0.0%Separated
- 0.0%Widowed
- 3.2%Divorced
Women who gave birth in the past 12 months
| Now married: | 100.0% (22) |
| Unmarried: | 0.0% (0) |
Women who did not give birth in the past 12 months
| Now married: | 22.7% (130) |
| Unmarried: | 77.3% (443) |
Marital status - White alone, not Hispanic / Latino population 15 years and over
- Males
- 25.2%Never married
- 69.8%Now married
- 0.3%Separated
- 1.3%Widowed
- 3.4%Divorced
- Females
- 27.3%Never married
- 60.1%Now married
- 0.2%Separated
- 5.2%Widowed
- 7.2%Divorced
Women who gave birth in the past 12 months
| Now married: | 100.0% (67) |
| Unmarried: | 0.0% (0) |
Women who did not give birth in the past 12 months
| Now married: | 48.4% (1,007) |
| Unmarried: | 51.6% (1,074) |
Marital status - Hispanic or Latino population 15 years and over
- Males
- 27.4%Never married
- 72.6%Now married
- 0.0%Separated
- 0.0%Widowed
- 0.0%Divorced
- Females
- 12.9%Never married
- 69.3%Now married
- 0.0%Separated
- 0.0%Widowed
- 17.9%Divorced
Women who did not give birth in the past 12 months
| Now married: | 68.5% (38) |
| Unmarried: | 31.5% (18) |
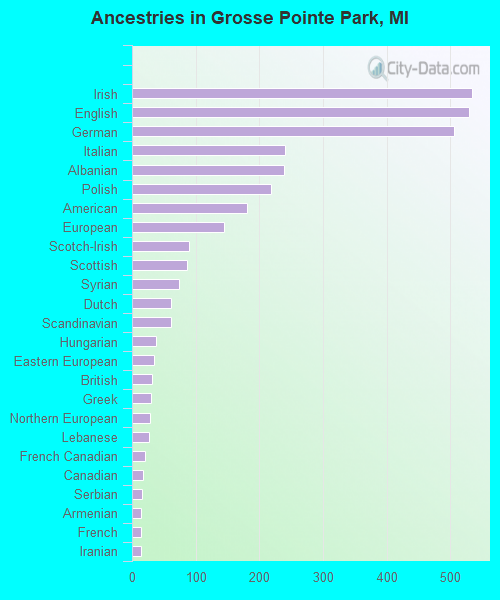
Ancestries in Grosse Pointe Park

- 53413.5%Irish
- 53013.4%English
- 50612.8%German
- 2406.1%Italian
- 2396.1%Albanian
- 2185.5%Polish
- 1814.6%American
- 1453.7%European
- 902.3%Scotch-Irish
- 862.2%Scottish
- 741.9%Syrian
- 621.6%Dutch
- 621.6%Scandinavian
- 381.0%Hungarian
- 350.9%Eastern European
- 320.8%British
- 300.8%Greek
- 290.7%Northern European
- 260.7%Lebanese
- 210.5%French Canadian
- 180.5%Canadian
- 160.4%Serbian
- 140.4%Armenian
- 140.4%French
- 140.4%Iranian
- 130.3%Romanian
- 130.3%Belgian
- 110.3%Swedish
- 100.3%Russian
- 100.3%Norwegian
- 100.3%Swiss
- 90.2%Slovak
- 90.2%Ukrainian
- 80.2%Finnish
- 70.2%Turkish
- 60.2%Lithuanian
- 60.2%Welsh
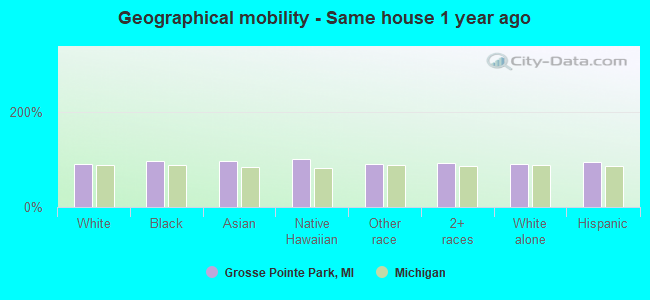
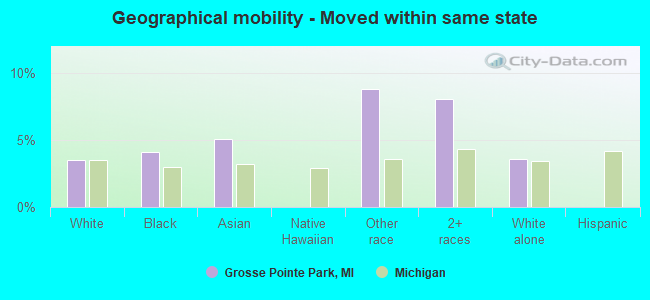
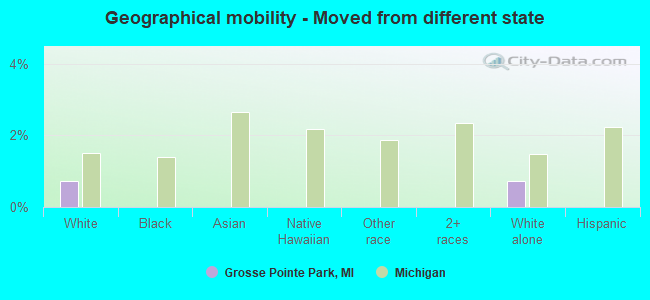
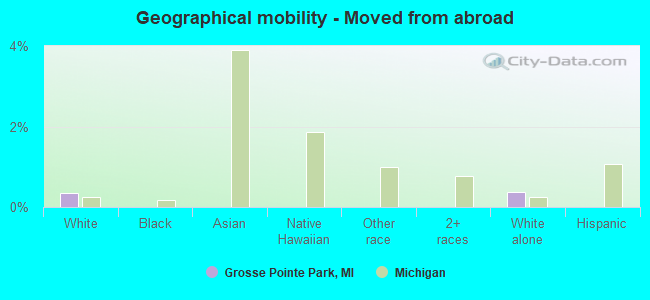
Geographical mobility in Grosse Pointe Park

- Same house 1 year ago
- 8,55091.4%White (Caucasian)
- 49796.1%Black or African American
- 16996.4%Asian
- 1100.0%Native Hawaiian / Pacific Islander
- 23491.1%Other race
- 87392.7%Two or more races
- 8,54191.2%White alone, not Hispanic / Latino
- 23694.1%Hispanic or Latino
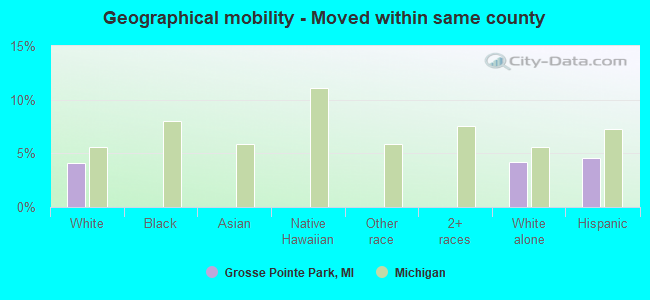
-
- Moved within same county
- 3824.1%White / Caucasian
- 3954.2%White alone, not Hispanic / Latino
- 114.6%Hispanic or Latino
-
- Moved within same state
- 3303.5%White / Caucasian
- 214.1%Black or African American
- 95.1%Asian
- 238.8%Other race
- 768.1%Two or more races
- 3363.6%White alone, not Hispanic / Latino
-
- Moved from different state
- 680.7%White / Caucasian
- 680.7%White alone, not Hispanic / Latino
-
- Moved from abroad
- 330.4%White
- 340.4%White alone, not Hispanic / Latino
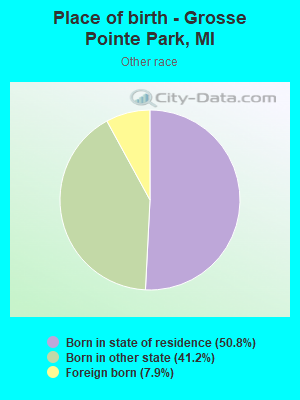
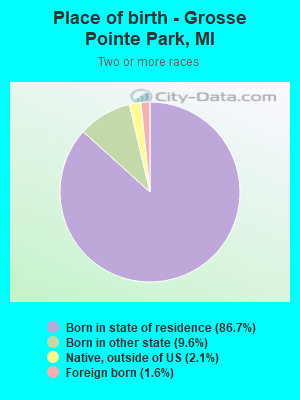
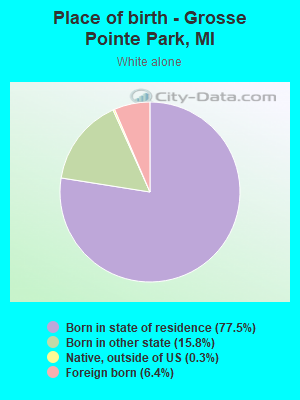
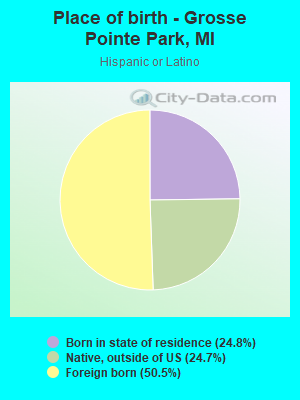
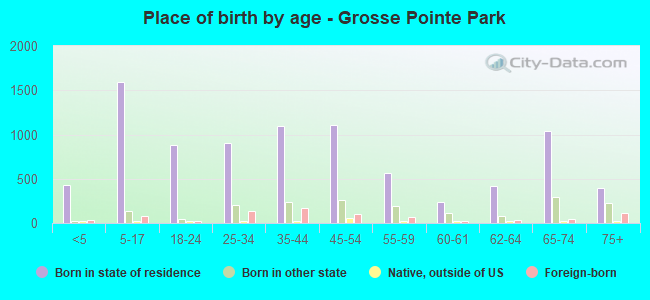
Children Nativity (place of birth) in Grosse Pointe Park
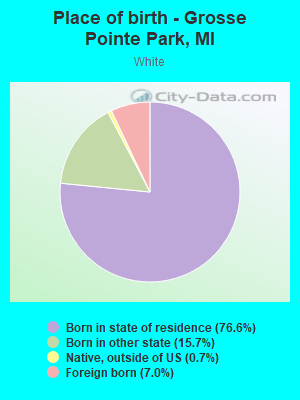
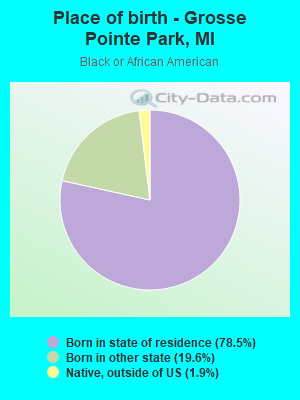
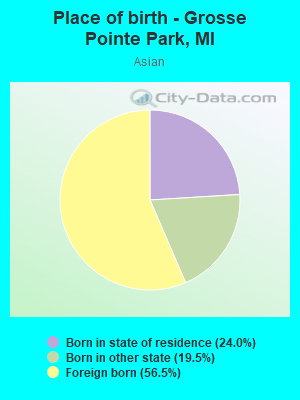
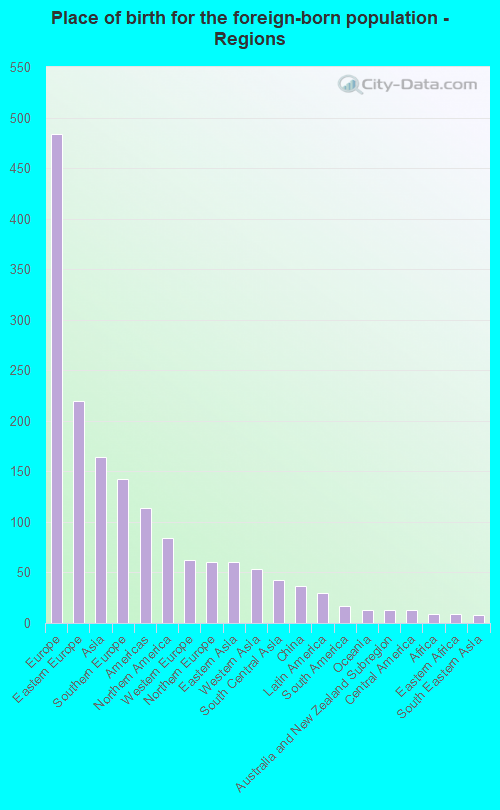
Place of birth for residents in Grosse Pointe Park
![Place of birth for the foreign-born population - Regions]()
- 484Europe
- 220Eastern Europe
- 164Asia
- 142Southern Europe
- 114Americas
- 84Northern America
- 62Western Europe
- 60Northern Europe
- 60Eastern Asia
- 53Western Asia
- 43South Central Asia
- 37China
- 30Latin America
- 17South America
- 13Oceania
- 13Australia and New Zealand Subregion
- 13Central America
- 9Africa
- 9Eastern Africa
- 8South Eastern Asia
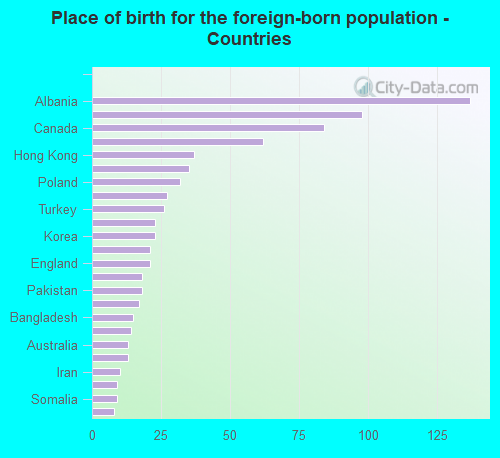
![Place of birth for the foreign-born population - Countries]()
- 137Albania
- 98Spain
- 84Canada
- 62Germany
- 37Hong Kong
- 35Greece
- 32Poland
- 27Iraq
- 26Turkey
- 23North Macedonia (Macedonia)
- 23Korea
- 21Ireland
- 21England
- 18United Kingdom
- 18Pakistan
- 17Ecuador
- 15Bangladesh
- 14Romania
- 13Australia
- 13Mexico
- 10Iran
- 9Italy
- 9Somalia
- 8Cambodia
Grandparents responsible for own grandchildren in Grosse Pointe Park
Zip codes: 48230.