Races in Grosse Pointe Shores, Michigan (MI) Detailed Stats
Ancestries, Foreign-born residents, place of birth

Recent posts about races in Grosse Pointe Shores, Michigan on our local forum with over 2,400,000 registered users:
 | Looking for a suburb of Detroit - good place to raise kids, semi-upscale but not snobby (72 replies) |
| Michigan feels economically depressed (69 replies) |
| After Bloomfield Hills/Twp, what's the best affluent burb? (32 replies) |
| Moving for work in Grosse Pointe (27 replies) |
| Kiss The Light Rail Goodbye... (328 replies) |
| We'll be future tourists - how about this plan? (11 replies) |
12.7% of Grosse Pointe Shores, MI residents are foreign-born (5.5% born in Asia, 4.0% born in Europe, 2.3% born in North America), which is 52.7% greater than the foreign-born rate of 6.0% across the entire state of Michigan.
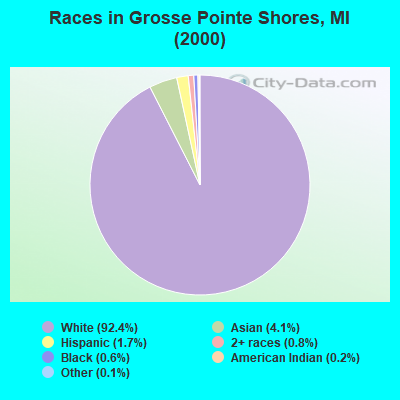
Race distribution in Grosse Pointe Shores

- 2,60892.4%White alone
- 1154.1%Asian alone
- 491.7%Hispanic
- 230.8%Two or more races
- 170.6%Black alone
- 70.2%American Indian alone
- 40.1%Other race alone
2000
2022
-
- 7,806,69178.6%White alone
- 1,402,04714.1%Black alone
- 323,8773.3%Hispanic
- 175,3111.8%Asian alone
- 163,4871.6%Two or more races
- 53,4210.5%American Indian alone
- 11,4650.1%Other race alone
- 2,1450.02%Native Hawaiian and Other
Pacific Islander alone

-
- 7,289,05172.6%White alone
- 1,310,46413.1%Black alone
- 572,4055.7%Hispanic
- 450,0314.5%Two or more races
- 335,7323.3%Asian alone
- 45,2170.5%Other race alone
- 29,0110.3%American Indian alone
- 2,2070.02%Native Hawaiian and Other
Pacific Islander alone

Income and house value in Grosse Pointe Shores
- Median household income in 2022
- $161,029White non-Hispanic householders
- $80,019Black householders
- over $200,000Asian householders
- over $200,000Some other race householders
- over $200,000Two or more races householders
- $165,557Hispanic or Latino race householders
- Median 2022 house value
- over $1,000,000White Non-Hispanic householders
- $811,590Black or African American householders
- over $1,000,000Asian householders
- over $1,000,000Some other race householders
- $781,471Two or more races householders
- over $1,000,000Hispanic or Latino householders
Household income for White non-Hispanic householders

Household income for Black householders

Household income for Asian householders

Household income for Two or more races householders

Household income for Hispanic or Latino race householders

Foreign-born residents in Grosse Pointe Shores
358 residents are foreign born (5.5% Asia, 4.0% Europe, 2.3% North America).
| This city: | 12.7% |
| Michigan: | 5.3% |
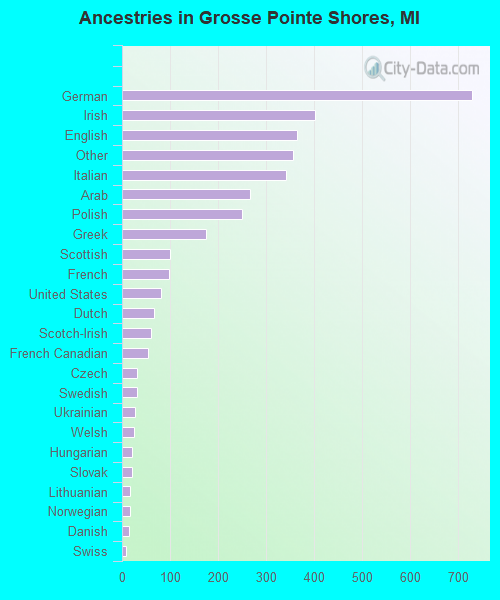
Ancestries in Grosse Pointe Shores

- 72820.5%German
- 40111.3%Irish
- 36410.2%English
- 35710.0%Other
- 3419.6%Italian
- 2667.5%Arab
- 2507.0%Polish
- 1754.9%Greek
- 992.8%Scottish
- 972.7%French
- 812.3%United States
- 661.9%Dutch
- 601.7%Scotch-Irish
- 541.5%French Canadian
- 310.9%Czech
- 310.9%Swedish
- 270.8%Ukrainian
- 260.7%Welsh
- 210.6%Hungarian
- 200.6%Slovak
- 170.5%Lithuanian
- 170.5%Norwegian
- 140.4%Danish
- 80.2%Swiss
- 30.08%Russian
Zip codes: 48236.