Races in Grosse Pointe Woods, Michigan (MI) Detailed Stats
Data:
Races - White alone (%)
Races - White alone (% change since 2000)
Races - Black alone (%)
Races - Black alone (% change since 2000)
Races - American Indian alone (%)
Races - American Indian alone (% change since 2000)
Races - Asian alone (%)
Races - Asian alone (% change since 2000)
Races - Hispanic (%)
Races - Hispanic (% change since 2000)
Races - Native Hawaiian and Other Pacific Islander alone (%)
Races - Native Hawaiian and Other Pacific Islander alone (% change since 2000)
Races - Two or more races(%)
Races - Two or more races(% change since 2000)
Races - Other race alone (%)
Races - Other race alone (% change since 2000)
Racial diversity
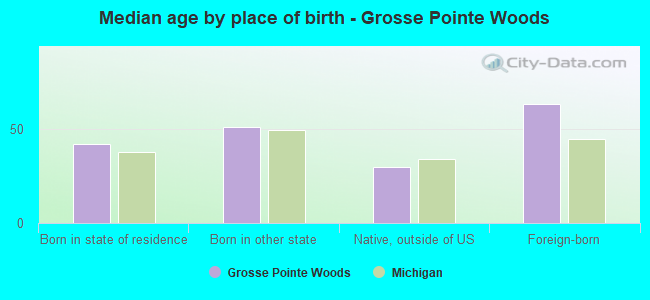
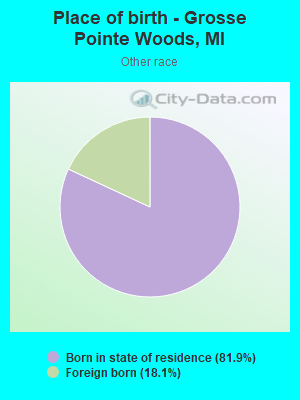
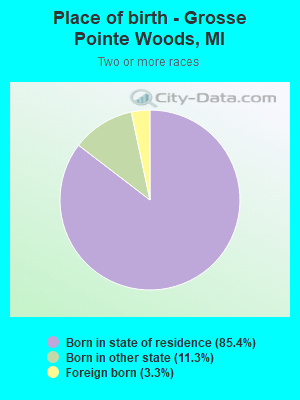
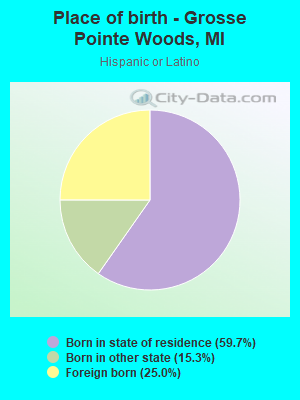
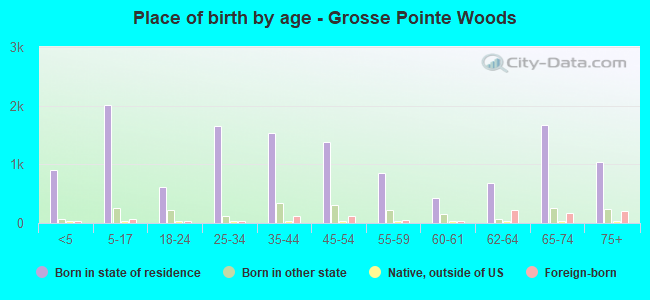
Place of birth - Born in state of residence (%)
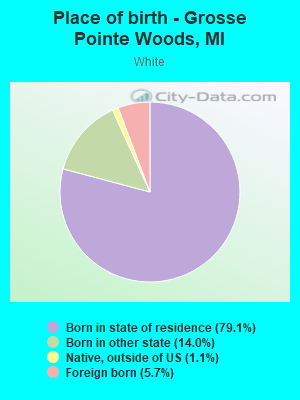
Place of birth - Born in state of residence (%) - White
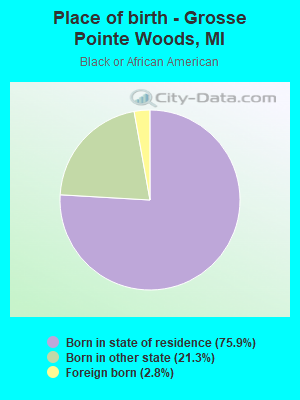
Place of birth - Born in state of residence (%) - Black or African American
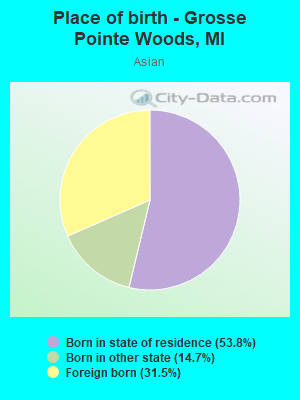
Place of birth - Born in state of residence (%) - Asian
Place of birth - Born in state of residence (%) - Hispanic or Latino
Place of birth - Born in state of residence (%) - American Indian and Alaska Native
Place of birth - Born in state of residence (%) - Multirace
Place of birth - Born in state of residence (%) - Other Race
Place of birth - Born in other state (%)
Place of birth - Born in other state (%) - White
Place of birth - Born in other state (%) - Black or African American
Place of birth - Born in other state (%) - Asian
Place of birth - Born in other state (%) - Hispanic or Latino
Place of birth - Born in other state (%) - American Indian and Alaska Native
Place of birth - Born in other state (%) - Multirace
Place of birth - Born in other state (%) - Other Race
Place of birth - Native, outside of US (%)
Place of birth - Native, outside of US (%) - White
Place of birth - Native, outside of US (%) - Black or African American
Place of birth - Native, outside of US (%) - Asian
Place of birth - Native, outside of US (%) - Hispanic or Latino
Place of birth - Native, outside of US (%) - American Indian and Alaska Native
Place of birth - Native, outside of US (%) - Multirace
Place of birth - Native, outside of US (%) - Other Race
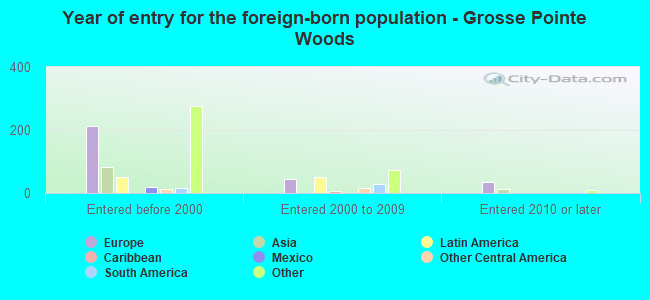
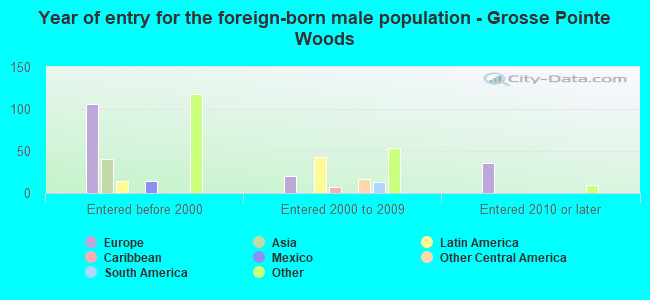
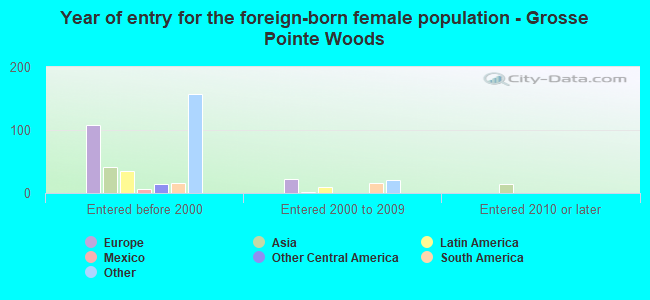
Place of birth - Foreign born (%)
Place of birth - Foreign born (%) - White
Place of birth - Foreign born (%) - Black or African American
Place of birth - Foreign born (%) - Asian
Place of birth - Foreign born (%) - Hispanic or Latino
Place of birth - Foreign born (%) - American Indian and Alaska Native
Place of birth - Foreign born (%) - Multirace
Place of birth - Foreign born (%) - Other Race
Residents speaking English at home (%)
Residents speaking English at home - Born in the United States (%)
Residents speaking English at home - Native, born elsewhere (%)
Residents speaking English at home - Foreign born (%)
Residents speaking Spanish at home (%)
Residents speaking Spanish at home - Born in the United States (%)
Residents speaking Spanish at home - Native, born elsewhere (%)
Residents speaking Spanish at home - Foreign born (%)
Residents speaking other language at home (%)
Residents speaking other language at home - Born in the United States (%)
Residents speaking other language at home - Native, born elsewhere (%)
Residents speaking other language at home - Foreign born (%)
Marital status - Never married (%)
Marital status - Now married (%)
Marital status - Separated (%)
Marital status - Widowed (%)
Marital status - Divorced (%)
Ancestries Reported - Arab (%)
Ancestries Reported - Czech (%)
Ancestries Reported - Danish (%)
Ancestries Reported - Dutch (%)
Ancestries Reported - English (%)
Ancestries Reported - French (%)
Ancestries Reported - French Canadian (%)
Ancestries Reported - German (%)
Ancestries Reported - Greek (%)
Ancestries Reported - Hungarian (%)
Ancestries Reported - Irish (%)
Ancestries Reported - Italian (%)
Ancestries Reported - Lithuanian (%)
Ancestries Reported - Norwegian (%)
Ancestries Reported - Polish (%)
Ancestries Reported - Portuguese (%)
Ancestries Reported - Russian (%)
Ancestries Reported - Scotch-Irish (%)
Ancestries Reported - Scottish (%)
Ancestries Reported - Slovak (%)
Ancestries Reported - Subsaharan African (%)
Ancestries Reported - Swedish (%)
Ancestries Reported - Swiss (%)
Ancestries Reported - Ukrainian (%)
Ancestries Reported - United States (%)
Ancestries Reported - Welsh (%)
Ancestries Reported - West Indian (%)
Ancestries Reported - Other (%)
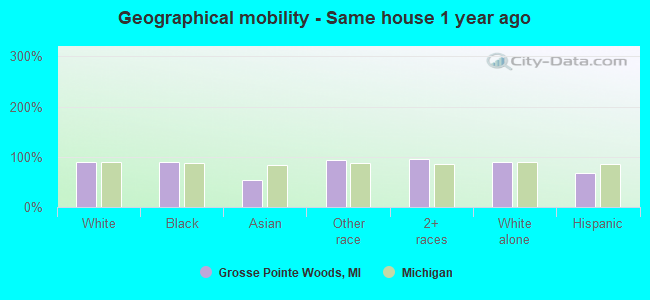
Geographical mobility - Same house 1 year ago (%)
Geographical mobility - Same house 1 year ago (%) - White
Geographical mobility - Same house 1 year ago (%) - Black or African American
Geographical mobility - Same house 1 year ago (%) - Asian
Geographical mobility - Same house 1 year ago (%) - Hispanic or Latino
Geographical mobility - Same house 1 year ago (%) - American Indian and Alaska Native
Geographical mobility - Same house 1 year ago (%) - Multirace
Geographical mobility - Same house 1 year ago (%) - Other Race
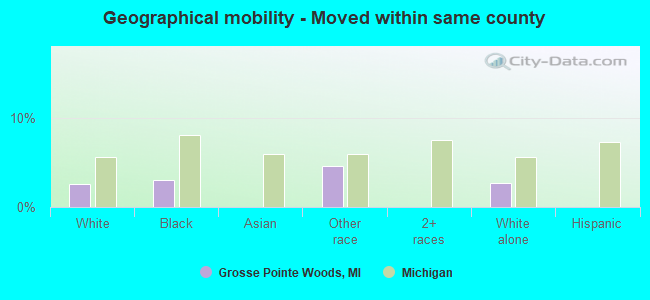
Geographical mobility - Moved within same county (%)
Geographical mobility - Moved within same county (%) - White
Geographical mobility - Moved within same county (%) - Black or African American
Geographical mobility - Moved within same county (%) - Asian
Geographical mobility - Moved within same county (%) - Hispanic or Latino
Geographical mobility - Moved within same county (%) - American Indian and Alaska Native
Geographical mobility - Moved within same county (%) - Multirace
Geographical mobility - Moved within same county (%) - Other Race
Geographical mobility - Moved from different county within same state (%)
Geographical mobility - Moved from different county within same state (%) - White
Geographical mobility - Moved from different county within same state (%) - Black or African American
Geographical mobility - Moved from different county within same state (%) - Asian
Geographical mobility - Moved from different county within same state (%) - Hispanic or Latino
Geographical mobility - Moved from different county within same state (%) - American Indian and Alaska Native
Geographical mobility - Moved from different county within same state (%) - Multirace
Geographical mobility - Moved from different county within same state (%) - Other Race
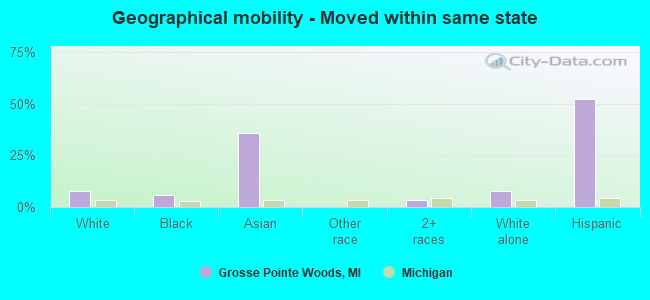
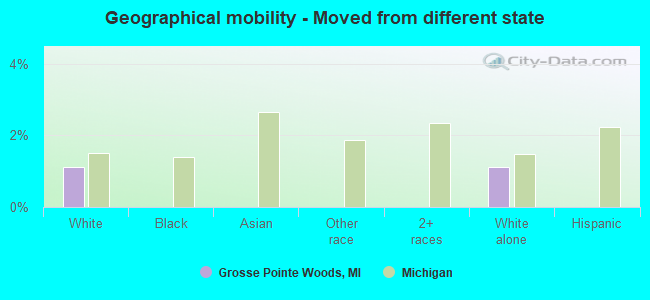
Geographical mobility - Moved from different state (%)
Geographical mobility - Moved from different state (%) - White
Geographical mobility - Moved from different state (%) - Black or African American
Geographical mobility - Moved from different state (%) - Asian
Geographical mobility - Moved from different state (%) - Hispanic or Latino
Geographical mobility - Moved from different state (%) - American Indian and Alaska Native
Geographical mobility - Moved from different state (%) - Multirace
Geographical mobility - Moved from different state (%) - Other Race
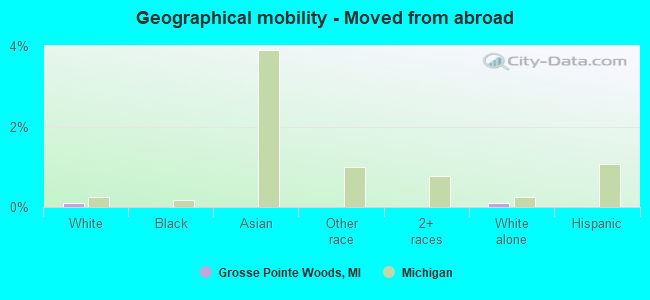
Geographical mobility - Moved from abroad (%)
Geographical mobility - Moved from abroad (%) - White
Geographical mobility - Moved from abroad (%) - Black or African American
Geographical mobility - Moved from abroad (%) - Asian
Geographical mobility - Moved from abroad (%) - Hispanic or Latino
Geographical mobility - Moved from abroad (%) - American Indian and Alaska Native
Geographical mobility - Moved from abroad (%) - Multirace
Geographical mobility - Moved from abroad (%) - Other Race
Place of birth for the foreign-born population - Ireland (%)
Place of birth for the foreign-born population - Denmark (%)
Place of birth for the foreign-born population - Norway (%)
Place of birth for the foreign-born population - Sweden (%)
Place of birth for the foreign-born population - United Kingdom (%)
Place of birth for the foreign-born population - England (%)
Place of birth for the foreign-born population - Scotland (%)
Place of birth for the foreign-born population - Other Northern Europe (%)
Place of birth for the foreign-born population - Austria (%)
Place of birth for the foreign-born population - Belgium (%)
Place of birth for the foreign-born population - France (%)
Place of birth for the foreign-born population - Germany (%)
Place of birth for the foreign-born population - Netherlands (%)
Place of birth for the foreign-born population - Switzerland (%)
Place of birth for the foreign-born population - Other Western Europe (%)
Place of birth for the foreign-born population - Greece (%)
Place of birth for the foreign-born population - Italy (%)
Place of birth for the foreign-born population - Portugal (%)
Place of birth for the foreign-born population - Spain (%)
Place of birth for the foreign-born population - Other Southern Europe (%)
Place of birth for the foreign-born population - Albania (%)
Place of birth for the foreign-born population - Belarus (%)
Place of birth for the foreign-born population - Bosnia and Herzegovina (%)
Place of birth for the foreign-born population - Bulgaria (%)
Place of birth for the foreign-born population - Croatia (%)
Place of birth for the foreign-born population - Czechoslovakia (%)
Place of birth for the foreign-born population - Hungary (%)
Place of birth for the foreign-born population - Latvia (%)
Place of birth for the foreign-born population - Lithuania (%)
Place of birth for the foreign-born population - North Macedonia (Macedonia) (%)
Place of birth for the foreign-born population - Moldova (%)
Place of birth for the foreign-born population - Poland (%)
Place of birth for the foreign-born population - Romania (%)
Place of birth for the foreign-born population - Russia (%)
Place of birth for the foreign-born population - Serbia (%)
Place of birth for the foreign-born population - Ukraine (%)
Place of birth for the foreign-born population - Other Eastern Europe (%)
Place of birth for the foreign-born population - China (%)
Place of birth for the foreign-born population - Hong Kong (%)
Place of birth for the foreign-born population - Taiwan (%)
Place of birth for the foreign-born population - Japan (%)
Place of birth for the foreign-born population - Korea (%)
Place of birth for the foreign-born population - Other Eastern Asia (%)
Place of birth for the foreign-born population - Afghanistan (%)
Place of birth for the foreign-born population - Bangladesh (%)
Place of birth for the foreign-born population - India (%)
Place of birth for the foreign-born population - Iran (%)
Place of birth for the foreign-born population - Kazakhstan (%)
Place of birth for the foreign-born population - Nepal (%)
Place of birth for the foreign-born population - Pakistan (%)
Place of birth for the foreign-born population - Sri Lanka (%)
Place of birth for the foreign-born population - Uzbekistan (%)
Place of birth for the foreign-born population - Other South Central Asia (%)
Place of birth for the foreign-born population - Burma (%)
Place of birth for the foreign-born population - Cambodia (%)
Place of birth for the foreign-born population - Indonesia (%)
Place of birth for the foreign-born population - Laos (%)
Place of birth for the foreign-born population - Malaysia (%)
Place of birth for the foreign-born population - Philippines (%)
Place of birth for the foreign-born population - Singapore (%)
Place of birth for the foreign-born population - Thailand (%)
Place of birth for the foreign-born population - Vietnam (%)
Place of birth for the foreign-born population - Other South Eastern Asia (%)
Place of birth for the foreign-born population - Armenia (%)
Place of birth for the foreign-born population - Iraq (%)
Place of birth for the foreign-born population - Israel (%)
Place of birth for the foreign-born population - Jordan (%)
Place of birth for the foreign-born population - Kuwait (%)
Place of birth for the foreign-born population - Lebanon (%)
Place of birth for the foreign-born population - Saudi Arabia (%)
Place of birth for the foreign-born population - Syria (%)
Place of birth for the foreign-born population - Turkey (%)
Place of birth for the foreign-born population - Yemen (%)
Place of birth for the foreign-born population - Other Western Asia (%)
Place of birth for the foreign-born population - Eritrea (%)
Place of birth for the foreign-born population - Ethiopia (%)
Place of birth for the foreign-born population - Kenya (%)
Place of birth for the foreign-born population - Somalia (%)
Place of birth for the foreign-born population - Uganda (%)
Place of birth for the foreign-born population - Zimbabwe (%)
Place of birth for the foreign-born population - Other Eastern Africa (%)
Place of birth for the foreign-born population - Cameroon (%)
Place of birth for the foreign-born population - Congo (%)
Place of birth for the foreign-born population - Democratic Republic of Congo (Zaire) (%)
Place of birth for the foreign-born population - Other Middle Africa (%)
Place of birth for the foreign-born population - Egypt (%)
Place of birth for the foreign-born population - Morocco (%)
Place of birth for the foreign-born population - Sudan (%)
Place of birth for the foreign-born population - Other Northern Africa (%)
Place of birth for the foreign-born population - South Africa (%)
Place of birth for the foreign-born population - Other Southern Africa (%)
Place of birth for the foreign-born population - Cabo Verde (%)
Place of birth for the foreign-born population - Ghana (%)
Place of birth for the foreign-born population - Liberia (%)
Place of birth for the foreign-born population - Nigeria (%)
Place of birth for the foreign-born population - Senegal (%)
Place of birth for the foreign-born population - Sierra Leone (%)
Place of birth for the foreign-born population - Other Western Africa (%)
Place of birth for the foreign-born population - Australia (%)
Place of birth for the foreign-born population - New Zealand (%)
Place of birth for the foreign-born population - Fiji (%)
Place of birth for the foreign-born population - Micronesia (%)
Place of birth for the foreign-born population - Bahamas (%)
Place of birth for the foreign-born population - Barbados (%)
Place of birth for the foreign-born population - Cuba (%)
Place of birth for the foreign-born population - Dominica (%)
Place of birth for the foreign-born population - Dominican Republic (%)
Place of birth for the foreign-born population - Grenada (%)
Place of birth for the foreign-born population - Haiti (%)
Place of birth for the foreign-born population - Jamaica (%)
Place of birth for the foreign-born population - St. Vincent and the Grenadines (%)
Place of birth for the foreign-born population - Trinidad and Tobago (%)
Place of birth for the foreign-born population - West Indies (%)
Place of birth for the foreign-born population - Other Caribbean (%)
Place of birth for the foreign-born population - Belize (%)
Place of birth for the foreign-born population - Costa Rica (%)
Place of birth for the foreign-born population - El Salvador (%)
Place of birth for the foreign-born population - Guatemala (%)
Place of birth for the foreign-born population - Honduras (%)
Place of birth for the foreign-born population - Mexico (%)
Place of birth for the foreign-born population - Nicaragua (%)
Place of birth for the foreign-born population - Panama (%)
Place of birth for the foreign-born population - Other Central America (%)
Place of birth for the foreign-born population - Argentina (%)
Place of birth for the foreign-born population - Bolivia (%)
Place of birth for the foreign-born population - Brazil (%)
Place of birth for the foreign-born population - Chile (%)
Place of birth for the foreign-born population - Colombia (%)
Place of birth for the foreign-born population - Ecuador (%)
Place of birth for the foreign-born population - Guyana (%)
Place of birth for the foreign-born population - Peru (%)
Place of birth for the foreign-born population - Uruguay (%)
Place of birth for the foreign-born population - Venezuela (%)
Place of birth for the foreign-born population - Other South America (%)
Place of birth for the foreign-born population - Canada (%)
Place of birth for the foreign-born population - Other Northern America (%)
Place of birth for the foreign-born population - Other (%)
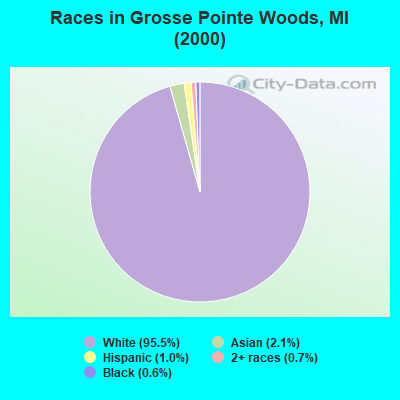
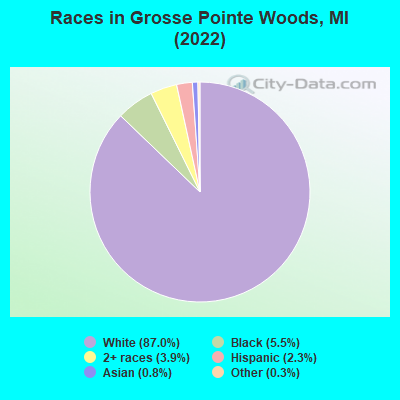
According to 2022 data, the most numerous races in Grosse Pointe Woods, MI are White alone (14,019 residents), Black alone (884 residents), and Hispanic (363 residents). 93.6% of Grosse Pointe Woods residents speak English at home. 5.7% of Grosse Pointe Woods, MI residents are foreign-born (2.2% born in North America, 1.8% born in Europe, 0.7% born in Latin America, 0.7% born in Asia), which is 5.3% less than the foreign-born rate of 6.0% across the entire state of Michigan.
Race distribution in Grosse Pointe Woods
2000 2022
7,806,691 78.6% White alone 1,402,047 14.1% Black alone 323,877 3.3% Hispanic 175,311 1.8% Asian alone 163,487 1.6% Two or more races 53,421 0.5% American Indian alone 11,465 0.1% Other race alone 2,145 0.02% Native Hawaiian and Other
7,289,051 72.6% White alone 1,310,464 13.1% Black alone 572,405 5.7% Hispanic 450,031 4.5% Two or more races 335,732 3.3% Asian alone 45,217 0.5% Other race alone 29,011 0.3% American Indian alone 2,207 0.02% Native Hawaiian and Other
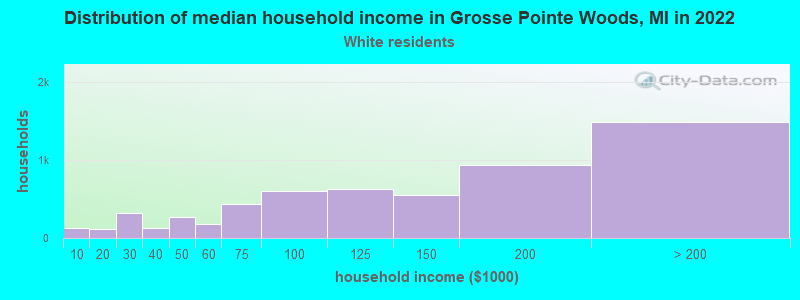
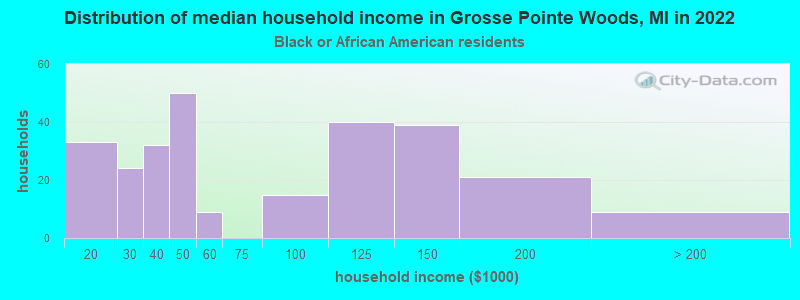
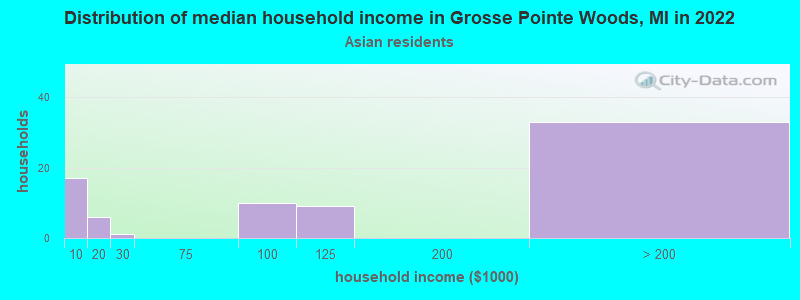
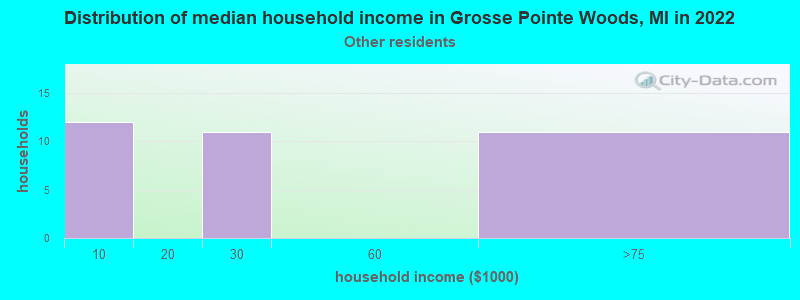
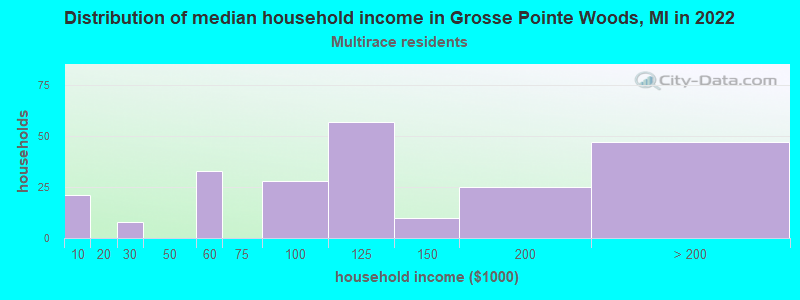
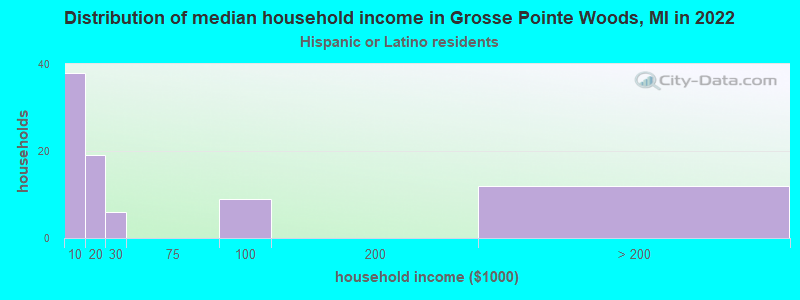
Income and house value in Grosse Pointe Woods Median household income in 2022 $126,705 White non-Hispanic householders$93,415 Two or more races householdersMedian 2022 house value $340,987 White Non-Hispanic householders$297,578 Black or African American householders$164,428 American Indian or Alaska Native householders $396,674 Asian householders$237,507 Some other race householders$338,941 Two or more races householders$249,638 Hispanic or Latino householders
Median age by race in Grosse Pointe Woods
46.1 Median age for White residents46.5 45.9 41.8 Median age for Black or African American residents37.0 46.9 -738,693,466.6 Median age for American Indian / Alaska Native residents-795,074,757.3 -684,380,031.5 42.3 Median age for Asian residents54.0 17.3 -934,108,526.2 Median age for Native Hawaiian / Pacific Islander residents-674,772,035.8 -699,588,476.7 69.5 Median age for Other race residents70.8 -709,523,808.8 32.1 Median age for Two or more races residents38.0 26.9 45.7 Median age for White alone residents46.2 45.5 31.8 Median age for Hispanic or Latino residents33.8 5.7
Owner/renter occupied households by race in Grosse Pointe Woods
House owners and renters - White residents 5,443 91.9% Owner occupied478 8.1% Renter occupiedHouse owners and renters - Black or African American residents 193 69.2% Owner occupied86 30.8% Renter occupiedHouse owners and renters - Asian residents 56 68.2% Owner occupied26 31.8% Renter occupiedHouse owners and renters - Other race residents 24 72.3% Owner occupied9 27.7% Renter occupiedHouse owners and renters - Two or more races residents 191 81.0% Owner occupied45 19.0% Renter occupiedHouse owners and renters - White alone residents 5,456 91.8% Owner occupied486 8.2% Renter occupiedHouse owners and renters - Hispanic or Latino residents 51 64.6% Owner occupied28 35.4% Renter occupied
Language usage in Grosse Pointe Woods
English speakers - Total 93.6% of residents of Grosse Pointe Woods speak English at home.
1.1% of residents speak Spanish at home 109 68.1% Speak English very well51 31.9% Speak English less than very well4.8% of residents speak other language at home 630 87.6% Speak English very well89 12.4% Speak English less than very well
English speakers - Born in the United States 94.2% of residents of Grosse Pointe Woods speak English at home.
1.6% of residents speak Spanish at home 36 100.0% Speak English very well3.3% of residents speak other language at home 64 87.7% Speak English very well9 12.3% Speak English less than very well
English speakers - Native, born elsewhere 89.4% of residents of Grosse Pointe Woods speak English at home.
18.9% of residents speak other language at home 17 68.0% Speak English very well8 32.0% Speak English less than very well
English speakers - Foreign-born 48.7% of residents of Grosse Pointe Woods speak English at home.
6.6% of residents speak Spanish at home 32 51.6% Speak English very well30 48.4% Speak English less than very well38.6% of residents speak other language at home 340 93.7% Speak English very well23 6.3% Speak English less than very well
White (Caucasian) - Speak only English Native:
97.8% (11,925)Foreign-born:
51.7% (412)
White (Caucasian) - Speak another language Native:
2.9% (359)Foreign-born:
49.1% (391)
Black or African American - Speak only English Native:
97.4% (833)Foreign-born:
100.0% (25)
Asian - Speak only English Native:
84.2% (70)Foreign-born:
18.5% (14)
Asian - Speak another language Native:
11.1% (9)Foreign-born:
82.2% (61)
Two or more races - Speak only English Native:
94.0% (646)Foreign-born:
44.6% (12)
Two or more races - Speak another language Native:
4.4% (30)Foreign-born:
47.2% (13)
White alone - Speak only English Native:
97.4% (11,993)Foreign-born:
51.4% (401)
White alone - Speak another language Native:
3.0% (368)Foreign-born:
47.4% (369)
Hispanic or Latino - Speak only English Native:
77.5% (118)Foreign-born:
25.5% (23)
Hispanic or Latino - Speak another language Native:
21.6% (33)Foreign-born:
69.4% (63)
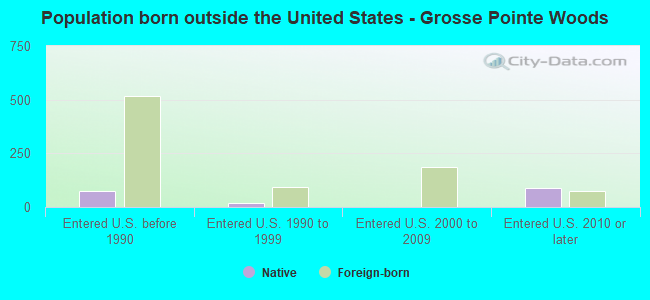
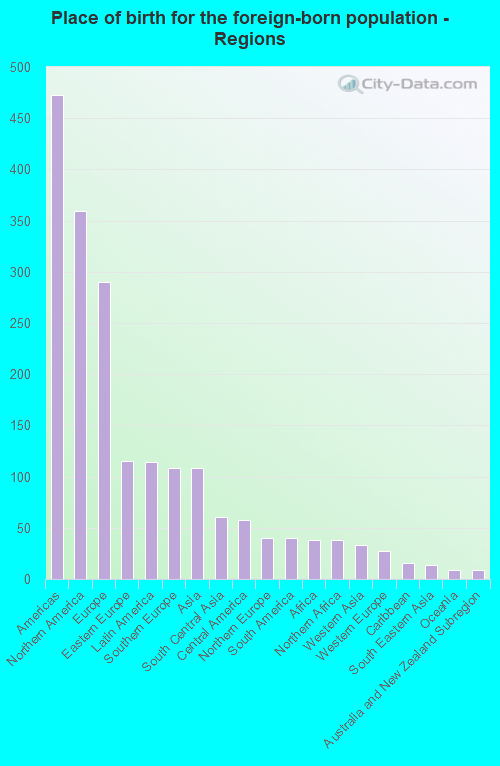
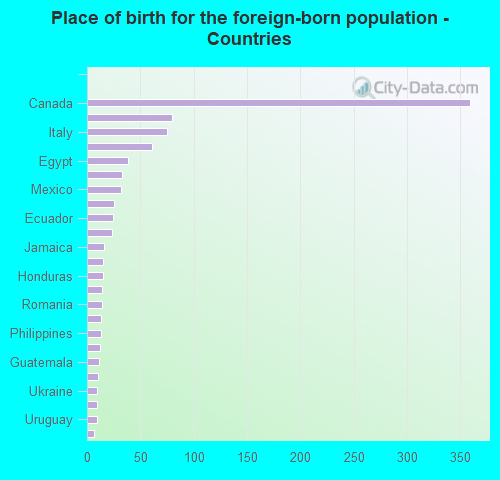
Foreign-born residents in Grosse Pointe Woods 918 residents are foreign born (2.2% North America , 1.8% Europe , 0.7% Latin America , 0.7% Asia ).
This city:
5.7%Michigan:
6.9%
Marital status for residents in Grosse Pointe Woods Marital status - White (Caucasian) population 15 years and over
Males 27.3% Never married64.5% Now married0.2% Separated3.1% Widowed4.9% DivorcedFemales 22.7% Never married57.9% Now married1.2% Separated9.0% Widowed9.2% DivorcedWomen who gave birth in the past 12 months Now married:
100.0% (103)Unmarried:
0.0% (0)
Women who did not give birth in the past 12 months Now married:
54.7% (1,440)Unmarried:
45.3% (1,193)
Marital status - Black or African American population 15 years and over
Males 47.2% Never married37.9% Now married4.5% Separated0.0% Widowed10.4% DivorcedFemales 58.4% Never married14.4% Now married1.5% Separated1.1% Widowed24.5% DivorcedWomen who did not give birth in the past 12 months Now married:
6.3% (17)Unmarried:
93.7% (253)
Marital status - Asian population 15 years and over
Males 13.0% Never married71.4% Now married0.0% Separated15.6% Widowed0.0% DivorcedFemales 12.2% Never married85.1% Now married0.0% Separated1.4% Widowed1.4% DivorcedWomen who did not give birth in the past 12 months Now married:
84.3% (42)Unmarried:
15.7% (8)
Marital status - Other race population 15 years and over
Males 70.5% Never married29.5% Now married0.0% Separated0.0% Widowed0.0% DivorcedFemales 0.0% Never married100.0% Now married0.0% Separated0.0% Widowed0.0% DivorcedMarital status - Two or more races population 15 years and over
Males 27.5% Never married72.5% Now married0.0% Separated0.0% Widowed0.0% DivorcedFemales 50.2% Never married43.3% Now married0.0% Separated6.4% Widowed0.0% DivorcedWomen who did not give birth in the past 12 months Now married:
33.8% (73)Unmarried:
66.2% (143)
Marital status - White alone, not Hispanic / Latino population 15 years and over
Males 27.1% Never married65.0% Now married0.2% Separated3.1% Widowed4.7% DivorcedFemales 22.7% Never married57.9% Now married1.2% Separated8.9% Widowed9.2% DivorcedWomen who gave birth in the past 12 months Now married:
100.0% (105)Unmarried:
0.0% (0)
Women who did not give birth in the past 12 months Now married:
54.7% (1,462)Unmarried:
45.3% (1,210)
Marital status - Hispanic or Latino population 15 years and over
Males 52.5% Never married37.6% Now married0.0% Separated0.0% Widowed9.9% DivorcedFemales 11.4% Never married53.2% Now married0.0% Separated35.4% Widowed0.0% DivorcedWomen who did not give birth in the past 12 months Now married:
74.3% (27)Unmarried:
25.7% (9)
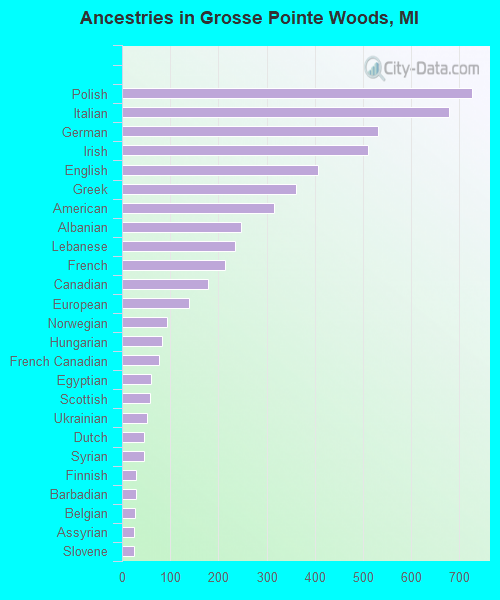
Ancestries in Grosse Pointe Woods
725 11.5% Polish678 10.8% Italian530 8.4% German511 8.1% Irish406 6.5% English361 5.7% Greek315 5.0% American246 3.9% Albanian234 3.7% Lebanese214 3.4% French179 2.8% Canadian138 2.2% European94 1.5% Norwegian83 1.3% Hungarian76 1.2% French Canadian60 1.0% Egyptian59 0.9% Scottish51 0.8% Ukrainian46 0.7% Dutch45 0.7% Syrian29 0.5% Finnish29 0.5% Barbadian26 0.4% Belgian25 0.4% Assyrian24 0.4% Slovene23 0.4% Jamaican22 0.3% Northern European22 0.3% Scotch-Irish20 0.3% Swiss18 0.3% Macedonian15 0.2% British15 0.2% Romanian15 0.2% African14 0.2% Croatian13 0.2% Serbian13 0.2% Swedish12 0.2% Armenian11 0.2% Arab9 0.1% Czech9 0.1% Austrian8 0.1% Lithuanian8 0.1% Russian4 0.06% Czechoslovakian3 0.05% Eastern European
Children Nativity (place of birth) in Grosse Pointe Woods
Children under 6 years - Living with two parents Both parents native 1,184 100.0% NativeOne native, one foreign-born parent 75 100.0% NativeChildren under 6 years - Living with one parent Native parent 99 100.0% NativeForeign-born parent 10 100.0% NativeChildren 6 to 17 years - Living with two parents Both parents native 1,462 98.4% Native23 1.6% Foreign-bornBoth parents foreign-born 50 65.4% Native26 34.6% Foreign-bornOne native, one foreign-born parent 104 100.0% NativeChildren 6 to 17 years - Living with one parent Native parent 311 97.7% Native7 2.3% Foreign-bornForeign-born parent 11 51.4% Native11 48.6% Foreign-born