Races in Grove City, Pennsylvania (PA) Detailed Stats
Data:
Races - White alone (%)
Races - White alone (% change since 2000)
Races - Black alone (%)
Races - Black alone (% change since 2000)
Races - American Indian alone (%)
Races - American Indian alone (% change since 2000)
Races - Asian alone (%)
Races - Asian alone (% change since 2000)
Races - Hispanic (%)
Races - Hispanic (% change since 2000)
Races - Native Hawaiian and Other Pacific Islander alone (%)
Races - Native Hawaiian and Other Pacific Islander alone (% change since 2000)
Races - Two or more races(%)
Races - Two or more races(% change since 2000)
Races - Other race alone (%)
Races - Other race alone (% change since 2000)
Racial diversity
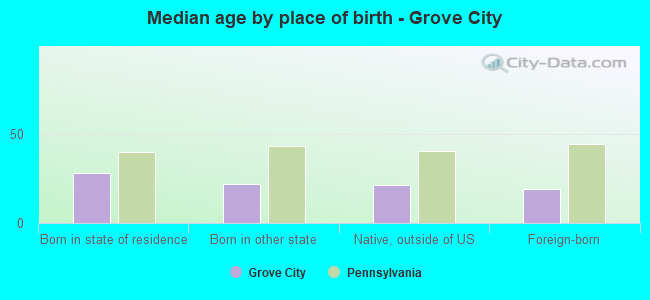
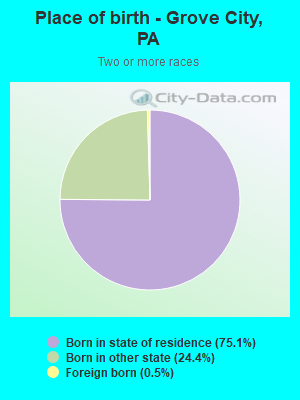
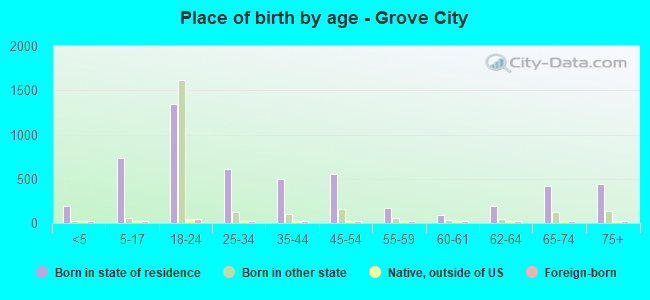
Place of birth - Born in state of residence (%)
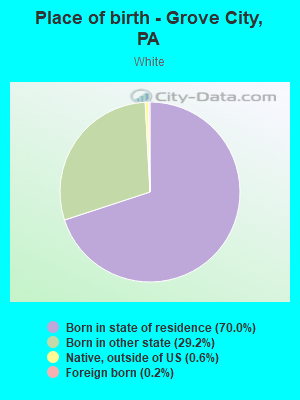
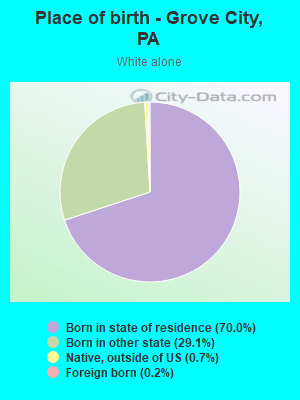
Place of birth - Born in state of residence (%) - White
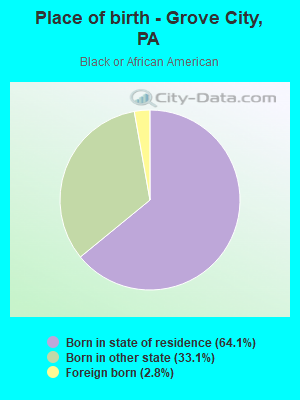
Place of birth - Born in state of residence (%) - Black or African American
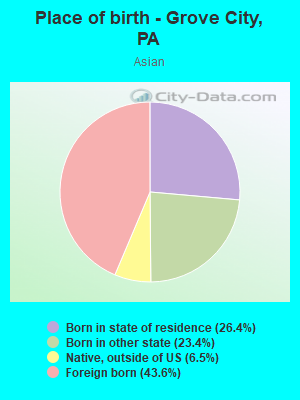
Place of birth - Born in state of residence (%) - Asian
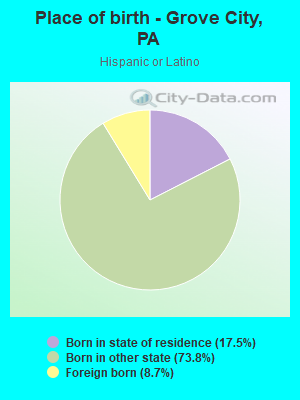
Place of birth - Born in state of residence (%) - Hispanic or Latino
Place of birth - Born in state of residence (%) - American Indian and Alaska Native
Place of birth - Born in state of residence (%) - Multirace
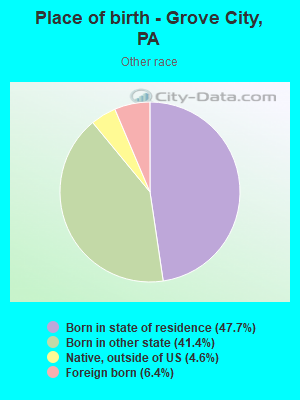
Place of birth - Born in state of residence (%) - Other Race
Place of birth - Born in other state (%)
Place of birth - Born in other state (%) - White
Place of birth - Born in other state (%) - Black or African American
Place of birth - Born in other state (%) - Asian
Place of birth - Born in other state (%) - Hispanic or Latino
Place of birth - Born in other state (%) - American Indian and Alaska Native
Place of birth - Born in other state (%) - Multirace
Place of birth - Born in other state (%) - Other Race
Place of birth - Native, outside of US (%)
Place of birth - Native, outside of US (%) - White
Place of birth - Native, outside of US (%) - Black or African American
Place of birth - Native, outside of US (%) - Asian
Place of birth - Native, outside of US (%) - Hispanic or Latino
Place of birth - Native, outside of US (%) - American Indian and Alaska Native
Place of birth - Native, outside of US (%) - Multirace
Place of birth - Native, outside of US (%) - Other Race
Place of birth - Foreign born (%)
Place of birth - Foreign born (%) - White
Place of birth - Foreign born (%) - Black or African American
Place of birth - Foreign born (%) - Asian
Place of birth - Foreign born (%) - Hispanic or Latino
Place of birth - Foreign born (%) - American Indian and Alaska Native
Place of birth - Foreign born (%) - Multirace
Place of birth - Foreign born (%) - Other Race
Residents speaking English at home (%)
Residents speaking English at home - Born in the United States (%)
Residents speaking English at home - Native, born elsewhere (%)
Residents speaking English at home - Foreign born (%)
Residents speaking Spanish at home (%)
Residents speaking Spanish at home - Born in the United States (%)
Residents speaking Spanish at home - Native, born elsewhere (%)
Residents speaking Spanish at home - Foreign born (%)
Residents speaking other language at home (%)
Residents speaking other language at home - Born in the United States (%)
Residents speaking other language at home - Native, born elsewhere (%)
Residents speaking other language at home - Foreign born (%)
Marital status - Never married (%)
Marital status - Now married (%)
Marital status - Separated (%)
Marital status - Widowed (%)
Marital status - Divorced (%)
Ancestries Reported - Arab (%)
Ancestries Reported - Czech (%)
Ancestries Reported - Danish (%)
Ancestries Reported - Dutch (%)
Ancestries Reported - English (%)
Ancestries Reported - French (%)
Ancestries Reported - French Canadian (%)
Ancestries Reported - German (%)
Ancestries Reported - Greek (%)
Ancestries Reported - Hungarian (%)
Ancestries Reported - Irish (%)
Ancestries Reported - Italian (%)
Ancestries Reported - Lithuanian (%)
Ancestries Reported - Norwegian (%)
Ancestries Reported - Polish (%)
Ancestries Reported - Portuguese (%)
Ancestries Reported - Russian (%)
Ancestries Reported - Scotch-Irish (%)
Ancestries Reported - Scottish (%)
Ancestries Reported - Slovak (%)
Ancestries Reported - Subsaharan African (%)
Ancestries Reported - Swedish (%)
Ancestries Reported - Swiss (%)
Ancestries Reported - Ukrainian (%)
Ancestries Reported - United States (%)
Ancestries Reported - Welsh (%)
Ancestries Reported - West Indian (%)
Ancestries Reported - Other (%)
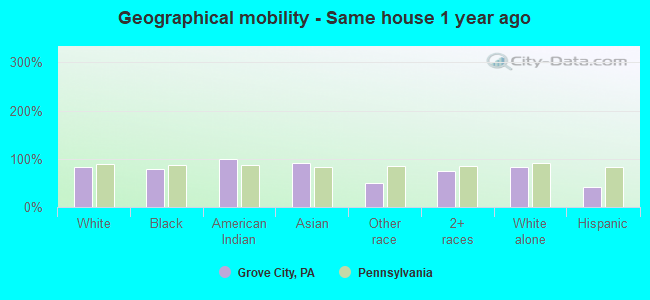
Geographical mobility - Same house 1 year ago (%)
Geographical mobility - Same house 1 year ago (%) - White
Geographical mobility - Same house 1 year ago (%) - Black or African American
Geographical mobility - Same house 1 year ago (%) - Asian
Geographical mobility - Same house 1 year ago (%) - Hispanic or Latino
Geographical mobility - Same house 1 year ago (%) - American Indian and Alaska Native
Geographical mobility - Same house 1 year ago (%) - Multirace
Geographical mobility - Same house 1 year ago (%) - Other Race
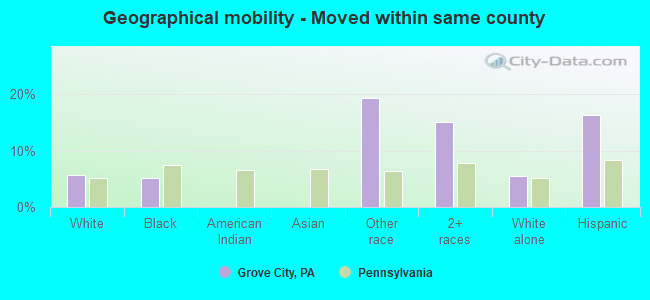
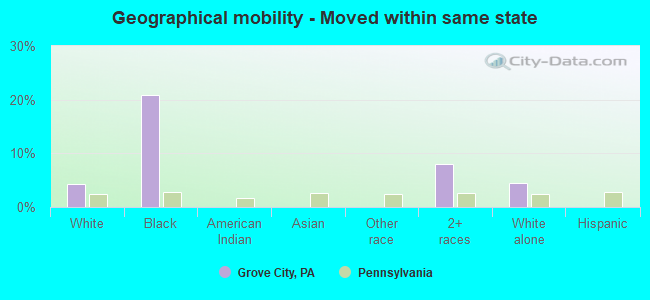
Geographical mobility - Moved within same county (%)
Geographical mobility - Moved within same county (%) - White
Geographical mobility - Moved within same county (%) - Black or African American
Geographical mobility - Moved within same county (%) - Asian
Geographical mobility - Moved within same county (%) - Hispanic or Latino
Geographical mobility - Moved within same county (%) - American Indian and Alaska Native
Geographical mobility - Moved within same county (%) - Multirace
Geographical mobility - Moved within same county (%) - Other Race
Geographical mobility - Moved from different county within same state (%)
Geographical mobility - Moved from different county within same state (%) - White
Geographical mobility - Moved from different county within same state (%) - Black or African American
Geographical mobility - Moved from different county within same state (%) - Asian
Geographical mobility - Moved from different county within same state (%) - Hispanic or Latino
Geographical mobility - Moved from different county within same state (%) - American Indian and Alaska Native
Geographical mobility - Moved from different county within same state (%) - Multirace
Geographical mobility - Moved from different county within same state (%) - Other Race
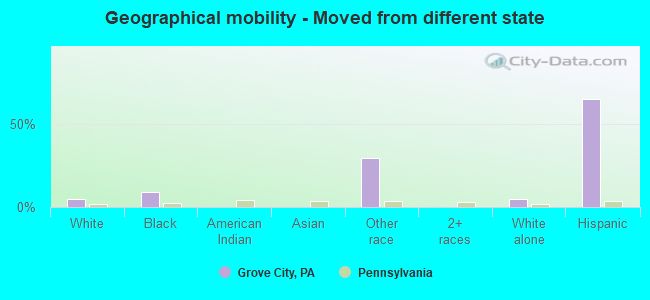
Geographical mobility - Moved from different state (%)
Geographical mobility - Moved from different state (%) - White
Geographical mobility - Moved from different state (%) - Black or African American
Geographical mobility - Moved from different state (%) - Asian
Geographical mobility - Moved from different state (%) - Hispanic or Latino
Geographical mobility - Moved from different state (%) - American Indian and Alaska Native
Geographical mobility - Moved from different state (%) - Multirace
Geographical mobility - Moved from different state (%) - Other Race
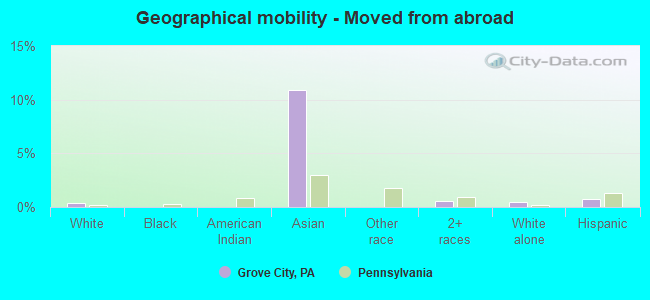
Geographical mobility - Moved from abroad (%)
Geographical mobility - Moved from abroad (%) - White
Geographical mobility - Moved from abroad (%) - Black or African American
Geographical mobility - Moved from abroad (%) - Asian
Geographical mobility - Moved from abroad (%) - Hispanic or Latino
Geographical mobility - Moved from abroad (%) - American Indian and Alaska Native
Geographical mobility - Moved from abroad (%) - Multirace
Geographical mobility - Moved from abroad (%) - Other Race
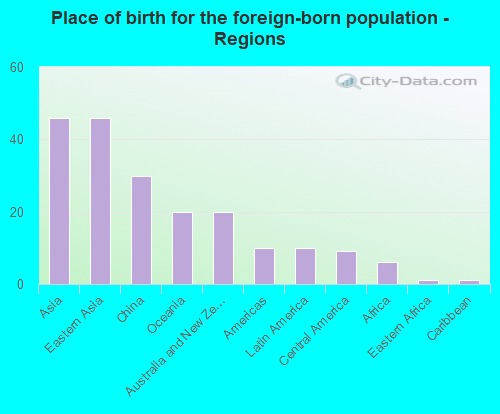
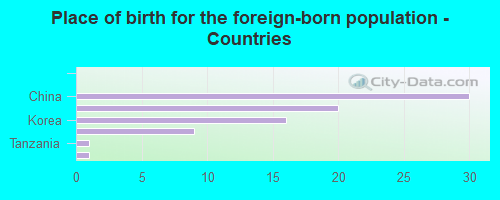
Place of birth for the foreign-born population - Ireland (%)
Place of birth for the foreign-born population - Denmark (%)
Place of birth for the foreign-born population - Norway (%)
Place of birth for the foreign-born population - Sweden (%)
Place of birth for the foreign-born population - United Kingdom (%)
Place of birth for the foreign-born population - England (%)
Place of birth for the foreign-born population - Scotland (%)
Place of birth for the foreign-born population - Other Northern Europe (%)
Place of birth for the foreign-born population - Austria (%)
Place of birth for the foreign-born population - Belgium (%)
Place of birth for the foreign-born population - France (%)
Place of birth for the foreign-born population - Germany (%)
Place of birth for the foreign-born population - Netherlands (%)
Place of birth for the foreign-born population - Switzerland (%)
Place of birth for the foreign-born population - Other Western Europe (%)
Place of birth for the foreign-born population - Greece (%)
Place of birth for the foreign-born population - Italy (%)
Place of birth for the foreign-born population - Portugal (%)
Place of birth for the foreign-born population - Spain (%)
Place of birth for the foreign-born population - Other Southern Europe (%)
Place of birth for the foreign-born population - Albania (%)
Place of birth for the foreign-born population - Belarus (%)
Place of birth for the foreign-born population - Bosnia and Herzegovina (%)
Place of birth for the foreign-born population - Bulgaria (%)
Place of birth for the foreign-born population - Croatia (%)
Place of birth for the foreign-born population - Czechoslovakia (%)
Place of birth for the foreign-born population - Hungary (%)
Place of birth for the foreign-born population - Latvia (%)
Place of birth for the foreign-born population - Lithuania (%)
Place of birth for the foreign-born population - North Macedonia (Macedonia) (%)
Place of birth for the foreign-born population - Moldova (%)
Place of birth for the foreign-born population - Poland (%)
Place of birth for the foreign-born population - Romania (%)
Place of birth for the foreign-born population - Russia (%)
Place of birth for the foreign-born population - Serbia (%)
Place of birth for the foreign-born population - Ukraine (%)
Place of birth for the foreign-born population - Other Eastern Europe (%)
Place of birth for the foreign-born population - China (%)
Place of birth for the foreign-born population - Hong Kong (%)
Place of birth for the foreign-born population - Taiwan (%)
Place of birth for the foreign-born population - Japan (%)
Place of birth for the foreign-born population - Korea (%)
Place of birth for the foreign-born population - Other Eastern Asia (%)
Place of birth for the foreign-born population - Afghanistan (%)
Place of birth for the foreign-born population - Bangladesh (%)
Place of birth for the foreign-born population - India (%)
Place of birth for the foreign-born population - Iran (%)
Place of birth for the foreign-born population - Kazakhstan (%)
Place of birth for the foreign-born population - Nepal (%)
Place of birth for the foreign-born population - Pakistan (%)
Place of birth for the foreign-born population - Sri Lanka (%)
Place of birth for the foreign-born population - Uzbekistan (%)
Place of birth for the foreign-born population - Other South Central Asia (%)
Place of birth for the foreign-born population - Burma (%)
Place of birth for the foreign-born population - Cambodia (%)
Place of birth for the foreign-born population - Indonesia (%)
Place of birth for the foreign-born population - Laos (%)
Place of birth for the foreign-born population - Malaysia (%)
Place of birth for the foreign-born population - Philippines (%)
Place of birth for the foreign-born population - Singapore (%)
Place of birth for the foreign-born population - Thailand (%)
Place of birth for the foreign-born population - Vietnam (%)
Place of birth for the foreign-born population - Other South Eastern Asia (%)
Place of birth for the foreign-born population - Armenia (%)
Place of birth for the foreign-born population - Iraq (%)
Place of birth for the foreign-born population - Israel (%)
Place of birth for the foreign-born population - Jordan (%)
Place of birth for the foreign-born population - Kuwait (%)
Place of birth for the foreign-born population - Lebanon (%)
Place of birth for the foreign-born population - Saudi Arabia (%)
Place of birth for the foreign-born population - Syria (%)
Place of birth for the foreign-born population - Turkey (%)
Place of birth for the foreign-born population - Yemen (%)
Place of birth for the foreign-born population - Other Western Asia (%)
Place of birth for the foreign-born population - Eritrea (%)
Place of birth for the foreign-born population - Ethiopia (%)
Place of birth for the foreign-born population - Kenya (%)
Place of birth for the foreign-born population - Somalia (%)
Place of birth for the foreign-born population - Uganda (%)
Place of birth for the foreign-born population - Zimbabwe (%)
Place of birth for the foreign-born population - Other Eastern Africa (%)
Place of birth for the foreign-born population - Cameroon (%)
Place of birth for the foreign-born population - Congo (%)
Place of birth for the foreign-born population - Democratic Republic of Congo (Zaire) (%)
Place of birth for the foreign-born population - Other Middle Africa (%)
Place of birth for the foreign-born population - Egypt (%)
Place of birth for the foreign-born population - Morocco (%)
Place of birth for the foreign-born population - Sudan (%)
Place of birth for the foreign-born population - Other Northern Africa (%)
Place of birth for the foreign-born population - South Africa (%)
Place of birth for the foreign-born population - Other Southern Africa (%)
Place of birth for the foreign-born population - Cabo Verde (%)
Place of birth for the foreign-born population - Ghana (%)
Place of birth for the foreign-born population - Liberia (%)
Place of birth for the foreign-born population - Nigeria (%)
Place of birth for the foreign-born population - Senegal (%)
Place of birth for the foreign-born population - Sierra Leone (%)
Place of birth for the foreign-born population - Other Western Africa (%)
Place of birth for the foreign-born population - Australia (%)
Place of birth for the foreign-born population - New Zealand (%)
Place of birth for the foreign-born population - Fiji (%)
Place of birth for the foreign-born population - Micronesia (%)
Place of birth for the foreign-born population - Bahamas (%)
Place of birth for the foreign-born population - Barbados (%)
Place of birth for the foreign-born population - Cuba (%)
Place of birth for the foreign-born population - Dominica (%)
Place of birth for the foreign-born population - Dominican Republic (%)
Place of birth for the foreign-born population - Grenada (%)
Place of birth for the foreign-born population - Haiti (%)
Place of birth for the foreign-born population - Jamaica (%)
Place of birth for the foreign-born population - St. Vincent and the Grenadines (%)
Place of birth for the foreign-born population - Trinidad and Tobago (%)
Place of birth for the foreign-born population - West Indies (%)
Place of birth for the foreign-born population - Other Caribbean (%)
Place of birth for the foreign-born population - Belize (%)
Place of birth for the foreign-born population - Costa Rica (%)
Place of birth for the foreign-born population - El Salvador (%)
Place of birth for the foreign-born population - Guatemala (%)
Place of birth for the foreign-born population - Honduras (%)
Place of birth for the foreign-born population - Mexico (%)
Place of birth for the foreign-born population - Nicaragua (%)
Place of birth for the foreign-born population - Panama (%)
Place of birth for the foreign-born population - Other Central America (%)
Place of birth for the foreign-born population - Argentina (%)
Place of birth for the foreign-born population - Bolivia (%)
Place of birth for the foreign-born population - Brazil (%)
Place of birth for the foreign-born population - Chile (%)
Place of birth for the foreign-born population - Colombia (%)
Place of birth for the foreign-born population - Ecuador (%)
Place of birth for the foreign-born population - Guyana (%)
Place of birth for the foreign-born population - Peru (%)
Place of birth for the foreign-born population - Uruguay (%)
Place of birth for the foreign-born population - Venezuela (%)
Place of birth for the foreign-born population - Other South America (%)
Place of birth for the foreign-born population - Canada (%)
Place of birth for the foreign-born population - Other Northern America (%)
Place of birth for the foreign-born population - Other (%)
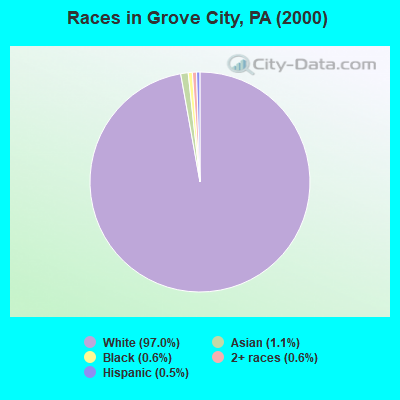
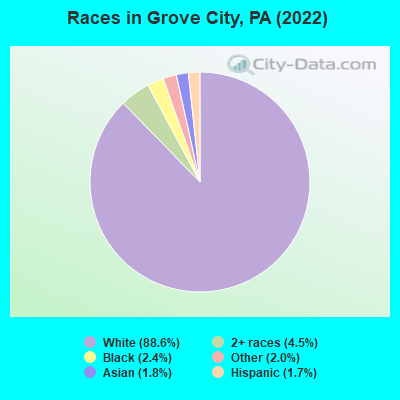
According to 2022 data, the most numerous races in Grove City, PA are White alone (6,920 residents), Black alone (189 residents), and Hispanic (131 residents). 97.1% of Grove City residents speak English at home. 1.1% of Grove City, PA residents are foreign-born , which is 550.7% less than the foreign-born rate of 7.0% across the entire state of Pennsylvania.
Race distribution in Grove City
2000 2022
10,322,455 84.1% White alone 1,202,437 9.8% Black alone 394,088 3.2% Hispanic 218,296 1.8% Asian alone 113,097 0.9% Two or more races 13,086 0.1% Other race alone 14,904 0.1% American Indian alone 2,691 0.02% Native Hawaiian and Other
9,487,228 73.1% White alone 1,311,581 10.1% Black alone 1,115,997 8.6% Hispanic 493,942 3.8% Two or more races 487,124 3.8% Asian alone 63,582 0.5% Other race alone 10,130 0.08% American Indian alone 2,424 0.02% Native Hawaiian and Other
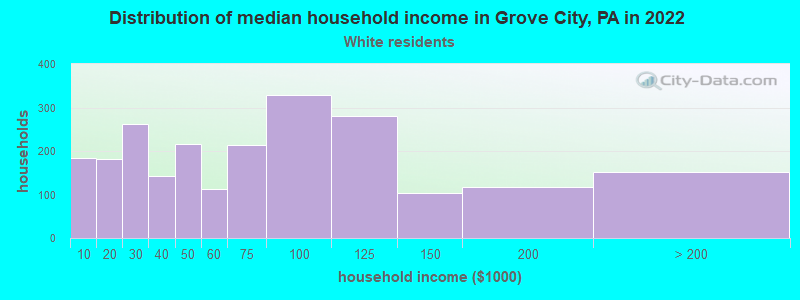
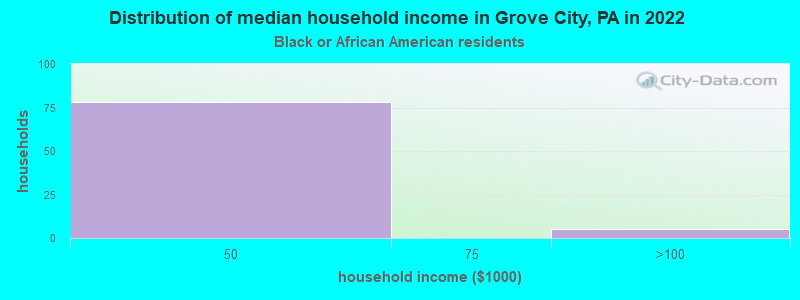
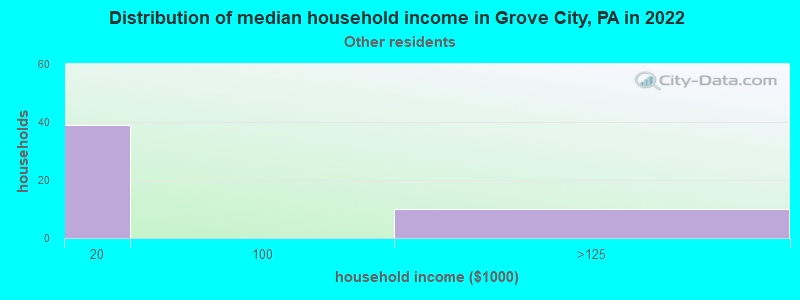
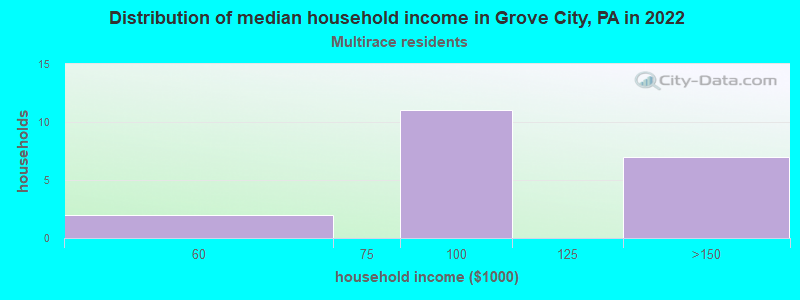
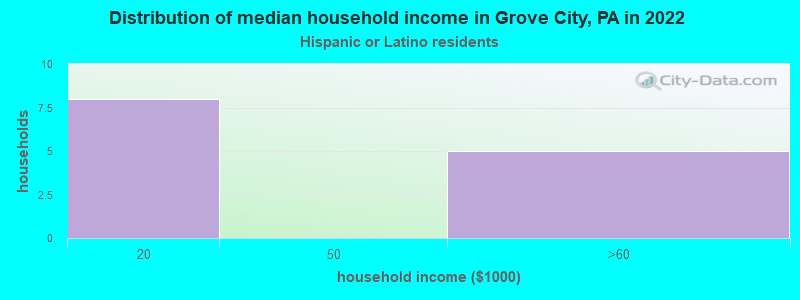
Income and house value in Grove City Median household income in 2022 $62,583 White non-Hispanic householders$60,220 Black householders$80,554 Two or more races householdersMedian 2022 house value $169,718 White Non-Hispanic householders $130,707 Asian householders$45,244 Two or more races householders$170,925 Hispanic or Latino householders
Median age by race in Grove City
25.4 Median age for White residents22.8 31.1 19.6 Median age for Black or African American residents23.7 19.2 -809,427,608.6 Median age for American Indian / Alaska Native residents-714,583,332.6 -669,972,451.1 20.5 Median age for Asian residents20.2 62.5 -680,432,644.4 Median age for Native Hawaiian / Pacific Islander residents-666,666,666.0 -747,474,746.7 28.3 Median age for Other race residents21.1 28.6 31.5 Median age for Two or more races residents40.4 41.0 25.8 Median age for White alone residents22.7 32.6 21.9 Median age for Hispanic or Latino residents33.8 21.0
Owner/renter occupied households by race in Grove City
House owners and renters - White residents 1,360 60.8% Owner occupied878 39.2% Renter occupiedHouse owners and renters - Black or African American residents 65 100.0% Renter occupiedHouse owners and renters - Asian residents 13 100.0% Renter occupiedHouse owners and renters - Other race residents 11 19.2% Owner occupied45 80.8% Renter occupiedHouse owners and renters - Two or more races residents 25 100.0% Owner occupiedHouse owners and renters - White alone residents 1,362 60.9% Owner occupied875 39.1% Renter occupiedHouse owners and renters - Hispanic or Latino residents 14 100.0% Renter occupied
Language usage in Grove City
English speakers - Total 97.1% of residents of Grove City speak English at home.
1.2% of residents speak Spanish at home 24 26.1% Speak English very well68 73.9% Speak English less than very well1.3% of residents speak other language at home 74 74.7% Speak English very well25 25.3% Speak English less than very well
English speakers - Born in the United States 97.3% of residents of Grove City speak English at home.
2.2% of residents speak Spanish at home 9 18.4% Speak English very well40 81.6% Speak English less than very well1.6% of residents speak other language at home 36 100.0% Speak English very well
English speakers - Native, born elsewhere 76.2% of residents of Grove City speak English at home.
English speakers - Foreign-born 73.8% of residents of Grove City speak English at home.
12.5% of residents speak Spanish at home 1 10.0% Speak English very well9 90.0% Speak English less than very well12.5% of residents speak other language at home 10 100.0% Speak English less than very well
White (Caucasian) - Speak only English Native:
98.5% (6,677)Foreign-born:
83.6% (13)
Black or African American - Speak only English Native:
100.0% (205)Foreign-born:
78.3% (5)
Asian - Speak only English Native:
34.6% (21)Foreign-born:
78.5% (36)
Asian - Speak another language Native:
66.1% (40)Foreign-born:
22.2% (10)
Other race - Speak another language Native:
18.6% (25)Foreign-born:
100.0% (11)
Two or more races - Speak another language Native:
10.4% (34)Foreign-born:
100.0% (2)
White alone - Speak only English Native:
98.4% (6,642)Foreign-born:
81.4% (13)
Hispanic or Latino - Speak another language Native:
26.5% (22)Foreign-born:
100.0% (11)
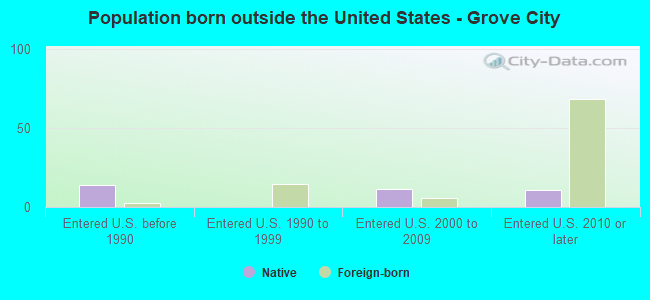
Foreign-born residents in Grove City 84 residents are foreign born
This city:
1.1%Pennsylvania:
7.3%
Marital status for residents in Grove City Marital status - White (Caucasian) population 15 years and over
Males 58.2% Never married31.7% Now married1.0% Separated0.9% Widowed8.2% DivorcedFemales 46.1% Never married33.6% Now married0.9% Separated10.4% Widowed9.0% DivorcedWomen who gave birth in the past 12 months Now married:
53.2% (24)Unmarried:
46.8% (21)
Women who did not give birth in the past 12 months Now married:
27.0% (543)Unmarried:
73.0% (1,469)
Marital status - Black or African American population 15 years and over
Males 100.0% Never married0.0% Now married0.0% Separated0.0% Widowed0.0% DivorcedFemales 100.0% Never married0.0% Now married0.0% Separated0.0% Widowed0.0% DivorcedWomen who did not give birth in the past 12 months Now married:
0.0% (0)Unmarried:
100.0% (117)
Marital status - Asian population 15 years and over
Males 100.0% Never married0.0% Now married0.0% Separated0.0% Widowed0.0% DivorcedFemales 48.0% Never married0.0% Now married0.0% Separated0.0% Widowed52.0% DivorcedWomen who did not give birth in the past 12 months Now married:
0.0% (0)Unmarried:
100.0% (12)
Marital status - Other race population 15 years and over
Males 76.5% Never married23.5% Now married0.0% Separated0.0% Widowed0.0% DivorcedFemales 40.0% Never married24.4% Now married0.0% Separated35.6% Widowed0.0% DivorcedWomen who did not give birth in the past 12 months Now married:
28.0% (17)Unmarried:
72.0% (45)
Marital status - Two or more races population 15 years and over
Males 77.8% Never married22.2% Now married0.0% Separated0.0% Widowed0.0% DivorcedFemales 46.0% Never married6.0% Now married0.0% Separated0.0% Widowed48.0% DivorcedWomen who did not give birth in the past 12 months Now married:
0.0% (0)Unmarried:
100.0% (53)
Marital status - White alone, not Hispanic / Latino population 15 years and over
Males 58.0% Never married31.8% Now married1.0% Separated0.9% Widowed8.2% DivorcedFemales 45.5% Never married34.0% Now married0.9% Separated10.5% Widowed9.1% DivorcedWomen who gave birth in the past 12 months Now married:
53.2% (24)Unmarried:
46.8% (21)
Women who did not give birth in the past 12 months Now married:
27.5% (539)Unmarried:
72.5% (1,421)
Marital status - Hispanic or Latino population 15 years and over
Males 95.0% Never married5.0% Now married0.0% Separated0.0% Widowed0.0% DivorcedFemales 78.9% Never married19.7% Now married0.0% Separated1.4% Widowed0.0% DivorcedWomen who did not give birth in the past 12 months Now married:
19.7% (15)Unmarried:
80.3% (60)
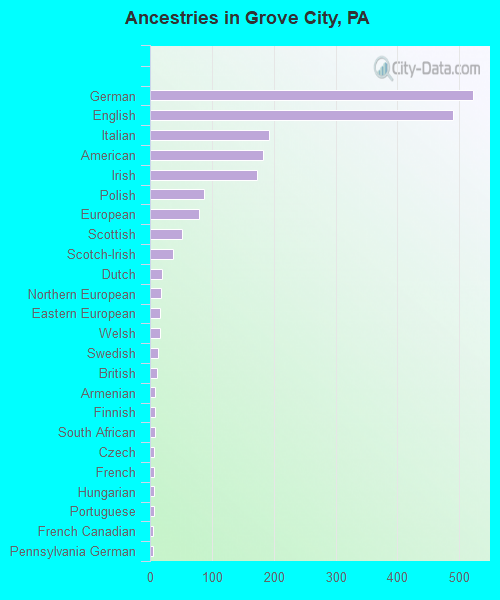
Ancestries in Grove City
522 22.1% German490 20.8% English192 8.1% Italian183 7.8% American173 7.3% Irish88 3.7% Polish79 3.3% European51 2.2% Scottish37 1.6% Scotch-Irish19 0.8% Dutch17 0.7% Northern European16 0.7% Eastern European16 0.7% Welsh13 0.6% Swedish11 0.5% British8 0.3% Armenian8 0.3% Finnish8 0.3% South African7 0.3% Czech7 0.3% French6 0.3% Hungarian6 0.3% Portuguese5 0.2% French Canadian5 0.2% Pennsylvania German4 0.2% Norwegian4 0.2% Ukrainian3 0.1% Australian
Children Nativity (place of birth) in Grove City
Children under 6 years - Living with two parents Both parents native 158 100.0% NativeChildren under 6 years - Living with one parent Native parent 55 100.0% Native
Children 6 to 17 years - Living with two parents Both parents native 584 96.3% Native22 3.7% Foreign-bornChildren 6 to 17 years - Living with one parent Native parent 154 100.0% Native
Grandparents responsible for own grandchildren in Grove City
Grandparents (30 to 59 years) White / Caucasian 19 73.0% Responsible for grandchildren7 27.0% Not responsible for grandchildrenWhite alone, not Hispanic / Latino 19 73.0% Responsible for grandchildren7 27.0% Not responsible for grandchildren
Grandparents (60 years and over) White / Caucasian 14 100.0% Responsible for grandchildrenWhite alone, not Hispanic / Latino 14 100.0% Responsible for grandchildren