Races in Groves, Texas (TX) Detailed Stats
Data:
Races - White alone (%)
Races - White alone (% change since 2000)
Races - Black alone (%)
Races - Black alone (% change since 2000)
Races - American Indian alone (%)
Races - American Indian alone (% change since 2000)
Races - Asian alone (%)
Races - Asian alone (% change since 2000)
Races - Hispanic (%)
Races - Hispanic (% change since 2000)
Races - Native Hawaiian and Other Pacific Islander alone (%)
Races - Native Hawaiian and Other Pacific Islander alone (% change since 2000)
Races - Two or more races(%)
Races - Two or more races(% change since 2000)
Races - Other race alone (%)
Races - Other race alone (% change since 2000)
Racial diversity
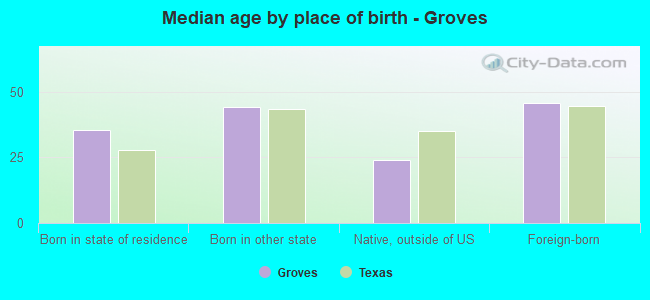
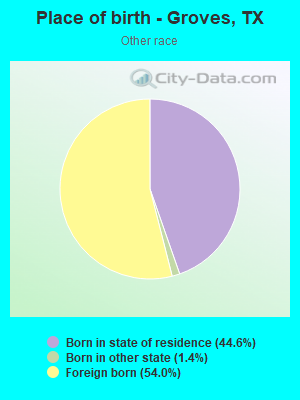
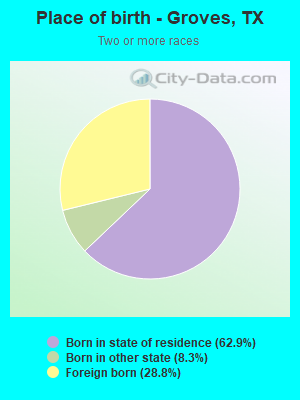
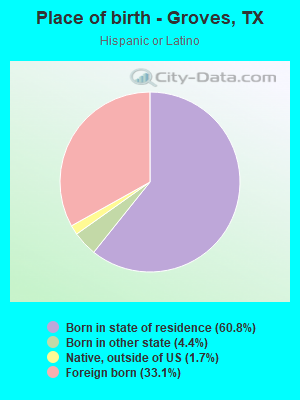
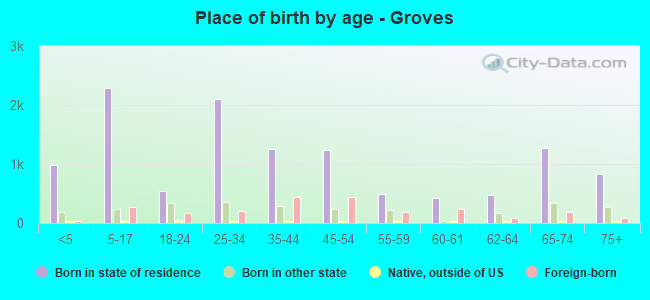
Place of birth - Born in state of residence (%)
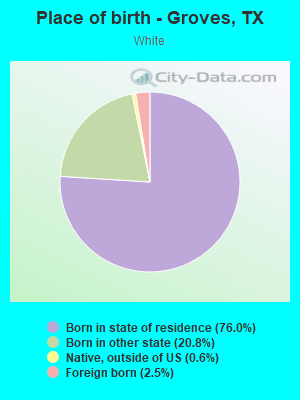
Place of birth - Born in state of residence (%) - White
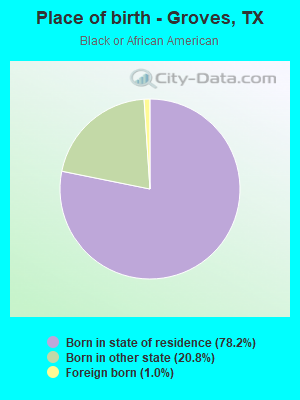
Place of birth - Born in state of residence (%) - Black or African American
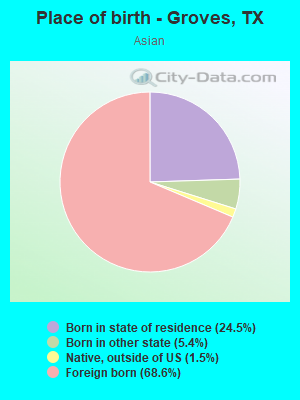
Place of birth - Born in state of residence (%) - Asian
Place of birth - Born in state of residence (%) - Hispanic or Latino
Place of birth - Born in state of residence (%) - American Indian and Alaska Native
Place of birth - Born in state of residence (%) - Multirace
Place of birth - Born in state of residence (%) - Other Race
Place of birth - Born in other state (%)
Place of birth - Born in other state (%) - White
Place of birth - Born in other state (%) - Black or African American
Place of birth - Born in other state (%) - Asian
Place of birth - Born in other state (%) - Hispanic or Latino
Place of birth - Born in other state (%) - American Indian and Alaska Native
Place of birth - Born in other state (%) - Multirace
Place of birth - Born in other state (%) - Other Race
Place of birth - Native, outside of US (%)
Place of birth - Native, outside of US (%) - White
Place of birth - Native, outside of US (%) - Black or African American
Place of birth - Native, outside of US (%) - Asian
Place of birth - Native, outside of US (%) - Hispanic or Latino
Place of birth - Native, outside of US (%) - American Indian and Alaska Native
Place of birth - Native, outside of US (%) - Multirace
Place of birth - Native, outside of US (%) - Other Race
Place of birth - Foreign born (%)
Place of birth - Foreign born (%) - White
Place of birth - Foreign born (%) - Black or African American
Place of birth - Foreign born (%) - Asian
Place of birth - Foreign born (%) - Hispanic or Latino
Place of birth - Foreign born (%) - American Indian and Alaska Native
Place of birth - Foreign born (%) - Multirace
Place of birth - Foreign born (%) - Other Race
Residents speaking English at home (%)
Residents speaking English at home - Born in the United States (%)
Residents speaking English at home - Native, born elsewhere (%)
Residents speaking English at home - Foreign born (%)
Residents speaking Spanish at home (%)
Residents speaking Spanish at home - Born in the United States (%)
Residents speaking Spanish at home - Native, born elsewhere (%)
Residents speaking Spanish at home - Foreign born (%)
Residents speaking other language at home (%)
Residents speaking other language at home - Born in the United States (%)
Residents speaking other language at home - Native, born elsewhere (%)
Residents speaking other language at home - Foreign born (%)
Marital status - Never married (%)
Marital status - Now married (%)
Marital status - Separated (%)
Marital status - Widowed (%)
Marital status - Divorced (%)
Ancestries Reported - Arab (%)
Ancestries Reported - Czech (%)
Ancestries Reported - Danish (%)
Ancestries Reported - Dutch (%)
Ancestries Reported - English (%)
Ancestries Reported - French (%)
Ancestries Reported - French Canadian (%)
Ancestries Reported - German (%)
Ancestries Reported - Greek (%)
Ancestries Reported - Hungarian (%)
Ancestries Reported - Irish (%)
Ancestries Reported - Italian (%)
Ancestries Reported - Lithuanian (%)
Ancestries Reported - Norwegian (%)
Ancestries Reported - Polish (%)
Ancestries Reported - Portuguese (%)
Ancestries Reported - Russian (%)
Ancestries Reported - Scotch-Irish (%)
Ancestries Reported - Scottish (%)
Ancestries Reported - Slovak (%)
Ancestries Reported - Subsaharan African (%)
Ancestries Reported - Swedish (%)
Ancestries Reported - Swiss (%)
Ancestries Reported - Ukrainian (%)
Ancestries Reported - United States (%)
Ancestries Reported - Welsh (%)
Ancestries Reported - West Indian (%)
Ancestries Reported - Other (%)
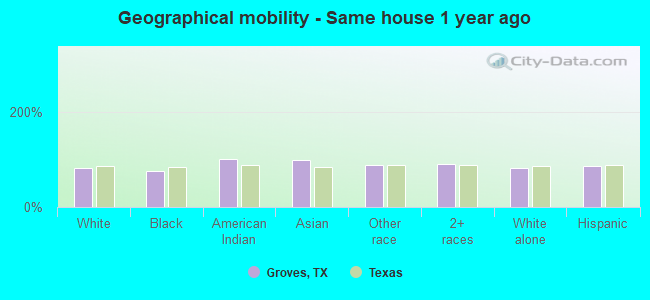
Geographical mobility - Same house 1 year ago (%)
Geographical mobility - Same house 1 year ago (%) - White
Geographical mobility - Same house 1 year ago (%) - Black or African American
Geographical mobility - Same house 1 year ago (%) - Asian
Geographical mobility - Same house 1 year ago (%) - Hispanic or Latino
Geographical mobility - Same house 1 year ago (%) - American Indian and Alaska Native
Geographical mobility - Same house 1 year ago (%) - Multirace
Geographical mobility - Same house 1 year ago (%) - Other Race
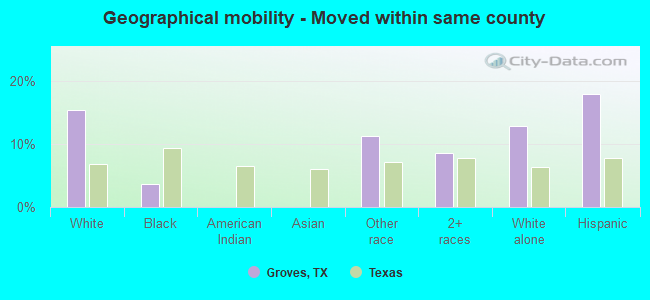
Geographical mobility - Moved within same county (%)
Geographical mobility - Moved within same county (%) - White
Geographical mobility - Moved within same county (%) - Black or African American
Geographical mobility - Moved within same county (%) - Asian
Geographical mobility - Moved within same county (%) - Hispanic or Latino
Geographical mobility - Moved within same county (%) - American Indian and Alaska Native
Geographical mobility - Moved within same county (%) - Multirace
Geographical mobility - Moved within same county (%) - Other Race
Geographical mobility - Moved from different county within same state (%)
Geographical mobility - Moved from different county within same state (%) - White
Geographical mobility - Moved from different county within same state (%) - Black or African American
Geographical mobility - Moved from different county within same state (%) - Asian
Geographical mobility - Moved from different county within same state (%) - Hispanic or Latino
Geographical mobility - Moved from different county within same state (%) - American Indian and Alaska Native
Geographical mobility - Moved from different county within same state (%) - Multirace
Geographical mobility - Moved from different county within same state (%) - Other Race
Geographical mobility - Moved from different state (%)
Geographical mobility - Moved from different state (%) - White
Geographical mobility - Moved from different state (%) - Black or African American
Geographical mobility - Moved from different state (%) - Asian
Geographical mobility - Moved from different state (%) - Hispanic or Latino
Geographical mobility - Moved from different state (%) - American Indian and Alaska Native
Geographical mobility - Moved from different state (%) - Multirace
Geographical mobility - Moved from different state (%) - Other Race
Geographical mobility - Moved from abroad (%)
Geographical mobility - Moved from abroad (%) - White
Geographical mobility - Moved from abroad (%) - Black or African American
Geographical mobility - Moved from abroad (%) - Asian
Geographical mobility - Moved from abroad (%) - Hispanic or Latino
Geographical mobility - Moved from abroad (%) - American Indian and Alaska Native
Geographical mobility - Moved from abroad (%) - Multirace
Geographical mobility - Moved from abroad (%) - Other Race
Place of birth for the foreign-born population - Ireland (%)
Place of birth for the foreign-born population - Denmark (%)
Place of birth for the foreign-born population - Norway (%)
Place of birth for the foreign-born population - Sweden (%)
Place of birth for the foreign-born population - United Kingdom (%)
Place of birth for the foreign-born population - England (%)
Place of birth for the foreign-born population - Scotland (%)
Place of birth for the foreign-born population - Other Northern Europe (%)
Place of birth for the foreign-born population - Austria (%)
Place of birth for the foreign-born population - Belgium (%)
Place of birth for the foreign-born population - France (%)
Place of birth for the foreign-born population - Germany (%)
Place of birth for the foreign-born population - Netherlands (%)
Place of birth for the foreign-born population - Switzerland (%)
Place of birth for the foreign-born population - Other Western Europe (%)
Place of birth for the foreign-born population - Greece (%)
Place of birth for the foreign-born population - Italy (%)
Place of birth for the foreign-born population - Portugal (%)
Place of birth for the foreign-born population - Spain (%)
Place of birth for the foreign-born population - Other Southern Europe (%)
Place of birth for the foreign-born population - Albania (%)
Place of birth for the foreign-born population - Belarus (%)
Place of birth for the foreign-born population - Bosnia and Herzegovina (%)
Place of birth for the foreign-born population - Bulgaria (%)
Place of birth for the foreign-born population - Croatia (%)
Place of birth for the foreign-born population - Czechoslovakia (%)
Place of birth for the foreign-born population - Hungary (%)
Place of birth for the foreign-born population - Latvia (%)
Place of birth for the foreign-born population - Lithuania (%)
Place of birth for the foreign-born population - North Macedonia (Macedonia) (%)
Place of birth for the foreign-born population - Moldova (%)
Place of birth for the foreign-born population - Poland (%)
Place of birth for the foreign-born population - Romania (%)
Place of birth for the foreign-born population - Russia (%)
Place of birth for the foreign-born population - Serbia (%)
Place of birth for the foreign-born population - Ukraine (%)
Place of birth for the foreign-born population - Other Eastern Europe (%)
Place of birth for the foreign-born population - China (%)
Place of birth for the foreign-born population - Hong Kong (%)
Place of birth for the foreign-born population - Taiwan (%)
Place of birth for the foreign-born population - Japan (%)
Place of birth for the foreign-born population - Korea (%)
Place of birth for the foreign-born population - Other Eastern Asia (%)
Place of birth for the foreign-born population - Afghanistan (%)
Place of birth for the foreign-born population - Bangladesh (%)
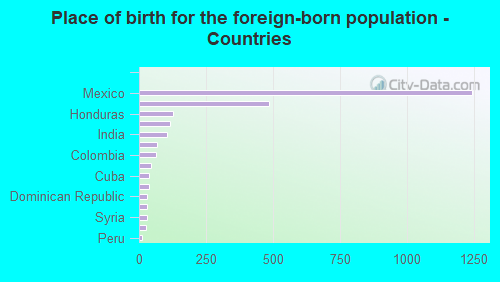
Place of birth for the foreign-born population - India (%)
Place of birth for the foreign-born population - Iran (%)
Place of birth for the foreign-born population - Kazakhstan (%)
Place of birth for the foreign-born population - Nepal (%)
Place of birth for the foreign-born population - Pakistan (%)
Place of birth for the foreign-born population - Sri Lanka (%)
Place of birth for the foreign-born population - Uzbekistan (%)
Place of birth for the foreign-born population - Other South Central Asia (%)
Place of birth for the foreign-born population - Burma (%)
Place of birth for the foreign-born population - Cambodia (%)
Place of birth for the foreign-born population - Indonesia (%)
Place of birth for the foreign-born population - Laos (%)
Place of birth for the foreign-born population - Malaysia (%)
Place of birth for the foreign-born population - Philippines (%)
Place of birth for the foreign-born population - Singapore (%)
Place of birth for the foreign-born population - Thailand (%)
Place of birth for the foreign-born population - Vietnam (%)
Place of birth for the foreign-born population - Other South Eastern Asia (%)
Place of birth for the foreign-born population - Armenia (%)
Place of birth for the foreign-born population - Iraq (%)
Place of birth for the foreign-born population - Israel (%)
Place of birth for the foreign-born population - Jordan (%)
Place of birth for the foreign-born population - Kuwait (%)
Place of birth for the foreign-born population - Lebanon (%)
Place of birth for the foreign-born population - Saudi Arabia (%)
Place of birth for the foreign-born population - Syria (%)
Place of birth for the foreign-born population - Turkey (%)
Place of birth for the foreign-born population - Yemen (%)
Place of birth for the foreign-born population - Other Western Asia (%)
Place of birth for the foreign-born population - Eritrea (%)
Place of birth for the foreign-born population - Ethiopia (%)
Place of birth for the foreign-born population - Kenya (%)
Place of birth for the foreign-born population - Somalia (%)
Place of birth for the foreign-born population - Uganda (%)
Place of birth for the foreign-born population - Zimbabwe (%)
Place of birth for the foreign-born population - Other Eastern Africa (%)
Place of birth for the foreign-born population - Cameroon (%)
Place of birth for the foreign-born population - Congo (%)
Place of birth for the foreign-born population - Democratic Republic of Congo (Zaire) (%)
Place of birth for the foreign-born population - Other Middle Africa (%)
Place of birth for the foreign-born population - Egypt (%)
Place of birth for the foreign-born population - Morocco (%)
Place of birth for the foreign-born population - Sudan (%)
Place of birth for the foreign-born population - Other Northern Africa (%)
Place of birth for the foreign-born population - South Africa (%)
Place of birth for the foreign-born population - Other Southern Africa (%)
Place of birth for the foreign-born population - Cabo Verde (%)
Place of birth for the foreign-born population - Ghana (%)
Place of birth for the foreign-born population - Liberia (%)
Place of birth for the foreign-born population - Nigeria (%)
Place of birth for the foreign-born population - Senegal (%)
Place of birth for the foreign-born population - Sierra Leone (%)
Place of birth for the foreign-born population - Other Western Africa (%)
Place of birth for the foreign-born population - Australia (%)
Place of birth for the foreign-born population - New Zealand (%)
Place of birth for the foreign-born population - Fiji (%)
Place of birth for the foreign-born population - Micronesia (%)
Place of birth for the foreign-born population - Bahamas (%)
Place of birth for the foreign-born population - Barbados (%)
Place of birth for the foreign-born population - Cuba (%)
Place of birth for the foreign-born population - Dominica (%)
Place of birth for the foreign-born population - Dominican Republic (%)
Place of birth for the foreign-born population - Grenada (%)
Place of birth for the foreign-born population - Haiti (%)
Place of birth for the foreign-born population - Jamaica (%)
Place of birth for the foreign-born population - St. Vincent and the Grenadines (%)
Place of birth for the foreign-born population - Trinidad and Tobago (%)
Place of birth for the foreign-born population - West Indies (%)
Place of birth for the foreign-born population - Other Caribbean (%)
Place of birth for the foreign-born population - Belize (%)
Place of birth for the foreign-born population - Costa Rica (%)
Place of birth for the foreign-born population - El Salvador (%)
Place of birth for the foreign-born population - Guatemala (%)
Place of birth for the foreign-born population - Honduras (%)
Place of birth for the foreign-born population - Mexico (%)
Place of birth for the foreign-born population - Nicaragua (%)
Place of birth for the foreign-born population - Panama (%)
Place of birth for the foreign-born population - Other Central America (%)
Place of birth for the foreign-born population - Argentina (%)
Place of birth for the foreign-born population - Bolivia (%)
Place of birth for the foreign-born population - Brazil (%)
Place of birth for the foreign-born population - Chile (%)
Place of birth for the foreign-born population - Colombia (%)
Place of birth for the foreign-born population - Ecuador (%)
Place of birth for the foreign-born population - Guyana (%)
Place of birth for the foreign-born population - Peru (%)
Place of birth for the foreign-born population - Uruguay (%)
Place of birth for the foreign-born population - Venezuela (%)
Place of birth for the foreign-born population - Other South America (%)
Place of birth for the foreign-born population - Canada (%)
Place of birth for the foreign-born population - Other Northern America (%)
Place of birth for the foreign-born population - Other (%)
Latest news about races in Groves, TX collected exclusively by city-data.com from local newspapers, TV, and radio stations
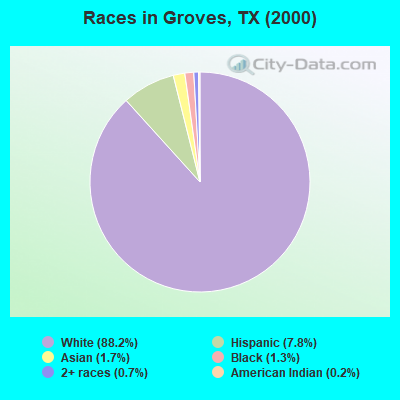
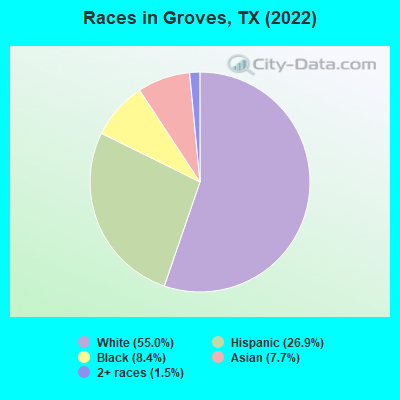
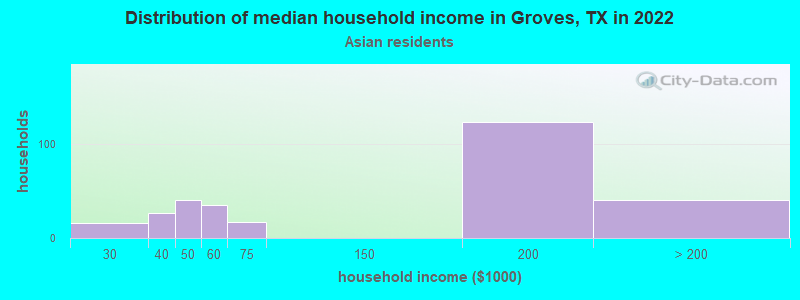
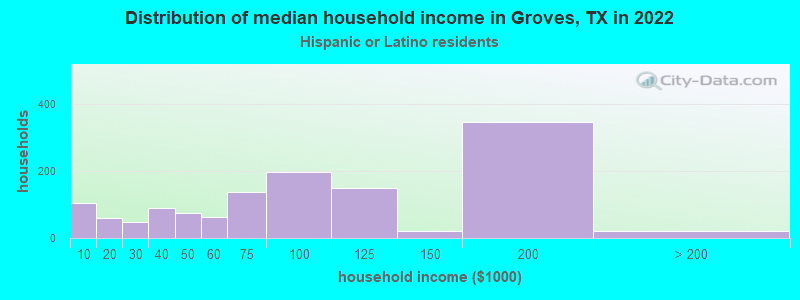
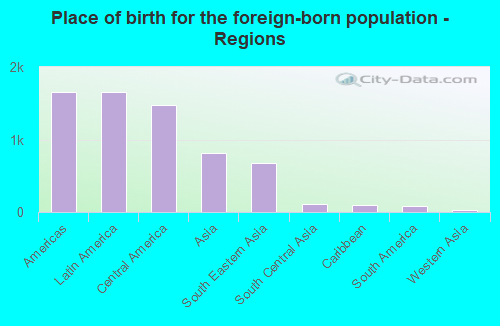
According to 2022 data, the most numerous races in Groves, TX are Hispanic (4,530 residents), White alone (9,261 residents), and Black alone (1,413 residents). 75.1% of Groves residents speak English at home. 14.7% of Groves, TX residents are foreign-born (9.3% born in Latin America, 4.6% born in Asia), which is 15.8% less than the foreign-born rate of 17.0% across the entire state of Texas.
Race distribution in Groves
2000 2022
10,933,313 52.4% White alone 6,669,666 32.0% Hispanic 2,364,255 11.3% Black alone 554,445 2.7% Asian alone 230,567 1.1% Two or more races 68,859 0.3% American Indian alone 19,958 0.10% Other race alone 10,757 0.05% Native Hawaiian and Other
12,070,642 40.2% Hispanic 11,683,430 38.9% White alone 3,508,706 11.7% Black alone 1,608,173 5.4% Asian alone 956,560 3.2% Two or more races 125,763 0.4% Other race alone 47,023 0.2% American Indian alone 29,275 0.10% Native Hawaiian and Other
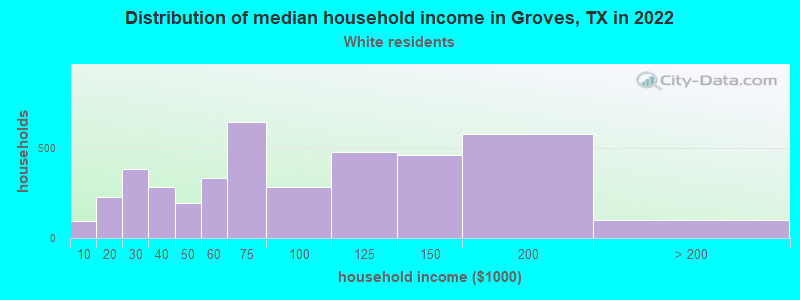
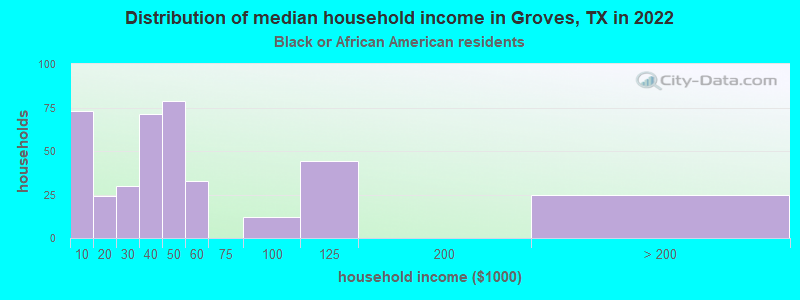
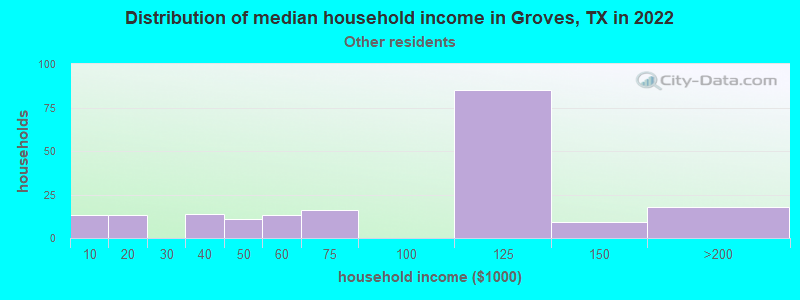
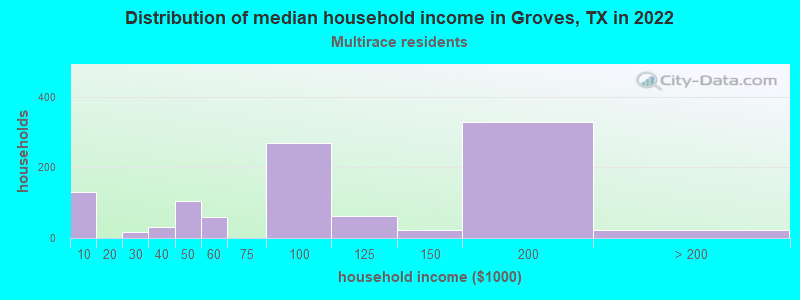
Income and house value in Groves Median household income in 2022 $66,303 White non-Hispanic householders$36,469 Black householders$105,536 Some other race householders$78,633 Two or more races householders$71,630 Hispanic or Latino race householdersMedian 2022 house value $158,887 White Non-Hispanic householders$151,888 Black or African American householders$262,565 American Indian or Alaska Native householders $133,486 Asian householders$123,118 Some other race householders$185,843 Two or more races householders$150,074 Hispanic or Latino householders
Median age by race in Groves
47.5 Median age for White residents43.3 51.3 30.8 Median age for Black or African American residents15.6 33.7 -684,418,145.3 Median age for American Indian / Alaska Native residents-682,445,758.7 -684,418,145.3 39.6 Median age for Asian residents40.2 38.5 -581,560,283.1 Median age for Native Hawaiian / Pacific Islander residents-666,666,666.0 -577,777,777.2 34.0 Median age for Other race residents43.2 20.5 32.5 Median age for Two or more races residents31.9 35.1 47.6 Median age for White alone residents47.1 49.7 28.7 Median age for Hispanic or Latino residents28.5 31.2
Owner/renter occupied households by race in Groves
House owners and renters - White residents 3,157 78.3% Owner occupied877 21.7% Renter occupiedHouse owners and renters - Black or African American residents 67 16.6% Owner occupied337 83.4% Renter occupiedHouse owners and renters - American Indian / Alaska Native residents 5 100.0% Renter occupiedHouse owners and renters - Asian residents 245 72.1% Owner occupied95 27.9% Renter occupiedHouse owners and renters - Other race residents 184 90.1% Owner occupied20 9.9% Renter occupiedHouse owners and renters - Two or more races residents 772 75.8% Owner occupied246 24.2% Renter occupiedHouse owners and renters - White alone residents 3,064 77.1% Owner occupied908 22.9% Renter occupiedHouse owners and renters - Hispanic or Latino residents 1,019 80.9% Owner occupied241 19.1% Renter occupied
Language usage in Groves
English speakers - Total 75.1% of residents of Groves speak English at home.
17.2% of residents speak Spanish at home 1,953 72.8% Speak English very well731 27.2% Speak English less than very well7.9% of residents speak other language at home 855 68.8% Speak English very well387 31.2% Speak English less than very well
English speakers - Born in the United States 92.2% of residents of Groves speak English at home.
5.5% of residents speak Spanish at home 135 100.0% Speak English very well3.0% of residents speak other language at home 25 34.2% Speak English very well48 65.8% Speak English less than very well
English speakers - Native, born elsewhere 51.7% of residents of Groves speak English at home.
24.7% of residents speak Spanish at home 3 13.6% Speak English very well19 86.4% Speak English less than very well7.9% of residents speak other language at home 7 100.0% Speak English very well
English speakers - Foreign-born 6.9% of residents of Groves speak English at home.
56.5% of residents speak Spanish at home 757 58.5% Speak English very well536 41.5% Speak English less than very well38.6% of residents speak other language at home 497 56.2% Speak English very well387 43.8% Speak English less than very well
White (Caucasian) - Speak only English Native:
99.7% (8,927)Foreign-born:
18.5% (45)
White (Caucasian) - Speak another language Native:
3.8% (336)Foreign-born:
75.4% (185)
Black or African American - Speak only English Native:
100.0% (1,347)Foreign-born:
90.7% (27)
Asian - Speak another language Native:
72.4% (249)Foreign-born:
99.7% (837)
Other race - Speak only English Native:
42.1% (141)Foreign-born:
11.5% (61)
Other race - Speak another language Native:
33.5% (112)Foreign-born:
88.4% (463)
Two or more races - Speak only English Native:
43.5% (941)Foreign-born:
5.0% (45)
Two or more races - Speak another language Native:
56.2% (1,218)Foreign-born:
94.9% (861)
White alone - Speak only English Native:
98.3% (8,665)Foreign-born:
26.4% (10)
White alone - Speak another language Native:
1.6% (141)Foreign-born:
73.9% (27)
Hispanic or Latino - Speak only English Native:
51.5% (1,307)Foreign-born:
10.5% (153)
Hispanic or Latino - Speak another language Native:
50.6% (1,286)Foreign-born:
90.0% (1,312)
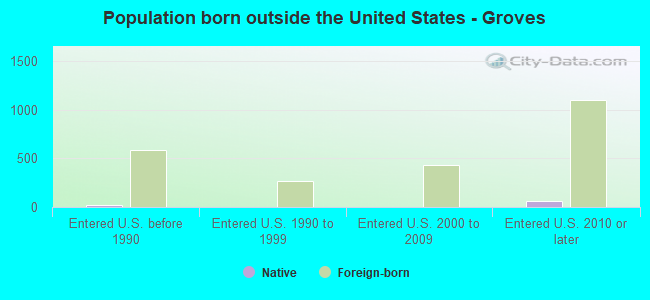
Foreign-born residents in Groves 2,471 residents are foreign born (9.3% Latin America , 4.6% Asia ).
This city:
14.7%Texas:
17.1%
Marital status for residents in Groves Marital status - White (Caucasian) population 15 years and over
Males 23.1% Never married53.2% Now married4.1% Separated2.4% Widowed17.1% DivorcedFemales 19.1% Never married47.6% Now married3.4% Separated17.0% Widowed12.9% DivorcedWomen who gave birth in the past 12 months Now married:
72.6% (55)Unmarried:
27.4% (21)
Women who did not give birth in the past 12 months Now married:
56.0% (889)Unmarried:
44.0% (699)
Marital status - Black or African American population 15 years and over
Males 72.9% Never married17.0% Now married1.6% Separated5.5% Widowed3.0% DivorcedFemales 58.2% Never married22.5% Now married6.7% Separated0.0% Widowed12.6% DivorcedWomen who did not give birth in the past 12 months Now married:
39.9% (118)Unmarried:
60.1% (179)
Marital status - Asian population 15 years and over
Males 21.6% Never married68.2% Now married0.0% Separated4.4% Widowed5.9% DivorcedFemales 18.6% Never married75.2% Now married2.1% Separated0.0% Widowed4.0% DivorcedWomen who did not give birth in the past 12 months Now married:
68.1% (197)Unmarried:
31.9% (92)
Marital status - Other race population 15 years and over
Males 18.1% Never married79.1% Now married0.0% Separated1.1% Widowed1.8% DivorcedFemales 44.5% Never married46.9% Now married0.0% Separated0.0% Widowed8.6% DivorcedWomen who did not give birth in the past 12 months Now married:
31.3% (82)Unmarried:
68.7% (179)
Marital status - Two or more races population 15 years and over
Males 11.2% Never married84.5% Now married0.0% Separated0.5% Widowed3.8% DivorcedFemales 17.0% Never married61.7% Now married6.8% Separated4.2% Widowed10.3% DivorcedWomen who gave birth in the past 12 months Now married:
100.0% (61)Unmarried:
0.0% (0)
Women who did not give birth in the past 12 months Now married:
68.2% (598)Unmarried:
31.8% (278)
Marital status - White alone, not Hispanic / Latino population 15 years and over
Males 19.6% Never married56.1% Now married4.7% Separated2.7% Widowed16.8% DivorcedFemales 18.2% Never married47.6% Now married3.8% Separated18.2% Widowed12.2% DivorcedWomen who gave birth in the past 12 months Now married:
68.4% (36)Unmarried:
31.6% (17)
Women who did not give birth in the past 12 months Now married:
57.1% (904)Unmarried:
42.9% (679)
Marital status - Hispanic or Latino population 15 years and over
Males 27.0% Never married62.9% Now married0.0% Separated0.2% Widowed9.9% DivorcedFemales 22.0% Never married56.5% Now married4.0% Separated4.9% Widowed12.6% DivorcedWomen who gave birth in the past 12 months Now married:
89.7% (73)Unmarried:
10.3% (8)
Women who did not give birth in the past 12 months Now married:
58.0% (594)Unmarried:
42.0% (431)
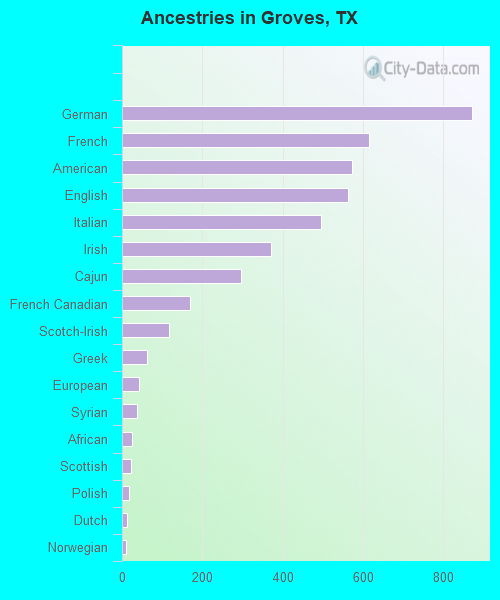
Ancestries in Groves
870 8.6% German616 6.1% French572 5.7% American562 5.6% English495 4.9% Italian371 3.7% Irish296 2.9% Cajun169 1.7% French Canadian116 1.1% Scotch-Irish61 0.6% Greek42 0.4% European38 0.4% Syrian25 0.2% African23 0.2% Scottish18 0.2% Polish13 0.1% Dutch9 0.09% Norwegian7 0.07% Lebanese3 0.03% British
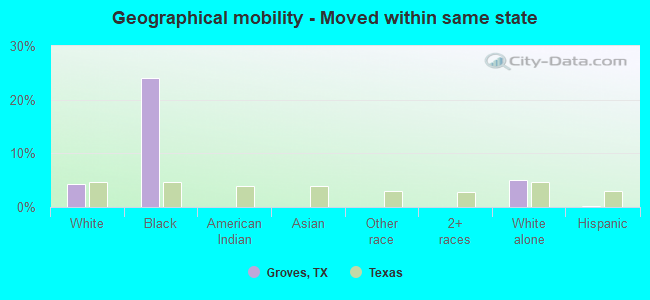
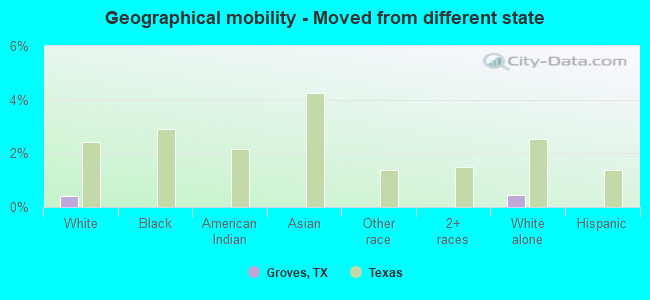
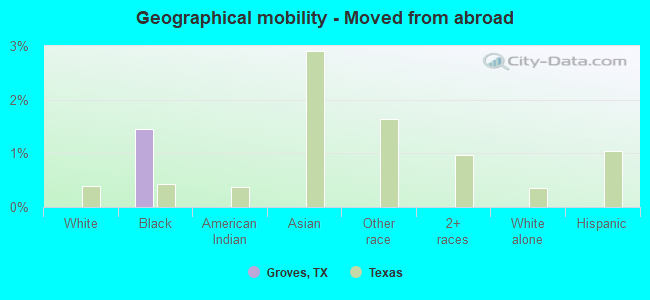
Geographical mobility in Groves Same house 1 year ago 7,572 81.5% White (Caucasian)1,135 75.2% Black or African American6 100.0% American Indian / Alaska Native1,304 99.3% Asian758 87.9% Other race2,964 90.0% Two or more races7,537 82.5% White alone, not Hispanic / Latino3,815 85.6% Hispanic or LatinoMoved within same county 1,428 15.4% White / Caucasian55 3.6% Black or African American97 11.3% Other race282 8.6% Two or more races1,178 12.9% White alone, not Hispanic / Latino800 17.9% Hispanic or LatinoMoved within same state 393 4.2% White / Caucasian363 24.1% Black or African American456 5.0% White alone, not Hispanic / Latino9 0.2% Hispanic or LatinoMoved from different state 38 0.4% White / Caucasian41 0.5% White alone, not Hispanic / LatinoMoved from abroad 22 1.5% Black or African American
Children Nativity (place of birth) in Groves
Children under 6 years - Living with two parents Both parents native 596 100.0% NativeBoth parents foreign-born 69 100.0% NativeOne native, one foreign-born parent 50 100.0% NativeChildren under 6 years - Living with one parent Native parent 545 100.0% NativeForeign-born parent 91 75.6% Native29 24.4% Foreign-bornChildren 6 to 17 years - Living with two parents Both parents native 724 100.0% NativeBoth parents foreign-born 139 59.2% Native96 40.8% Foreign-bornOne native, one foreign-born parent 163 100.0% NativeChildren 6 to 17 years - Living with one parent Native parent 921 100.0% NativeForeign-born parent 161 58.6% Native114 41.4% Foreign-born
Grandparents responsible for own grandchildren in Groves
Grandparents (30 to 59 years) White / Caucasian 14 13.6% Responsible for grandchildren88 86.4% Not responsible for grandchildrenBlack or African American 25 31.8% Responsible for grandchildren53 68.2% Not responsible for grandchildrenOther race 62 100.0% Not responsible for grandchildrenTwo or more races 72 62.0% Responsible for grandchildren44 38.0% Not responsible for grandchildrenWhite alone, not Hispanic / Latino 7 7.5% Responsible for grandchildren93 92.5% Not responsible for grandchildrenHispanic or Latino 46 28.0% Responsible for grandchildren118 72.0% Not responsible for grandchildrenGrandparents (60 years and over) White / Caucasian 45 33.4% Responsible for grandchildren89 66.6% Not responsible for grandchildrenTwo or more races 249 62.6% Responsible for grandchildren149 37.4% Not responsible for grandchildrenWhite alone, not Hispanic / Latino 53 30.3% Responsible for grandchildren122 69.7% Not responsible for grandchildrenHispanic or Latino 142 63.5% Responsible for grandchildren81 36.5% Not responsible for grandchildren