Races in Gulfport, Florida (FL) Detailed Stats
Data:
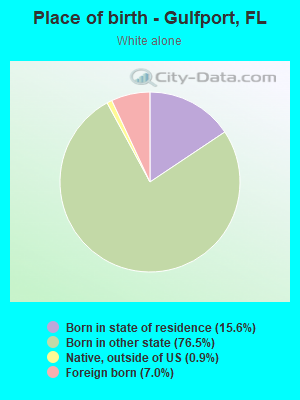
Races - White alone (%)
Races - White alone (% change since 2000)
Races - Black alone (%)
Races - Black alone (% change since 2000)
Races - American Indian alone (%)
Races - American Indian alone (% change since 2000)
Races - Asian alone (%)
Races - Asian alone (% change since 2000)
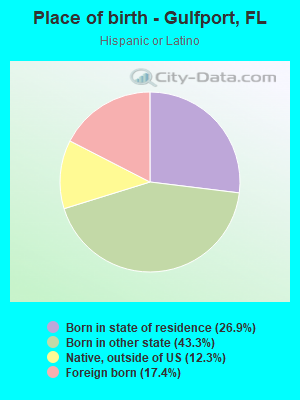
Races - Hispanic (%)
Races - Hispanic (% change since 2000)
Races - Native Hawaiian and Other Pacific Islander alone (%)
Races - Native Hawaiian and Other Pacific Islander alone (% change since 2000)
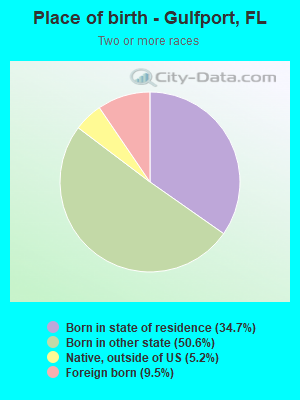
Races - Two or more races(%)
Races - Two or more races(% change since 2000)
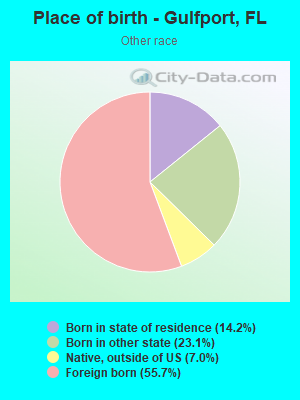
Races - Other race alone (%)
Races - Other race alone (% change since 2000)
Racial diversity
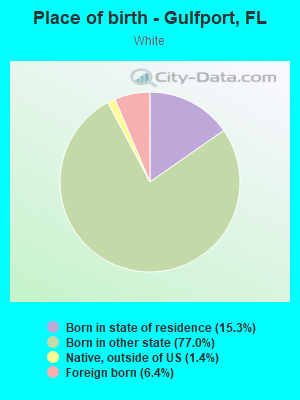
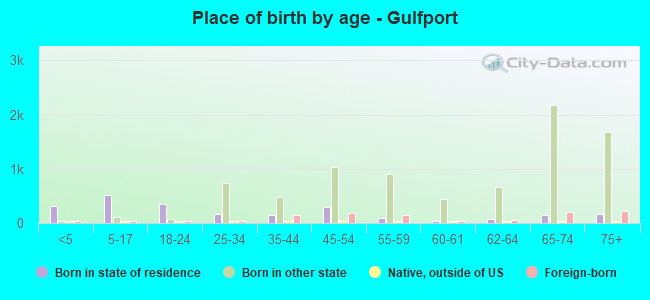
Place of birth - Born in state of residence (%)
Place of birth - Born in state of residence (%) - White
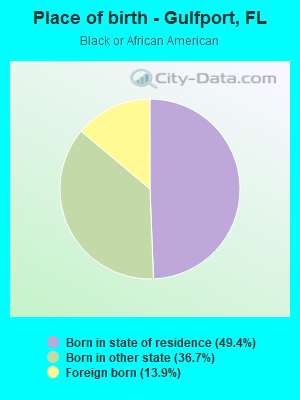
Place of birth - Born in state of residence (%) - Black or African American
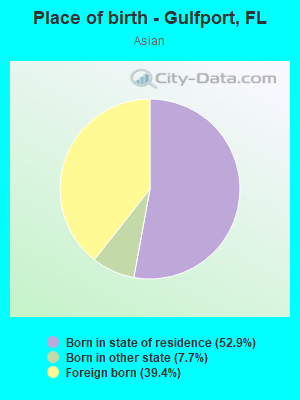
Place of birth - Born in state of residence (%) - Asian
Place of birth - Born in state of residence (%) - Hispanic or Latino
Place of birth - Born in state of residence (%) - American Indian and Alaska Native
Place of birth - Born in state of residence (%) - Multirace
Place of birth - Born in state of residence (%) - Other Race
Place of birth - Born in other state (%)
Place of birth - Born in other state (%) - White
Place of birth - Born in other state (%) - Black or African American
Place of birth - Born in other state (%) - Asian
Place of birth - Born in other state (%) - Hispanic or Latino
Place of birth - Born in other state (%) - American Indian and Alaska Native
Place of birth - Born in other state (%) - Multirace
Place of birth - Born in other state (%) - Other Race
Place of birth - Native, outside of US (%)
Place of birth - Native, outside of US (%) - White
Place of birth - Native, outside of US (%) - Black or African American
Place of birth - Native, outside of US (%) - Asian
Place of birth - Native, outside of US (%) - Hispanic or Latino
Place of birth - Native, outside of US (%) - American Indian and Alaska Native
Place of birth - Native, outside of US (%) - Multirace
Place of birth - Native, outside of US (%) - Other Race
Place of birth - Foreign born (%)
Place of birth - Foreign born (%) - White
Place of birth - Foreign born (%) - Black or African American
Place of birth - Foreign born (%) - Asian
Place of birth - Foreign born (%) - Hispanic or Latino
Place of birth - Foreign born (%) - American Indian and Alaska Native
Place of birth - Foreign born (%) - Multirace
Place of birth - Foreign born (%) - Other Race
Residents speaking English at home (%)
Residents speaking English at home - Born in the United States (%)
Residents speaking English at home - Native, born elsewhere (%)
Residents speaking English at home - Foreign born (%)
Residents speaking Spanish at home (%)
Residents speaking Spanish at home - Born in the United States (%)
Residents speaking Spanish at home - Native, born elsewhere (%)
Residents speaking Spanish at home - Foreign born (%)
Residents speaking other language at home (%)
Residents speaking other language at home - Born in the United States (%)
Residents speaking other language at home - Native, born elsewhere (%)
Residents speaking other language at home - Foreign born (%)
Marital status - Never married (%)
Marital status - Now married (%)
Marital status - Separated (%)
Marital status - Widowed (%)
Marital status - Divorced (%)
Ancestries Reported - Arab (%)
Ancestries Reported - Czech (%)
Ancestries Reported - Danish (%)
Ancestries Reported - Dutch (%)
Ancestries Reported - English (%)
Ancestries Reported - French (%)
Ancestries Reported - French Canadian (%)
Ancestries Reported - German (%)
Ancestries Reported - Greek (%)
Ancestries Reported - Hungarian (%)
Ancestries Reported - Irish (%)
Ancestries Reported - Italian (%)
Ancestries Reported - Lithuanian (%)
Ancestries Reported - Norwegian (%)
Ancestries Reported - Polish (%)
Ancestries Reported - Portuguese (%)
Ancestries Reported - Russian (%)
Ancestries Reported - Scotch-Irish (%)
Ancestries Reported - Scottish (%)
Ancestries Reported - Slovak (%)
Ancestries Reported - Subsaharan African (%)
Ancestries Reported - Swedish (%)
Ancestries Reported - Swiss (%)
Ancestries Reported - Ukrainian (%)
Ancestries Reported - United States (%)
Ancestries Reported - Welsh (%)
Ancestries Reported - West Indian (%)
Ancestries Reported - Other (%)
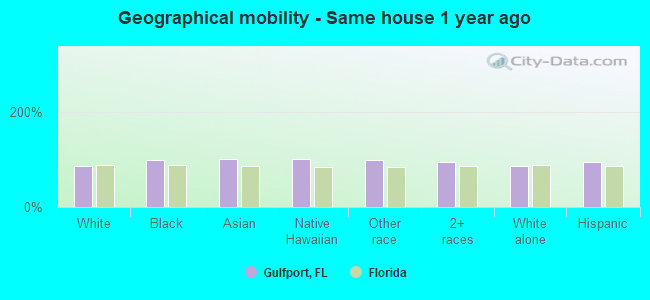
Geographical mobility - Same house 1 year ago (%)
Geographical mobility - Same house 1 year ago (%) - White
Geographical mobility - Same house 1 year ago (%) - Black or African American
Geographical mobility - Same house 1 year ago (%) - Asian
Geographical mobility - Same house 1 year ago (%) - Hispanic or Latino
Geographical mobility - Same house 1 year ago (%) - American Indian and Alaska Native
Geographical mobility - Same house 1 year ago (%) - Multirace
Geographical mobility - Same house 1 year ago (%) - Other Race
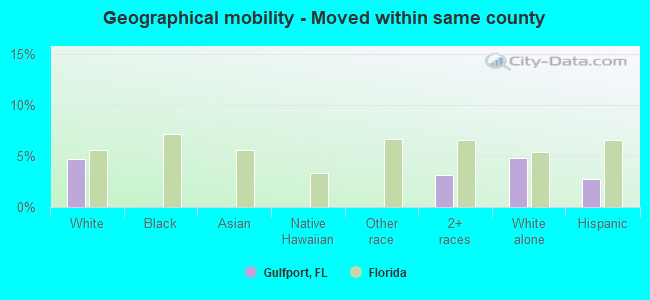
Geographical mobility - Moved within same county (%)
Geographical mobility - Moved within same county (%) - White
Geographical mobility - Moved within same county (%) - Black or African American
Geographical mobility - Moved within same county (%) - Asian
Geographical mobility - Moved within same county (%) - Hispanic or Latino
Geographical mobility - Moved within same county (%) - American Indian and Alaska Native
Geographical mobility - Moved within same county (%) - Multirace
Geographical mobility - Moved within same county (%) - Other Race
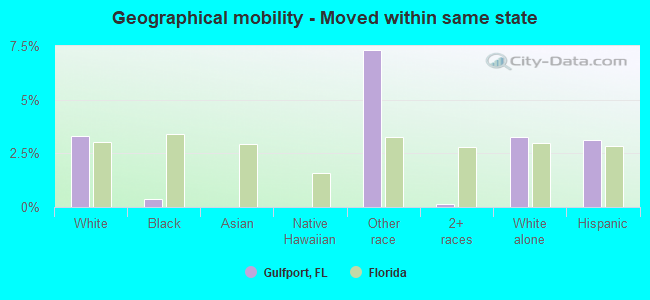
Geographical mobility - Moved from different county within same state (%)
Geographical mobility - Moved from different county within same state (%) - White
Geographical mobility - Moved from different county within same state (%) - Black or African American
Geographical mobility - Moved from different county within same state (%) - Asian
Geographical mobility - Moved from different county within same state (%) - Hispanic or Latino
Geographical mobility - Moved from different county within same state (%) - American Indian and Alaska Native
Geographical mobility - Moved from different county within same state (%) - Multirace
Geographical mobility - Moved from different county within same state (%) - Other Race
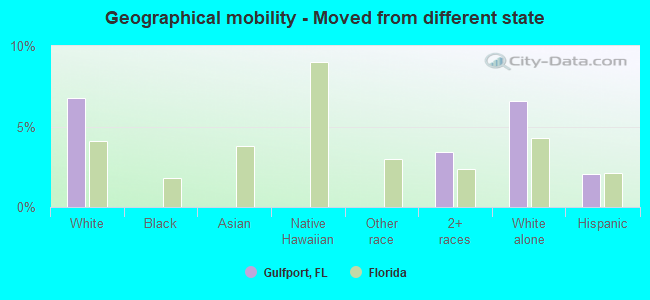
Geographical mobility - Moved from different state (%)
Geographical mobility - Moved from different state (%) - White
Geographical mobility - Moved from different state (%) - Black or African American
Geographical mobility - Moved from different state (%) - Asian
Geographical mobility - Moved from different state (%) - Hispanic or Latino
Geographical mobility - Moved from different state (%) - American Indian and Alaska Native
Geographical mobility - Moved from different state (%) - Multirace
Geographical mobility - Moved from different state (%) - Other Race
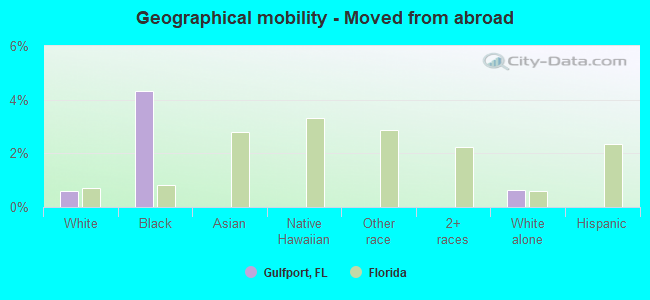
Geographical mobility - Moved from abroad (%)
Geographical mobility - Moved from abroad (%) - White
Geographical mobility - Moved from abroad (%) - Black or African American
Geographical mobility - Moved from abroad (%) - Asian
Geographical mobility - Moved from abroad (%) - Hispanic or Latino
Geographical mobility - Moved from abroad (%) - American Indian and Alaska Native
Geographical mobility - Moved from abroad (%) - Multirace
Geographical mobility - Moved from abroad (%) - Other Race
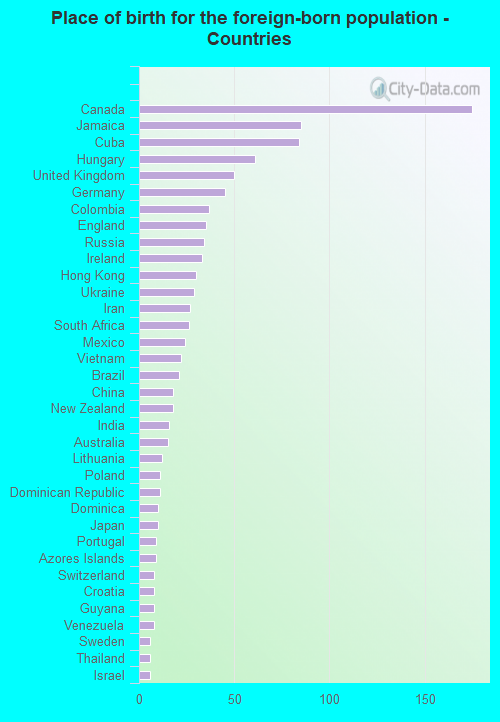
Place of birth for the foreign-born population - Ireland (%)
Place of birth for the foreign-born population - Denmark (%)
Place of birth for the foreign-born population - Norway (%)
Place of birth for the foreign-born population - Sweden (%)
Place of birth for the foreign-born population - United Kingdom (%)
Place of birth for the foreign-born population - England (%)
Place of birth for the foreign-born population - Scotland (%)
Place of birth for the foreign-born population - Other Northern Europe (%)
Place of birth for the foreign-born population - Austria (%)
Place of birth for the foreign-born population - Belgium (%)
Place of birth for the foreign-born population - France (%)
Place of birth for the foreign-born population - Germany (%)
Place of birth for the foreign-born population - Netherlands (%)
Place of birth for the foreign-born population - Switzerland (%)
Place of birth for the foreign-born population - Other Western Europe (%)
Place of birth for the foreign-born population - Greece (%)
Place of birth for the foreign-born population - Italy (%)
Place of birth for the foreign-born population - Portugal (%)
Place of birth for the foreign-born population - Spain (%)
Place of birth for the foreign-born population - Other Southern Europe (%)
Place of birth for the foreign-born population - Albania (%)
Place of birth for the foreign-born population - Belarus (%)
Place of birth for the foreign-born population - Bosnia and Herzegovina (%)
Place of birth for the foreign-born population - Bulgaria (%)
Place of birth for the foreign-born population - Croatia (%)
Place of birth for the foreign-born population - Czechoslovakia (%)
Place of birth for the foreign-born population - Hungary (%)
Place of birth for the foreign-born population - Latvia (%)
Place of birth for the foreign-born population - Lithuania (%)
Place of birth for the foreign-born population - North Macedonia (Macedonia) (%)
Place of birth for the foreign-born population - Moldova (%)
Place of birth for the foreign-born population - Poland (%)
Place of birth for the foreign-born population - Romania (%)
Place of birth for the foreign-born population - Russia (%)
Place of birth for the foreign-born population - Serbia (%)
Place of birth for the foreign-born population - Ukraine (%)
Place of birth for the foreign-born population - Other Eastern Europe (%)
Place of birth for the foreign-born population - China (%)
Place of birth for the foreign-born population - Hong Kong (%)
Place of birth for the foreign-born population - Taiwan (%)
Place of birth for the foreign-born population - Japan (%)
Place of birth for the foreign-born population - Korea (%)
Place of birth for the foreign-born population - Other Eastern Asia (%)
Place of birth for the foreign-born population - Afghanistan (%)
Place of birth for the foreign-born population - Bangladesh (%)
Place of birth for the foreign-born population - India (%)
Place of birth for the foreign-born population - Iran (%)
Place of birth for the foreign-born population - Kazakhstan (%)
Place of birth for the foreign-born population - Nepal (%)
Place of birth for the foreign-born population - Pakistan (%)
Place of birth for the foreign-born population - Sri Lanka (%)
Place of birth for the foreign-born population - Uzbekistan (%)
Place of birth for the foreign-born population - Other South Central Asia (%)
Place of birth for the foreign-born population - Burma (%)
Place of birth for the foreign-born population - Cambodia (%)
Place of birth for the foreign-born population - Indonesia (%)
Place of birth for the foreign-born population - Laos (%)
Place of birth for the foreign-born population - Malaysia (%)
Place of birth for the foreign-born population - Philippines (%)
Place of birth for the foreign-born population - Singapore (%)
Place of birth for the foreign-born population - Thailand (%)
Place of birth for the foreign-born population - Vietnam (%)
Place of birth for the foreign-born population - Other South Eastern Asia (%)
Place of birth for the foreign-born population - Armenia (%)
Place of birth for the foreign-born population - Iraq (%)
Place of birth for the foreign-born population - Israel (%)
Place of birth for the foreign-born population - Jordan (%)
Place of birth for the foreign-born population - Kuwait (%)
Place of birth for the foreign-born population - Lebanon (%)
Place of birth for the foreign-born population - Saudi Arabia (%)
Place of birth for the foreign-born population - Syria (%)
Place of birth for the foreign-born population - Turkey (%)
Place of birth for the foreign-born population - Yemen (%)
Place of birth for the foreign-born population - Other Western Asia (%)
Place of birth for the foreign-born population - Eritrea (%)
Place of birth for the foreign-born population - Ethiopia (%)
Place of birth for the foreign-born population - Kenya (%)
Place of birth for the foreign-born population - Somalia (%)
Place of birth for the foreign-born population - Uganda (%)
Place of birth for the foreign-born population - Zimbabwe (%)
Place of birth for the foreign-born population - Other Eastern Africa (%)
Place of birth for the foreign-born population - Cameroon (%)
Place of birth for the foreign-born population - Congo (%)
Place of birth for the foreign-born population - Democratic Republic of Congo (Zaire) (%)
Place of birth for the foreign-born population - Other Middle Africa (%)
Place of birth for the foreign-born population - Egypt (%)
Place of birth for the foreign-born population - Morocco (%)
Place of birth for the foreign-born population - Sudan (%)
Place of birth for the foreign-born population - Other Northern Africa (%)
Place of birth for the foreign-born population - South Africa (%)
Place of birth for the foreign-born population - Other Southern Africa (%)
Place of birth for the foreign-born population - Cabo Verde (%)
Place of birth for the foreign-born population - Ghana (%)
Place of birth for the foreign-born population - Liberia (%)
Place of birth for the foreign-born population - Nigeria (%)
Place of birth for the foreign-born population - Senegal (%)
Place of birth for the foreign-born population - Sierra Leone (%)
Place of birth for the foreign-born population - Other Western Africa (%)
Place of birth for the foreign-born population - Australia (%)
Place of birth for the foreign-born population - New Zealand (%)
Place of birth for the foreign-born population - Fiji (%)
Place of birth for the foreign-born population - Micronesia (%)
Place of birth for the foreign-born population - Bahamas (%)
Place of birth for the foreign-born population - Barbados (%)
Place of birth for the foreign-born population - Cuba (%)
Place of birth for the foreign-born population - Dominica (%)
Place of birth for the foreign-born population - Dominican Republic (%)
Place of birth for the foreign-born population - Grenada (%)
Place of birth for the foreign-born population - Haiti (%)
Place of birth for the foreign-born population - Jamaica (%)
Place of birth for the foreign-born population - St. Vincent and the Grenadines (%)
Place of birth for the foreign-born population - Trinidad and Tobago (%)
Place of birth for the foreign-born population - West Indies (%)
Place of birth for the foreign-born population - Other Caribbean (%)
Place of birth for the foreign-born population - Belize (%)
Place of birth for the foreign-born population - Costa Rica (%)
Place of birth for the foreign-born population - El Salvador (%)
Place of birth for the foreign-born population - Guatemala (%)
Place of birth for the foreign-born population - Honduras (%)
Place of birth for the foreign-born population - Mexico (%)
Place of birth for the foreign-born population - Nicaragua (%)
Place of birth for the foreign-born population - Panama (%)
Place of birth for the foreign-born population - Other Central America (%)
Place of birth for the foreign-born population - Argentina (%)
Place of birth for the foreign-born population - Bolivia (%)
Place of birth for the foreign-born population - Brazil (%)
Place of birth for the foreign-born population - Chile (%)
Place of birth for the foreign-born population - Colombia (%)
Place of birth for the foreign-born population - Ecuador (%)
Place of birth for the foreign-born population - Guyana (%)
Place of birth for the foreign-born population - Peru (%)
Place of birth for the foreign-born population - Uruguay (%)
Place of birth for the foreign-born population - Venezuela (%)
Place of birth for the foreign-born population - Other South America (%)
Place of birth for the foreign-born population - Canada (%)
Place of birth for the foreign-born population - Other Northern America (%)
Place of birth for the foreign-born population - Other (%)
Latest news about races in Gulfport, FL collected exclusively by city-data.com from local newspapers, TV, and radio stations
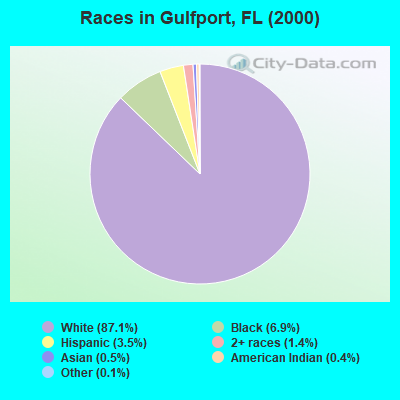
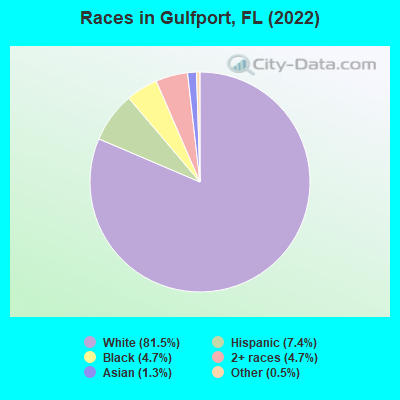
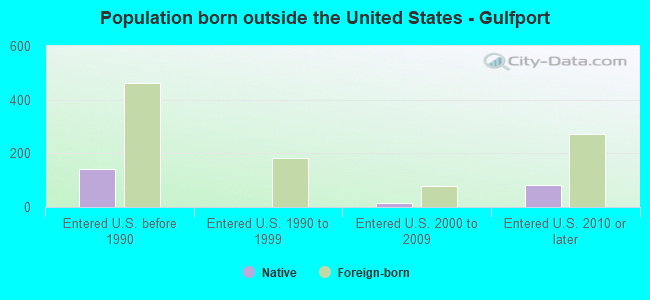
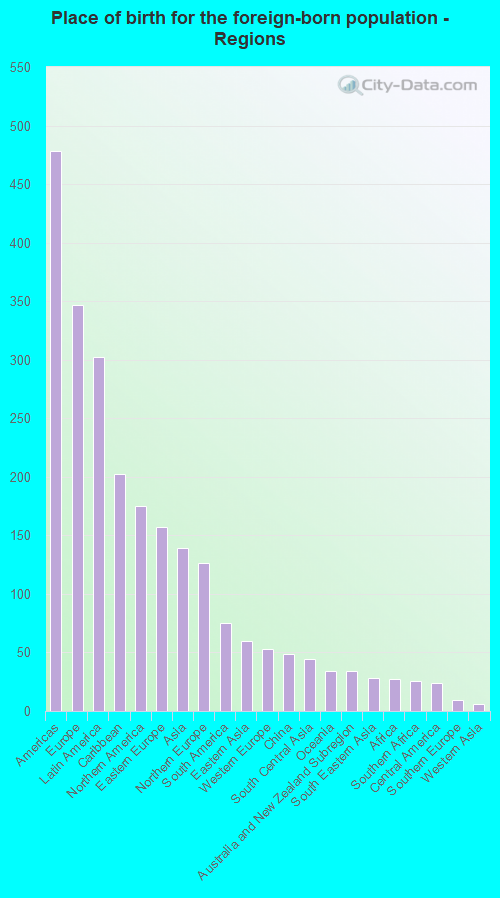
According to 2022 data, the most numerous races in Gulfport, FL are White alone (9,629 residents), Hispanic (876 residents), and Black alone (553 residents). 90.6% of Gulfport residents speak English at home. 8.7% of Gulfport, FL residents are foreign-born (2.8% born in Europe, 2.4% born in Latin America, 1.4% born in North America, 1.1% born in Asia), which is 141.9% less than the foreign-born rate of 21.0% across the entire state of Florida.
Race distribution in Gulfport
2000 2022
10,458,509 65.4% White alone 2,682,715 16.8% Hispanic 2,264,268 14.2% Black alone 261,693 1.6% Asian alone 236,954 1.5% Two or more races 42,358 0.3% American Indian alone 28,994 0.2% Other race alone 6,887 0.04% Native Hawaiian and Other
11,309,403 50.8% White alone 6,025,039 27.1% Hispanic 3,241,015 14.6% Black alone 861,630 3.9% Two or more races 623,692 2.8% Asian alone 152,054 0.7% Other race alone 22,504 0.1% American Indian alone 9,486 0.04% Native Hawaiian and Other
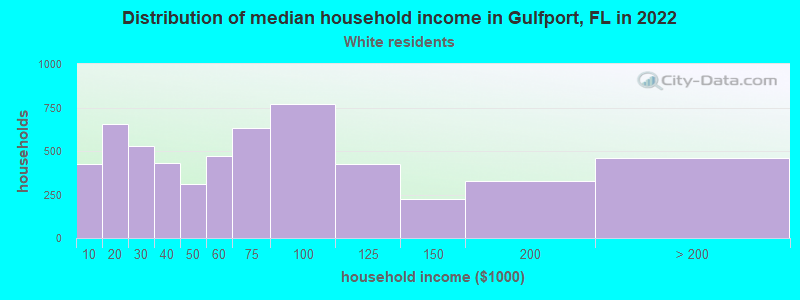
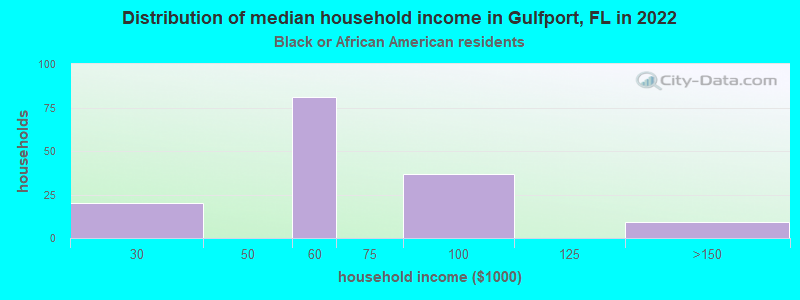
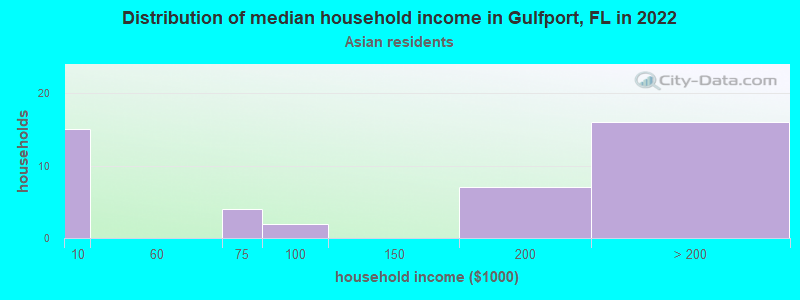
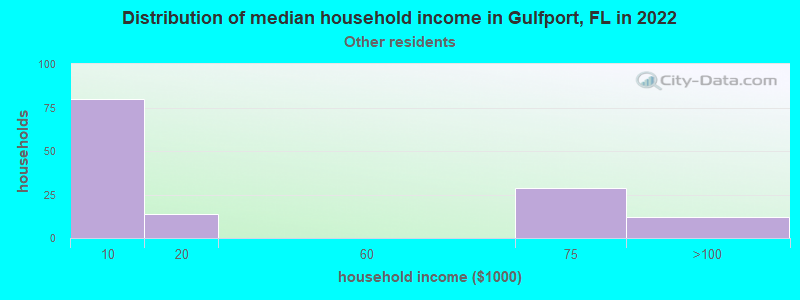
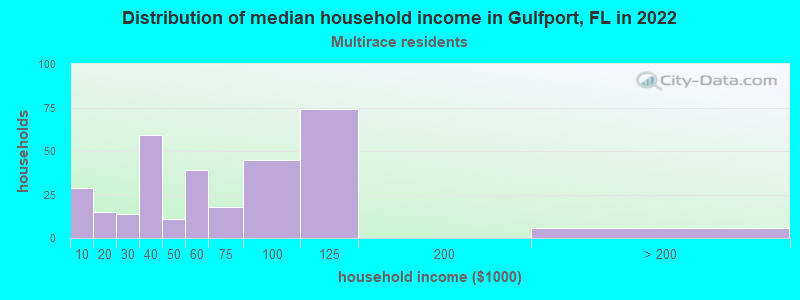
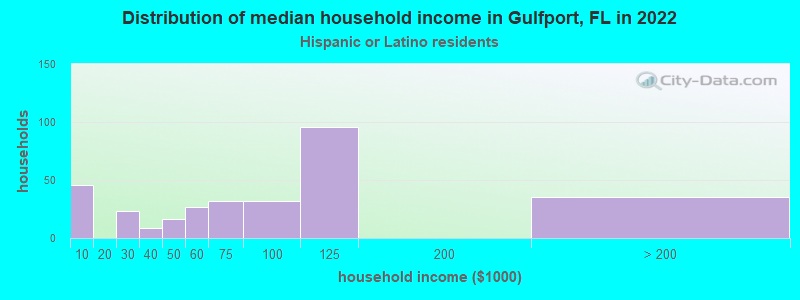
Income and house value in Gulfport Median household income in 2022 $60,504 White non-Hispanic householders$53,629 Black householders$54,910 Two or more races householders$73,074 Hispanic or Latino race householdersMedian 2022 house value $372,710 White Non-Hispanic householders$289,096 Black or African American householders$300,573 Native Hawaiian and other Pacific Islander householders$355,222 Some other race householders$267,236 Two or more races householders$355,222 Hispanic or Latino householders
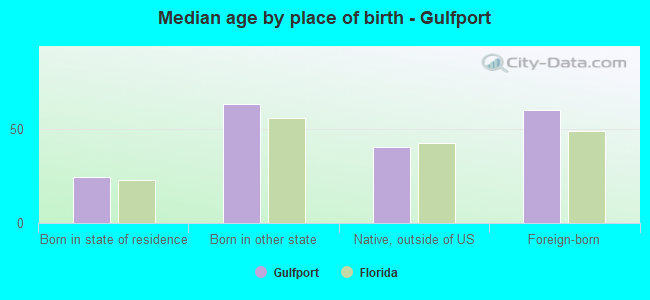
Median age by race in Gulfport
62.4 Median age for White residents61.6 63.5 49.6 Median age for Black or African American residents17.9 52.6 -323,450,134.4 Median age for American Indian / Alaska Native residents-535,303,776.1 -323,863,636.0 39.3 Median age for Asian residents1.9 50.1 -556,089,743.0 Median age for Native Hawaiian / Pacific Islander residents-663,446,054.1 -373,522,458.3 53.5 Median age for Other race residents36.5 56.5 40.0 Median age for Two or more races residents31.3 56.4 62.3 Median age for White alone residents61.6 63.4 42.3 Median age for Hispanic or Latino residents35.7 52.8
Owner/renter occupied households by race in Gulfport
House owners and renters - White residents 4,277 76.0% Owner occupied1,353 24.0% Renter occupiedHouse owners and renters - Black or African American residents 42 26.2% Owner occupied119 73.8% Renter occupiedHouse owners and renters - Asian residents 42 100.0% Owner occupiedHouse owners and renters - Native Hawaiian / Pacific Islander residents 1 100.0% Owner occupiedHouse owners and renters - Other race residents 12 9.1% Owner occupied124 90.9% Renter occupiedHouse owners and renters - Two or more races residents 158 50.6% Owner occupied154 49.4% Renter occupiedHouse owners and renters - White alone residents 4,250 75.4% Owner occupied1,387 24.6% Renter occupiedHouse owners and renters - Hispanic or Latino residents 176 60.8% Owner occupied113 39.2% Renter occupied
Language usage in Gulfport
English speakers - Total 90.6% of residents of Gulfport speak English at home.
4.2% of residents speak Spanish at home 366 75.9% Speak English very well116 24.1% Speak English less than very well4.7% of residents speak other language at home 296 54.5% Speak English very well247 45.5% Speak English less than very well
English speakers - Born in the United States 96.4% of residents of Gulfport speak English at home.
2.3% of residents speak Spanish at home 194 100.0% Speak English very well1.3% of residents speak other language at home 61 55.0% Speak English very well50 45.0% Speak English less than very well
English speakers - Native, born elsewhere 59.3% of residents of Gulfport speak English at home.
29.9% of residents speak Spanish at home 61 100.0% Speak English very well6.4% of residents speak other language at home 13 100.0% Speak English very well
English speakers - Foreign-born 42.0% of residents of Gulfport speak English at home.
17.0% of residents speak Spanish at home 63 36.6% Speak English very well109 63.4% Speak English less than very well39.8% of residents speak other language at home 197 48.9% Speak English very well206 51.1% Speak English less than very well
White (Caucasian) - Speak only English Native:
98.8% (8,738)Foreign-born:
52.7% (325)
White (Caucasian) - Speak another language Native:
1.8% (162)Foreign-born:
47.7% (295)
Black or African American - Speak only English Native:
84.5% (393)Foreign-born:
24.6% (18)
Black or African American - Speak another language Native:
10.9% (51)Foreign-born:
66.9% (50)
Asian - Speak only English Native:
90.8% (52)Foreign-born:
68.7% (45)
Asian - Speak another language Native:
7.5% (4)Foreign-born:
32.2% (21)
Other race - Speak only English Native:
31.9% (26)Foreign-born:
9.7% (9)
Other race - Speak another language Native:
67.8% (55)Foreign-born:
91.0% (89)
Two or more races - Speak only English Native:
80.4% (800)Foreign-born:
16.4% (21)
Two or more races - Speak another language Native:
19.9% (198)Foreign-born:
83.6% (104)
White alone - Speak only English Native:
98.9% (8,689)Foreign-born:
50.7% (342)
White alone - Speak another language Native:
1.4% (123)Foreign-born:
48.0% (324)
Hispanic or Latino - Speak only English Native:
59.0% (363)Foreign-born:
5.8% (9)
Hispanic or Latino - Speak another language Native:
40.3% (248)Foreign-born:
95.1% (145)
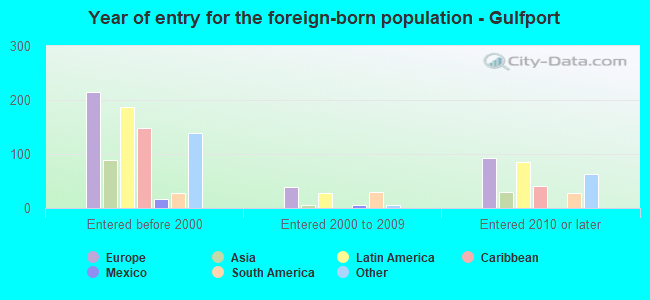
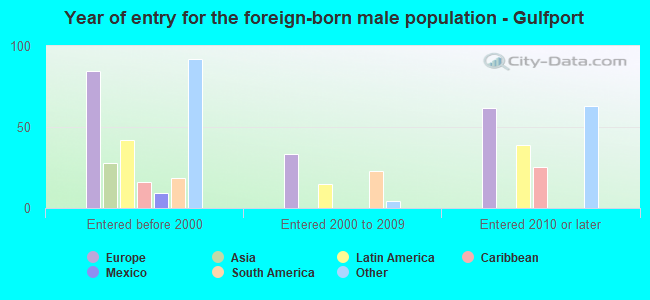
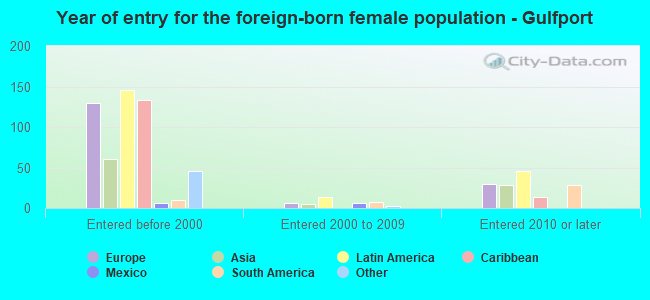
Foreign-born residents in Gulfport 1,026 residents are foreign born (2.8% Europe , 2.4% Latin America , 1.4% North America , 1.1% Asia ).
This city:
8.7%Florida:
21.1%
Marital status for residents in Gulfport Marital status - White (Caucasian) population 15 years and over
Males 29.8% Never married47.2% Now married1.2% Separated5.0% Widowed16.8% DivorcedFemales 21.2% Never married41.1% Now married2.2% Separated13.8% Widowed21.7% DivorcedWomen who gave birth in the past 12 months Now married:
82.7% (40)Unmarried:
17.3% (8)
Women who did not give birth in the past 12 months Now married:
29.0% (322)Unmarried:
71.0% (790)
Marital status - Black or African American population 15 years and over
Males 63.9% Never married33.0% Now married0.0% Separated0.0% Widowed3.1% DivorcedFemales 36.4% Never married24.0% Now married0.0% Separated29.8% Widowed9.8% DivorcedWomen who did not give birth in the past 12 months Now married:
33.3% (42)Unmarried:
66.7% (84)
Marital status - Asian population 15 years and over
Males 40.0% Never married60.0% Now married0.0% Separated0.0% Widowed0.0% DivorcedFemales 20.4% Never married65.5% Now married0.0% Separated14.2% Widowed0.0% DivorcedWomen who did not give birth in the past 12 months Now married:
61.0% (35)Unmarried:
39.0% (22)
Marital status - Other race population 15 years and over
Males 14.3% Never married85.7% Now married0.0% Separated0.0% Widowed0.0% DivorcedFemales 22.4% Never married12.9% Now married0.0% Separated23.5% Widowed41.2% DivorcedWomen who did not give birth in the past 12 months Now married:
0.0% (0)Unmarried:
100.0% (28)
Marital status - Two or more races population 15 years and over
Males 37.5% Never married51.1% Now married4.6% Separated0.0% Widowed6.8% DivorcedFemales 19.1% Never married37.2% Now married24.2% Separated2.5% Widowed17.0% DivorcedWomen who did not give birth in the past 12 months Now married:
63.7% (126)Unmarried:
36.3% (72)
Marital status - White alone, not Hispanic / Latino population 15 years and over
Males 28.9% Never married47.4% Now married1.2% Separated5.2% Widowed17.4% DivorcedFemales 21.3% Never married41.0% Now married1.7% Separated14.1% Widowed21.9% DivorcedWomen who gave birth in the past 12 months Now married:
82.7% (42)Unmarried:
17.3% (9)
Women who did not give birth in the past 12 months Now married:
28.3% (315)Unmarried:
71.7% (799)
Marital status - Hispanic or Latino population 15 years and over
Males 42.9% Never married46.4% Now married4.4% Separated0.0% Widowed6.4% DivorcedFemales 11.6% Never married49.1% Now married8.2% Separated9.1% Widowed22.0% DivorcedWomen who did not give birth in the past 12 months Now married:
74.2% (77)Unmarried:
25.8% (27)
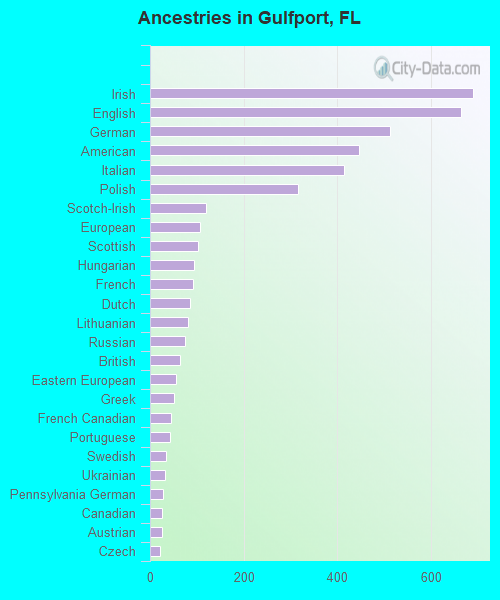
Ancestries in Gulfport
690 13.0% Irish665 12.5% English513 9.7% German446 8.4% American415 7.8% Italian317 6.0% Polish120 2.3% Scotch-Irish107 2.0% European102 1.9% Scottish93 1.8% Hungarian91 1.7% French85 1.6% Dutch81 1.5% Lithuanian75 1.4% Russian64 1.2% British55 1.0% Eastern European51 1.0% Greek45 0.8% French Canadian42 0.8% Portuguese35 0.7% Swedish33 0.6% Ukrainian28 0.5% Pennsylvania German26 0.5% Canadian25 0.5% Austrian21 0.4% Czech14 0.3% Australian13 0.2% Guyanese13 0.2% Slovene11 0.2% Swiss11 0.2% Albanian9 0.2% African8 0.2% Welsh7 0.1% Croatian7 0.1% Norwegian1 0.02% Ethiopian1 0.02% Egyptian
Children Nativity (place of birth) in Gulfport
Children under 6 years - Living with two parents Both parents native 147 100.0% NativeBoth parents foreign-born 37 100.0% NativeOne native, one foreign-born parent 33 100.0% NativeChildren under 6 years - Living with one parent Native parent 131 100.0% NativeChildren 6 to 17 years - Living with two parents Both parents native 151 100.0% NativeChildren 6 to 17 years - Living with one parent Native parent 341 100.0% NativeForeign-born parent 34 50.7% Native33 49.3% Foreign-born